0
2022
Airships Market

Airships Market

by Class (Small, Medium, Large), by Operation (Manned, Unmanned), by Architecture (Non Rigid, Rigid, Semi Rigid), by Application (Tourism and Recreational, Research and Surveillance, Advertisement and Cargo, Military and Communication): Global Opportunity Analysis and Industry Forecast, 2021-2031

Report Code: A06226
Oct 2022 | Pages: 271
Tables: 201
Charts: 68
  • Formats*:

  • pdf

    Single User License, Five User
    License & Enterprise User License

  • xls

    Data Pack Excel License

  • ppt

    It comes with the additional cost
    of $2500.00 contact sales.


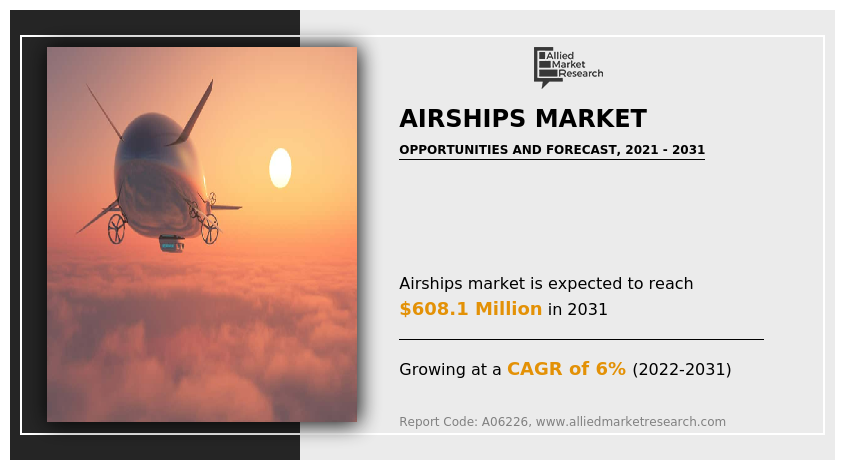
The global airships market was valued at $349.2 million in 2021, and is projected to reach $608.1 million by 2031, growing at a CAGR of 6% from 2022 to 2031.

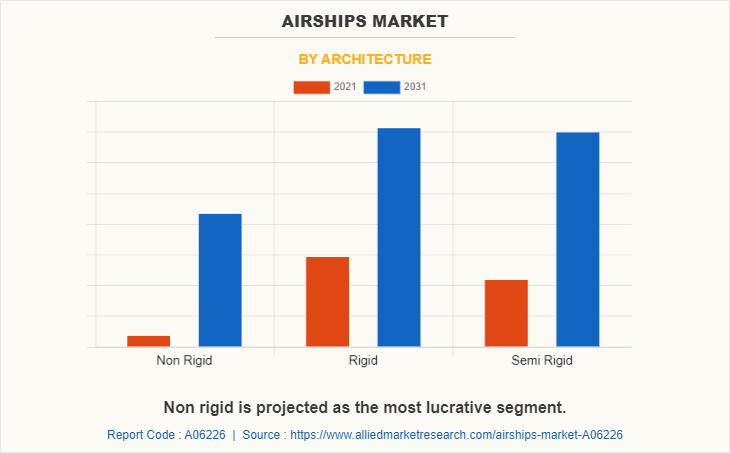
Airships also termed as dirigible balloon is a type of aerostat or lighter-than-air aircraft that can navigate through the air under its own power. Aerostats gain their lift from large gasbags filled with a lifting gas that is less dense than the surrounding air. In early airship, the lifting gas used was hydrogen, due to its high lifting capacity and ready availability. Unlike hydrogen, helium gas has almost the same lifting capacity and is not flammable, but is rare and relatively expensive. The main types of airships are non-rigid, semi-rigid, and rigid. Non-rigid airships, often called "blimps", rely on internal pressure to maintain their shape. Semi-rigid airships maintain the envelope shape by internal pressure, but have some form of supporting structure, such as a fixed keel, attached to it. Rigid airships have an outer structural framework that maintain the shape and carry all structural loads, while the lifting gas is contained in one or more internal gasbags or cells. These airships are highly used for advertising and covering sport events. Apart from this, airship also finds its applications in transporting cargo and military.
Airships Market

Growth of airship market is driven by factors such as increased demand of surveillance in confined areas, trend of mega advertisement, live streaming of events and bolstering aerial recreational and sightseeing activities to support the demand of airship within the forecast period. In addition, advertising on airships has been analyzed to be much more cost effective compared to other forms of advertising, which boosts the growth of the market. Apart from advertising, the tremendous capacity of these airships to handle weight and transport over distances with negligible cost is driving the airship industry in the logistic sector. However, factors that restrain the growth of the airships market include risky operation due to use of hydrogen gas which is highly inflammable, followed by complex and higher installation cost.

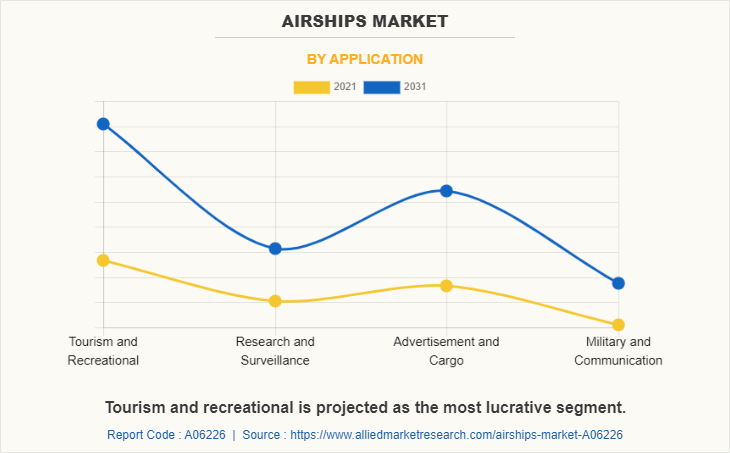
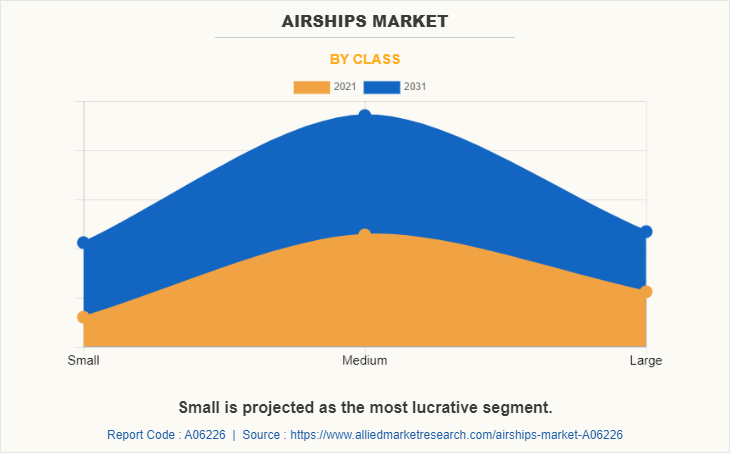
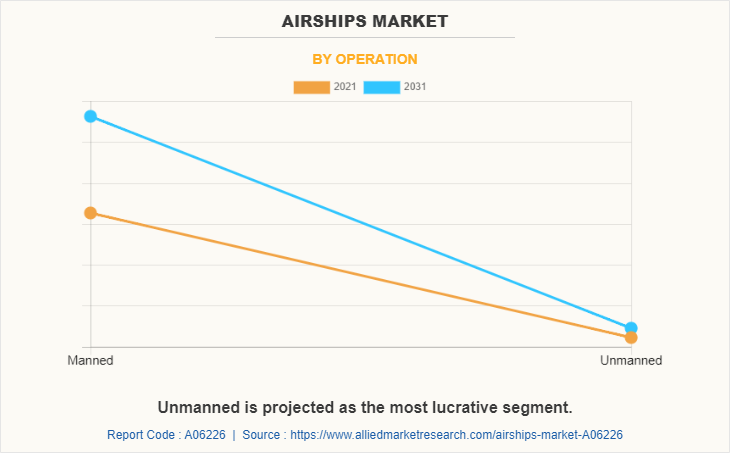
The global airship market is segmented on the basis of class, operation, architecture and application. By class the market is fragmented by small, medium and large. Based on operations, the market is bifurcated into manned and unmanned. With respect to architecture, the market is divided into non-rigid, rigid and semi-rigid. The application segment is divided into tourism and recreational, research and surveillance, advertisement and cargo, and military and communication. By region, the market is divided into North America, Europe, Asia-Pacific and LAMEA
Airships Market

Companies have adopted product development and product launch as their key development strategies in the airship industry. Moreover, collaborations and acquisitions are expected to enable leading players to enhance their product portfolios and expand into different regions. The key players operating in the airship market are Lockheed Martin Corporation, Airborne Industries Inc., Zeppelin Luftschifftechnik GmbH, Hybrid Air Vehicles Ltd., Lindstrand Technologies Ltd., Shanghai Vantage Airship Manufacture Co. Ltd, Information Systems Laboratories Inc., Skyship Services Inc., RosAeroSystems s.r.a., GEFA-FLUG, Sceye Inc., Vantage Airship, West Deutsche Luftwerbung GmbH, Worldwide Aeros, CargoLifter AG, Boeing and Varialift Airships.
Airships Market

Surge in Need for Surveillance Driving Market Growth

Airships are one of the most economical aerial instruments for operations such as surveillance, transportation, logistic, and others. Airships had been used by military since World War I. For instance, Germany used its famous Zeppelin airships to carry out bombing raids in the First World War, inspiring the British Royal Navy to create their own B-Class airships for detecting German submarines. Since then, airships have mainly been used as aerial surveillance for military forces.

The rise in demand for environmental monitoring and remote communication is major factor supporting the growth of the airship market. Airships are cost effective means of surveillance, widely used by commercial, military and government bodies. Companies operating within the market are innovating semi-rigid airship as they are widely used across all industries and integrating them with several other technologies to proliferate its scope of operations. For instance, in June 2022, Scene Inc., that wants to bring broadband to more remote areas and monitor methane and other emissions from the oil and gas industry launched one of its airships from the New Mexico desert.

Increase in usage of airships in marketing activities

The rise in market competitiveness across the globe has allowed major brand to experiment with new ways of advertisement and branding. It has become essential to promote a particular product or service in front of targeted audience to establish brand recognition and create awareness. Airships is expected to play a major role in branding and marketing industry. Apart from the complex installation process, airships are easy to operate and minimal regulatory requirement to operate has allowed airship market to witness notable opportunities with mass communication and media industry. Branding on either side of a blimp, playing pre-recorded videos, or doing a live broadcast are among the major marketing activities performed via airships.
Airships Market

Electric Drones Hamper Demand for Airships

There is a rapid increase in the demand for electric drones, for surveillance purposes, which, in turn, are replacing airships. Drones are small in size, easy to transport and competitively economical as compared to a single blimp. Also, significant difference in initial acquisition cost and operating cost is also challenging the airship market. Ease of maneuver and more features and control over drone restrain the market within the surveillance segment. However, airship is predominantly used for surveillance of large areas whereas drones are used to survey small region with higher accuracy.

Apart from that the drones are much economical option as compared to airships. The initial installation cost, and high associated cost of storage and other operations along with potential risk associated with its operations are some of the major market challenges that hinder the market growth. Airships are considerably bigger in size and need specific hangers associated with the storage of airships, adding to its cost of ownership. Possibilities of fire, explosion, forces landing, and inoperability in strong winds are some of the other factors adding on to the challenges of airships. The rise in cost of helium gas in global market in line with increase in need of this gas for regular operations is impacting the operational cost of airships. Apart from that, scarcity of skilled individuals capable of operating airships is also one of the major factors limiting business opportunities. According to the Federal Aviation Administration, only 128 people in the U.S. are qualified to fly airships. And only 17 of them are paid to do it full time. On an average, it takes an average of 10 to 15 flight hours to gain experience of single engine general aviation aircraft whereas it takes unto 250 to 400 flight hours before conducting independent airship flights.
Airships Market

Sustainable & Eco-friendly Designs Growing Prominent in Airships

Key players operating at the global level are expanding their footprint by engaging in mergers and acquisitions with several players in the industry. Companies are receiving grants of their first patent to support the use of sustainable and eco-friendly transportation for designing & construction of airships that works on 100% green prototype. The airship market is likely to expand at a healthy growth rate during the forecast period. The rise in need for safety and security across the globe is driving the demand for surveillance, which, in turn, is propelling the growth of the airship market. Apart from advertisement and surveillance, companies in the market are tapping revenue opportunities through commercial tours by offering sightseeing trips over the German countryside.

Airships are a cost-effective means of surveillance, whether in military or in other areas. Semi-rigid and rigid airships are widely used across the globe. For instance, in May 2022, high-altitude inflatables airship, flying at between 60,000 and 90,000 feet, was be added to the Pentagon‐â„¢s extensive surveillance network and could eventually be used to track hypersonic weapons.
Airships Market

The airship market has witnessed a moderate impact of COVID-19. While there was no major impact towards its operation as airships were not grounded for longer timeframe. However, the manufacturing industry experienced a notable business impact due to lack of resources and raw materials. Also, the storage of airship in hangers attracted additional cost which impacted business profits.

Key Benefits For Stakeholders

  • This report provides a quantitative analysis of the market segments, current trends, estimations, and dynamics of the airships market analysis from 2021 to 2031 to identify the prevailing airships market opportunities.
  • The market research is offered along with information related to key drivers, restraints, and opportunities.
  • Porter's five forces analysis highlights the potency of buyers and suppliers to enable stakeholders make profit-oriented business decisions and strengthen their supplier-buyer network.
  • In-depth analysis of the airships market segmentation assists to determine the prevailing market opportunities.
  • Major countries in each region are mapped according to their revenue contribution to the global market.
  • Market player positioning facilitates benchmarking and provides a clear understanding of the present position of the market players.
  • The report includes the analysis of the regional as well as global airships market trends, key players, market segments, application areas, and market growth strategies.

Airships Market Report Highlights

Aspects Details
Market Size By 2031 USD 608.1 million
Growth Rate CAGR of 6%
Forecast period 2021 - 2031
Report Pages 271
By Architecture
  • Non Rigid
  • Rigid
  • Semi Rigid
By Application
  • Tourism and Recreational
  • Research and Surveillance
  • Advertisement and Cargo
  • Military and Communication
By Class
  • Small
  • Medium
  • Large
By Operation
  • Manned
  • Unmanned
By Region
  • North America  (U.S., Canada, Mexico)
  • Europe  (UK, Germany, France, Russia, Italy, Spain, Rest Of Europe)
  • Asia-Pacific  (China, India, Japan, Australia, South Korea, Rest Of Asia-Pacific)
  • LAMEA  (Latin America, Middle East, South Africa)
Key Market Players Aeros, Lindstrand Technologies Limited, Lockheed Martin Corporation, Skyship Services, Inc., Vantage Airship, RosAero Systems, Hybrid Air Vehicles, Cargolifter, Zeppelin Luftschifftechnik GmbH, WDL Luftschiffgesellschaft mbH, Sceye Inc., Boeing, Airborne, Varialift, GEFA-FLUG
 
  • CHAPTER 1:INTRODUCTION

    • 1.1.Report description

    • 1.2.Key market segments

    • 1.3.Key benefits to the stakeholders

    • 1.4.Research Methodology

      • 1.4.1.Secondary research

      • 1.4.2.Primary research

      • 1.4.3.Analyst tools and models

  • CHAPTER 2:EXECUTIVE SUMMARY

    • 2.1.Key findings of the study

    • 2.2.CXO Perspective

  • CHAPTER 3:MARKET OVERVIEW

    • 3.1.Market definition and scope

    • 3.2.Key findings

      • 3.2.1.Top investment pockets

    • 3.3.Porter’s five forces analysis

    • 3.4.Top player positioning

    • 3.5.Market dynamics

      • 3.5.1.Drivers

      • 3.5.2.Restraints

      • 3.5.3.Opportunities

    • 3.6.COVID-19 Impact Analysis on the market

  • CHAPTER 4: AIRSHIPS MARKET, BY CLASS

    • 4.1 Overview

      • 4.1.1 Market size and forecast

    • 4.2 Small

      • 4.2.1 Key market trends, growth factors and opportunities

      • 4.2.2 Market size and forecast, by region

      • 4.2.3 Market analysis by country

    • 4.3 Medium

      • 4.3.1 Key market trends, growth factors and opportunities

      • 4.3.2 Market size and forecast, by region

      • 4.3.3 Market analysis by country

    • 4.4 Large

      • 4.4.1 Key market trends, growth factors and opportunities

      • 4.4.2 Market size and forecast, by region

      • 4.4.3 Market analysis by country

  • CHAPTER 5: AIRSHIPS MARKET, BY OPERATION

    • 5.1 Overview

      • 5.1.1 Market size and forecast

    • 5.2 Manned

      • 5.2.1 Key market trends, growth factors and opportunities

      • 5.2.2 Market size and forecast, by region

      • 5.2.3 Market analysis by country

    • 5.3 Unmanned

      • 5.3.1 Key market trends, growth factors and opportunities

      • 5.3.2 Market size and forecast, by region

      • 5.3.3 Market analysis by country

  • CHAPTER 6: AIRSHIPS MARKET, BY ARCHITECTURE

    • 6.1 Overview

      • 6.1.1 Market size and forecast

    • 6.2 Non Rigid

      • 6.2.1 Key market trends, growth factors and opportunities

      • 6.2.2 Market size and forecast, by region

      • 6.2.3 Market analysis by country

    • 6.3 Rigid

      • 6.3.1 Key market trends, growth factors and opportunities

      • 6.3.2 Market size and forecast, by region

      • 6.3.3 Market analysis by country

    • 6.4 Semi Rigid

      • 6.4.1 Key market trends, growth factors and opportunities

      • 6.4.2 Market size and forecast, by region

      • 6.4.3 Market analysis by country

  • CHAPTER 7: AIRSHIPS MARKET, BY APPLICATION

    • 7.1 Overview

      • 7.1.1 Market size and forecast

    • 7.2 Tourism and Recreational

      • 7.2.1 Key market trends, growth factors and opportunities

      • 7.2.2 Market size and forecast, by region

      • 7.2.3 Market analysis by country

    • 7.3 Research and Surveillance

      • 7.3.1 Key market trends, growth factors and opportunities

      • 7.3.2 Market size and forecast, by region

      • 7.3.3 Market analysis by country

    • 7.4 Advertisement and Cargo

      • 7.4.1 Key market trends, growth factors and opportunities

      • 7.4.2 Market size and forecast, by region

      • 7.4.3 Market analysis by country

    • 7.5 Military and Communication

      • 7.5.1 Key market trends, growth factors and opportunities

      • 7.5.2 Market size and forecast, by region

      • 7.5.3 Market analysis by country

  • CHAPTER 8: AIRSHIPS MARKET, BY REGION

    • 8.1 Overview

      • 8.1.1 Market size and forecast

    • 8.2 North America

      • 8.2.1 Key trends and opportunities

      • 8.2.2 North America Market size and forecast, by Class

      • 8.2.3 North America Market size and forecast, by Operation

      • 8.2.4 North America Market size and forecast, by Architecture

      • 8.2.5 North America Market size and forecast, by Application

      • 8.2.6 North America Market size and forecast, by country

        • 8.2.6.1 U.S.
          • 8.2.6.1.1 Market size and forecast, by Class
          • 8.2.6.1.2 Market size and forecast, by Operation
          • 8.2.6.1.3 Market size and forecast, by Architecture
          • 8.2.6.1.4 Market size and forecast, by Application
        • 8.2.6.2 Canada
          • 8.2.6.2.1 Market size and forecast, by Class
          • 8.2.6.2.2 Market size and forecast, by Operation
          • 8.2.6.2.3 Market size and forecast, by Architecture
          • 8.2.6.2.4 Market size and forecast, by Application
        • 8.2.6.3 Mexico
          • 8.2.6.3.1 Market size and forecast, by Class
          • 8.2.6.3.2 Market size and forecast, by Operation
          • 8.2.6.3.3 Market size and forecast, by Architecture
          • 8.2.6.3.4 Market size and forecast, by Application
    • 8.3 Europe

      • 8.3.1 Key trends and opportunities

      • 8.3.2 Europe Market size and forecast, by Class

      • 8.3.3 Europe Market size and forecast, by Operation

      • 8.3.4 Europe Market size and forecast, by Architecture

      • 8.3.5 Europe Market size and forecast, by Application

      • 8.3.6 Europe Market size and forecast, by country

        • 8.3.6.1 UK
          • 8.3.6.1.1 Market size and forecast, by Class
          • 8.3.6.1.2 Market size and forecast, by Operation
          • 8.3.6.1.3 Market size and forecast, by Architecture
          • 8.3.6.1.4 Market size and forecast, by Application
        • 8.3.6.2 Germany
          • 8.3.6.2.1 Market size and forecast, by Class
          • 8.3.6.2.2 Market size and forecast, by Operation
          • 8.3.6.2.3 Market size and forecast, by Architecture
          • 8.3.6.2.4 Market size and forecast, by Application
        • 8.3.6.3 France
          • 8.3.6.3.1 Market size and forecast, by Class
          • 8.3.6.3.2 Market size and forecast, by Operation
          • 8.3.6.3.3 Market size and forecast, by Architecture
          • 8.3.6.3.4 Market size and forecast, by Application
        • 8.3.6.4 Russia
          • 8.3.6.4.1 Market size and forecast, by Class
          • 8.3.6.4.2 Market size and forecast, by Operation
          • 8.3.6.4.3 Market size and forecast, by Architecture
          • 8.3.6.4.4 Market size and forecast, by Application
        • 8.3.6.5 Italy
          • 8.3.6.5.1 Market size and forecast, by Class
          • 8.3.6.5.2 Market size and forecast, by Operation
          • 8.3.6.5.3 Market size and forecast, by Architecture
          • 8.3.6.5.4 Market size and forecast, by Application
        • 8.3.6.6 Spain
          • 8.3.6.6.1 Market size and forecast, by Class
          • 8.3.6.6.2 Market size and forecast, by Operation
          • 8.3.6.6.3 Market size and forecast, by Architecture
          • 8.3.6.6.4 Market size and forecast, by Application
        • 8.3.6.7 Rest of Europe
          • 8.3.6.7.1 Market size and forecast, by Class
          • 8.3.6.7.2 Market size and forecast, by Operation
          • 8.3.6.7.3 Market size and forecast, by Architecture
          • 8.3.6.7.4 Market size and forecast, by Application
    • 8.4 Asia-Pacific

      • 8.4.1 Key trends and opportunities

      • 8.4.2 Asia-Pacific Market size and forecast, by Class

      • 8.4.3 Asia-Pacific Market size and forecast, by Operation

      • 8.4.4 Asia-Pacific Market size and forecast, by Architecture

      • 8.4.5 Asia-Pacific Market size and forecast, by Application

      • 8.4.6 Asia-Pacific Market size and forecast, by country

        • 8.4.6.1 China
          • 8.4.6.1.1 Market size and forecast, by Class
          • 8.4.6.1.2 Market size and forecast, by Operation
          • 8.4.6.1.3 Market size and forecast, by Architecture
          • 8.4.6.1.4 Market size and forecast, by Application
        • 8.4.6.2 India
          • 8.4.6.2.1 Market size and forecast, by Class
          • 8.4.6.2.2 Market size and forecast, by Operation
          • 8.4.6.2.3 Market size and forecast, by Architecture
          • 8.4.6.2.4 Market size and forecast, by Application
        • 8.4.6.3 Japan
          • 8.4.6.3.1 Market size and forecast, by Class
          • 8.4.6.3.2 Market size and forecast, by Operation
          • 8.4.6.3.3 Market size and forecast, by Architecture
          • 8.4.6.3.4 Market size and forecast, by Application
        • 8.4.6.4 Australia
          • 8.4.6.4.1 Market size and forecast, by Class
          • 8.4.6.4.2 Market size and forecast, by Operation
          • 8.4.6.4.3 Market size and forecast, by Architecture
          • 8.4.6.4.4 Market size and forecast, by Application
        • 8.4.6.5 South Korea
          • 8.4.6.5.1 Market size and forecast, by Class
          • 8.4.6.5.2 Market size and forecast, by Operation
          • 8.4.6.5.3 Market size and forecast, by Architecture
          • 8.4.6.5.4 Market size and forecast, by Application
        • 8.4.6.6 Rest of Asia-Pacific
          • 8.4.6.6.1 Market size and forecast, by Class
          • 8.4.6.6.2 Market size and forecast, by Operation
          • 8.4.6.6.3 Market size and forecast, by Architecture
          • 8.4.6.6.4 Market size and forecast, by Application
    • 8.5 LAMEA

      • 8.5.1 Key trends and opportunities

      • 8.5.2 LAMEA Market size and forecast, by Class

      • 8.5.3 LAMEA Market size and forecast, by Operation

      • 8.5.4 LAMEA Market size and forecast, by Architecture

      • 8.5.5 LAMEA Market size and forecast, by Application

      • 8.5.6 LAMEA Market size and forecast, by country

        • 8.5.6.1 Latin America
          • 8.5.6.1.1 Market size and forecast, by Class
          • 8.5.6.1.2 Market size and forecast, by Operation
          • 8.5.6.1.3 Market size and forecast, by Architecture
          • 8.5.6.1.4 Market size and forecast, by Application
        • 8.5.6.2 Middle East
          • 8.5.6.2.1 Market size and forecast, by Class
          • 8.5.6.2.2 Market size and forecast, by Operation
          • 8.5.6.2.3 Market size and forecast, by Architecture
          • 8.5.6.2.4 Market size and forecast, by Application
        • 8.5.6.3 South Africa
          • 8.5.6.3.1 Market size and forecast, by Class
          • 8.5.6.3.2 Market size and forecast, by Operation
          • 8.5.6.3.3 Market size and forecast, by Architecture
          • 8.5.6.3.4 Market size and forecast, by Application
  • CHAPTER 9: COMPANY LANDSCAPE

    • 9.1. Introduction

    • 9.2. Top winning strategies

    • 9.3. Product Mapping of Top 10 Player

    • 9.4. Competitive Dashboard

    • 9.5. Competitive Heatmap

    • 9.6. Key developments

  • CHAPTER 10: COMPANY PROFILES

    • 10.1 Boeing

      • 10.1.1 Company overview

      • 10.1.2 Company snapshot

      • 10.1.3 Operating business segments

      • 10.1.4 Product portfolio

      • 10.1.5 Business performance

      • 10.1.6 Key strategic moves and developments

    • 10.2 Lockheed Martin Corporation

      • 10.2.1 Company overview

      • 10.2.2 Company snapshot

      • 10.2.3 Operating business segments

      • 10.2.4 Product portfolio

      • 10.2.5 Business performance

      • 10.2.6 Key strategic moves and developments

    • 10.3 Airborne

      • 10.3.1 Company overview

      • 10.3.2 Company snapshot

      • 10.3.3 Operating business segments

      • 10.3.4 Product portfolio

      • 10.3.5 Business performance

      • 10.3.6 Key strategic moves and developments

    • 10.4 Zeppelin Luftschifftechnik GmbH

      • 10.4.1 Company overview

      • 10.4.2 Company snapshot

      • 10.4.3 Operating business segments

      • 10.4.4 Product portfolio

      • 10.4.5 Business performance

      • 10.4.6 Key strategic moves and developments

    • 10.5 Hybrid Air Vehicles

      • 10.5.1 Company overview

      • 10.5.2 Company snapshot

      • 10.5.3 Operating business segments

      • 10.5.4 Product portfolio

      • 10.5.5 Business performance

      • 10.5.6 Key strategic moves and developments

    • 10.6 Lindstrand Technologies Limited

      • 10.6.1 Company overview

      • 10.6.2 Company snapshot

      • 10.6.3 Operating business segments

      • 10.6.4 Product portfolio

      • 10.6.5 Business performance

      • 10.6.6 Key strategic moves and developments

    • 10.7 Vantage Airship

      • 10.7.1 Company overview

      • 10.7.2 Company snapshot

      • 10.7.3 Operating business segments

      • 10.7.4 Product portfolio

      • 10.7.5 Business performance

      • 10.7.6 Key strategic moves and developments

    • 10.8 Skyship Services, Inc.

      • 10.8.1 Company overview

      • 10.8.2 Company snapshot

      • 10.8.3 Operating business segments

      • 10.8.4 Product portfolio

      • 10.8.5 Business performance

      • 10.8.6 Key strategic moves and developments

    • 10.9 RosAero Systems

      • 10.9.1 Company overview

      • 10.9.2 Company snapshot

      • 10.9.3 Operating business segments

      • 10.9.4 Product portfolio

      • 10.9.5 Business performance

      • 10.9.6 Key strategic moves and developments

    • 10.10 GEFA-FLUG

      • 10.10.1 Company overview

      • 10.10.2 Company snapshot

      • 10.10.3 Operating business segments

      • 10.10.4 Product portfolio

      • 10.10.5 Business performance

      • 10.10.6 Key strategic moves and developments

    • 10.11 Sceye Inc.

      • 10.11.1 Company overview

      • 10.11.2 Company snapshot

      • 10.11.3 Operating business segments

      • 10.11.4 Product portfolio

      • 10.11.5 Business performance

      • 10.11.6 Key strategic moves and developments

    • 10.12 WDL Luftschiffgesellschaft mbH

      • 10.12.1 Company overview

      • 10.12.2 Company snapshot

      • 10.12.3 Operating business segments

      • 10.12.4 Product portfolio

      • 10.12.5 Business performance

      • 10.12.6 Key strategic moves and developments

    • 10.13 Aeros

      • 10.13.1 Company overview

      • 10.13.2 Company snapshot

      • 10.13.3 Operating business segments

      • 10.13.4 Product portfolio

      • 10.13.5 Business performance

      • 10.13.6 Key strategic moves and developments

    • 10.14 Cargolifter

      • 10.14.1 Company overview

      • 10.14.2 Company snapshot

      • 10.14.3 Operating business segments

      • 10.14.4 Product portfolio

      • 10.14.5 Business performance

      • 10.14.6 Key strategic moves and developments

    • 10.15 Varialift

      • 10.15.1 Company overview

      • 10.15.2 Company snapshot

      • 10.15.3 Operating business segments

      • 10.15.4 Product portfolio

      • 10.15.5 Business performance

      • 10.15.6 Key strategic moves and developments

  • LIST OF TABLES

  • TABLE 1. GLOBAL AIRSHIPS MARKET, BY CLASS, 2021-2031 ($MILLION)
    TABLE 2. AIRSHIPS MARKET, FOR SMALL, BY REGION, 2021-2031 ($MILLION)
    TABLE 3. AIRSHIPS MARKET FOR SMALL, BY COUNTRY, 2021-2031 ($MILLION)
    TABLE 4. AIRSHIPS MARKET, FOR MEDIUM, BY REGION, 2021-2031 ($MILLION)
    TABLE 5. AIRSHIPS MARKET FOR MEDIUM, BY COUNTRY, 2021-2031 ($MILLION)
    TABLE 6. AIRSHIPS MARKET, FOR LARGE, BY REGION, 2021-2031 ($MILLION)
    TABLE 7. AIRSHIPS MARKET FOR LARGE, BY COUNTRY, 2021-2031 ($MILLION)
    TABLE 8. GLOBAL AIRSHIPS MARKET, BY OPERATION, 2021-2031 ($MILLION)
    TABLE 9. AIRSHIPS MARKET, FOR MANNED, BY REGION, 2021-2031 ($MILLION)
    TABLE 10. AIRSHIPS MARKET FOR MANNED, BY COUNTRY, 2021-2031 ($MILLION)
    TABLE 11. AIRSHIPS MARKET, FOR UNMANNED, BY REGION, 2021-2031 ($MILLION)
    TABLE 12. AIRSHIPS MARKET FOR UNMANNED, BY COUNTRY, 2021-2031 ($MILLION)
    TABLE 13. GLOBAL AIRSHIPS MARKET, BY ARCHITECTURE, 2021-2031 ($MILLION)
    TABLE 14. AIRSHIPS MARKET, FOR NON RIGID, BY REGION, 2021-2031 ($MILLION)
    TABLE 15. AIRSHIPS MARKET FOR NON RIGID, BY COUNTRY, 2021-2031 ($MILLION)
    TABLE 16. AIRSHIPS MARKET, FOR RIGID, BY REGION, 2021-2031 ($MILLION)
    TABLE 17. AIRSHIPS MARKET FOR RIGID, BY COUNTRY, 2021-2031 ($MILLION)
    TABLE 18. AIRSHIPS MARKET, FOR SEMI RIGID, BY REGION, 2021-2031 ($MILLION)
    TABLE 19. AIRSHIPS MARKET FOR SEMI RIGID, BY COUNTRY, 2021-2031 ($MILLION)
    TABLE 20. GLOBAL AIRSHIPS MARKET, BY APPLICATION, 2021-2031 ($MILLION)
    TABLE 21. AIRSHIPS MARKET, FOR TOURISM AND RECREATIONAL, BY REGION, 2021-2031 ($MILLION)
    TABLE 22. AIRSHIPS MARKET FOR TOURISM AND RECREATIONAL, BY COUNTRY, 2021-2031 ($MILLION)
    TABLE 23. AIRSHIPS MARKET, FOR RESEARCH AND SURVEILLANCE, BY REGION, 2021-2031 ($MILLION)
    TABLE 24. AIRSHIPS MARKET FOR RESEARCH AND SURVEILLANCE, BY COUNTRY, 2021-2031 ($MILLION)
    TABLE 25. AIRSHIPS MARKET, FOR ADVERTISEMENT AND CARGO, BY REGION, 2021-2031 ($MILLION)
    TABLE 26. AIRSHIPS MARKET FOR ADVERTISEMENT AND CARGO, BY COUNTRY, 2021-2031 ($MILLION)
    TABLE 27. AIRSHIPS MARKET, FOR MILITARY AND COMMUNICATION, BY REGION, 2021-2031 ($MILLION)
    TABLE 28. AIRSHIPS MARKET FOR MILITARY AND COMMUNICATION, BY COUNTRY, 2021-2031 ($MILLION)
    TABLE 29. AIRSHIPS MARKET, BY REGION, 2021-2031 ($MILLION)
    TABLE 30. NORTH AMERICA AIRSHIPS MARKET, BY CLASS, 2021-2031 ($MILLION)
    TABLE 31. NORTH AMERICA AIRSHIPS MARKET, BY OPERATION, 2021-2031 ($MILLION)
    TABLE 32. NORTH AMERICA AIRSHIPS MARKET, BY ARCHITECTURE, 2021-2031 ($MILLION)
    TABLE 33. NORTH AMERICA AIRSHIPS MARKET, BY APPLICATION, 2021-2031 ($MILLION)
    TABLE 34. NORTH AMERICA AIRSHIPS MARKET, BY COUNTRY, 2021-2031 ($MILLION)
    TABLE 35. U.S. AIRSHIPS MARKET, BY CLASS, 2021-2031 ($MILLION)
    TABLE 36. U.S. AIRSHIPS MARKET, BY OPERATION, 2021-2031 ($MILLION)
    TABLE 37. U.S. AIRSHIPS MARKET, BY ARCHITECTURE, 2021-2031 ($MILLION)
    TABLE 38. U.S. AIRSHIPS MARKET, BY APPLICATION, 2021-2031 ($MILLION)
    TABLE 39. CANADA AIRSHIPS MARKET, BY CLASS, 2021-2031 ($MILLION)
    TABLE 40. CANADA AIRSHIPS MARKET, BY OPERATION, 2021-2031 ($MILLION)
    TABLE 41. CANADA AIRSHIPS MARKET, BY ARCHITECTURE, 2021-2031 ($MILLION)
    TABLE 42. CANADA AIRSHIPS MARKET, BY APPLICATION, 2021-2031 ($MILLION)
    TABLE 43. MEXICO AIRSHIPS MARKET, BY CLASS, 2021-2031 ($MILLION)
    TABLE 44. MEXICO AIRSHIPS MARKET, BY OPERATION, 2021-2031 ($MILLION)
    TABLE 45. MEXICO AIRSHIPS MARKET, BY ARCHITECTURE, 2021-2031 ($MILLION)
    TABLE 46. MEXICO AIRSHIPS MARKET, BY APPLICATION, 2021-2031 ($MILLION)
    TABLE 47. EUROPE AIRSHIPS MARKET, BY CLASS, 2021-2031 ($MILLION)
    TABLE 48. EUROPE AIRSHIPS MARKET, BY OPERATION, 2021-2031 ($MILLION)
    TABLE 49. EUROPE AIRSHIPS MARKET, BY ARCHITECTURE, 2021-2031 ($MILLION)
    TABLE 50. EUROPE AIRSHIPS MARKET, BY APPLICATION, 2021-2031 ($MILLION)
    TABLE 51. EUROPE AIRSHIPS MARKET, BY COUNTRY, 2021-2031 ($MILLION)
    TABLE 52. UK AIRSHIPS MARKET, BY CLASS, 2021-2031 ($MILLION)
    TABLE 53. UK AIRSHIPS MARKET, BY OPERATION, 2021-2031 ($MILLION)
    TABLE 54. UK AIRSHIPS MARKET, BY ARCHITECTURE, 2021-2031 ($MILLION)
    TABLE 55. UK AIRSHIPS MARKET, BY APPLICATION, 2021-2031 ($MILLION)
    TABLE 56. GERMANY AIRSHIPS MARKET, BY CLASS, 2021-2031 ($MILLION)
    TABLE 57. GERMANY AIRSHIPS MARKET, BY OPERATION, 2021-2031 ($MILLION)
    TABLE 58. GERMANY AIRSHIPS MARKET, BY ARCHITECTURE, 2021-2031 ($MILLION)
    TABLE 59. GERMANY AIRSHIPS MARKET, BY APPLICATION, 2021-2031 ($MILLION)
    TABLE 60. FRANCE AIRSHIPS MARKET, BY CLASS, 2021-2031 ($MILLION)
    TABLE 61. FRANCE AIRSHIPS MARKET, BY OPERATION, 2021-2031 ($MILLION)
    TABLE 62. FRANCE AIRSHIPS MARKET, BY ARCHITECTURE, 2021-2031 ($MILLION)
    TABLE 63. FRANCE AIRSHIPS MARKET, BY APPLICATION, 2021-2031 ($MILLION)
    TABLE 64. RUSSIA AIRSHIPS MARKET, BY CLASS, 2021-2031 ($MILLION)
    TABLE 65. RUSSIA AIRSHIPS MARKET, BY OPERATION, 2021-2031 ($MILLION)
    TABLE 66. RUSSIA AIRSHIPS MARKET, BY ARCHITECTURE, 2021-2031 ($MILLION)
    TABLE 67. RUSSIA AIRSHIPS MARKET, BY APPLICATION, 2021-2031 ($MILLION)
    TABLE 68. ITALY AIRSHIPS MARKET, BY CLASS, 2021-2031 ($MILLION)
    TABLE 69. ITALY AIRSHIPS MARKET, BY OPERATION, 2021-2031 ($MILLION)
    TABLE 70. ITALY AIRSHIPS MARKET, BY ARCHITECTURE, 2021-2031 ($MILLION)
    TABLE 71. ITALY AIRSHIPS MARKET, BY APPLICATION, 2021-2031 ($MILLION)
    TABLE 72. SPAIN AIRSHIPS MARKET, BY CLASS, 2021-2031 ($MILLION)
    TABLE 73. SPAIN AIRSHIPS MARKET, BY OPERATION, 2021-2031 ($MILLION)
    TABLE 74. SPAIN AIRSHIPS MARKET, BY ARCHITECTURE, 2021-2031 ($MILLION)
    TABLE 75. SPAIN AIRSHIPS MARKET, BY APPLICATION, 2021-2031 ($MILLION)
    TABLE 76. REST OF EUROPE AIRSHIPS MARKET, BY CLASS, 2021-2031 ($MILLION)
    TABLE 77. REST OF EUROPE AIRSHIPS MARKET, BY OPERATION, 2021-2031 ($MILLION)
    TABLE 78. REST OF EUROPE AIRSHIPS MARKET, BY ARCHITECTURE, 2021-2031 ($MILLION)
    TABLE 79. REST OF EUROPE AIRSHIPS MARKET, BY APPLICATION, 2021-2031 ($MILLION)
    TABLE 80. ASIA-PACIFIC AIRSHIPS MARKET, BY CLASS, 2021-2031 ($MILLION)
    TABLE 81. ASIA-PACIFIC AIRSHIPS MARKET, BY OPERATION, 2021-2031 ($MILLION)
    TABLE 82. ASIA-PACIFIC AIRSHIPS MARKET, BY ARCHITECTURE, 2021-2031 ($MILLION)
    TABLE 83. ASIA-PACIFIC AIRSHIPS MARKET, BY APPLICATION, 2021-2031 ($MILLION)
    TABLE 84. ASIA-PACIFIC AIRSHIPS MARKET, BY COUNTRY, 2021-2031 ($MILLION)
    TABLE 85. CHINA AIRSHIPS MARKET, BY CLASS, 2021-2031 ($MILLION)
    TABLE 86. CHINA AIRSHIPS MARKET, BY OPERATION, 2021-2031 ($MILLION)
    TABLE 87. CHINA AIRSHIPS MARKET, BY ARCHITECTURE, 2021-2031 ($MILLION)
    TABLE 88. CHINA AIRSHIPS MARKET, BY APPLICATION, 2021-2031 ($MILLION)
    TABLE 89. INDIA AIRSHIPS MARKET, BY CLASS, 2021-2031 ($MILLION)
    TABLE 90. INDIA AIRSHIPS MARKET, BY OPERATION, 2021-2031 ($MILLION)
    TABLE 91. INDIA AIRSHIPS MARKET, BY ARCHITECTURE, 2021-2031 ($MILLION)
    TABLE 92. INDIA AIRSHIPS MARKET, BY APPLICATION, 2021-2031 ($MILLION)
    TABLE 93. JAPAN AIRSHIPS MARKET, BY CLASS, 2021-2031 ($MILLION)
    TABLE 94. JAPAN AIRSHIPS MARKET, BY OPERATION, 2021-2031 ($MILLION)
    TABLE 95. JAPAN AIRSHIPS MARKET, BY ARCHITECTURE, 2021-2031 ($MILLION)
    TABLE 96. JAPAN AIRSHIPS MARKET, BY APPLICATION, 2021-2031 ($MILLION)
    TABLE 97. AUSTRALIA AIRSHIPS MARKET, BY CLASS, 2021-2031 ($MILLION)
    TABLE 98. AUSTRALIA AIRSHIPS MARKET, BY OPERATION, 2021-2031 ($MILLION)
    TABLE 99. AUSTRALIA AIRSHIPS MARKET, BY ARCHITECTURE, 2021-2031 ($MILLION)
    TABLE 100. AUSTRALIA AIRSHIPS MARKET, BY APPLICATION, 2021-2031 ($MILLION)
    TABLE 101. SOUTH KOREA AIRSHIPS MARKET, BY CLASS, 2021-2031 ($MILLION)
    TABLE 102. SOUTH KOREA AIRSHIPS MARKET, BY OPERATION, 2021-2031 ($MILLION)
    TABLE 103. SOUTH KOREA AIRSHIPS MARKET, BY ARCHITECTURE, 2021-2031 ($MILLION)
    TABLE 104. SOUTH KOREA AIRSHIPS MARKET, BY APPLICATION, 2021-2031 ($MILLION)
    TABLE 105. REST OF ASIA-PACIFIC AIRSHIPS MARKET, BY CLASS, 2021-2031 ($MILLION)
    TABLE 106. REST OF ASIA-PACIFIC AIRSHIPS MARKET, BY OPERATION, 2021-2031 ($MILLION)
    TABLE 107. REST OF ASIA-PACIFIC AIRSHIPS MARKET, BY ARCHITECTURE, 2021-2031 ($MILLION)
    TABLE 108. REST OF ASIA-PACIFIC AIRSHIPS MARKET, BY APPLICATION, 2021-2031 ($MILLION)
    TABLE 109. LAMEA AIRSHIPS MARKET, BY CLASS, 2021-2031 ($MILLION)
    TABLE 110. LAMEA AIRSHIPS MARKET, BY OPERATION, 2021-2031 ($MILLION)
    TABLE 111. LAMEA AIRSHIPS MARKET, BY ARCHITECTURE, 2021-2031 ($MILLION)
    TABLE 112. LAMEA AIRSHIPS MARKET, BY APPLICATION, 2021-2031 ($MILLION)
    TABLE 113. LAMEA AIRSHIPS MARKET, BY COUNTRY, 2021-2031 ($MILLION)
    TABLE 114. LATIN AMERICA AIRSHIPS MARKET, BY CLASS, 2021-2031 ($MILLION)
    TABLE 115. LATIN AMERICA AIRSHIPS MARKET, BY OPERATION, 2021-2031 ($MILLION)
    TABLE 116. LATIN AMERICA AIRSHIPS MARKET, BY ARCHITECTURE, 2021-2031 ($MILLION)
    TABLE 117. LATIN AMERICA AIRSHIPS MARKET, BY APPLICATION, 2021-2031 ($MILLION)
    TABLE 118. MIDDLE EAST AIRSHIPS MARKET, BY CLASS, 2021-2031 ($MILLION)
    TABLE 119. MIDDLE EAST AIRSHIPS MARKET, BY OPERATION, 2021-2031 ($MILLION)
    TABLE 120. MIDDLE EAST AIRSHIPS MARKET, BY ARCHITECTURE, 2021-2031 ($MILLION)
    TABLE 121. MIDDLE EAST AIRSHIPS MARKET, BY APPLICATION, 2021-2031 ($MILLION)
    TABLE 122. SOUTH AFRICA AIRSHIPS MARKET, BY CLASS, 2021-2031 ($MILLION)
    TABLE 123. SOUTH AFRICA AIRSHIPS MARKET, BY OPERATION, 2021-2031 ($MILLION)
    TABLE 124. SOUTH AFRICA AIRSHIPS MARKET, BY ARCHITECTURE, 2021-2031 ($MILLION)
    TABLE 125. SOUTH AFRICA AIRSHIPS MARKET, BY APPLICATION, 2021-2031 ($MILLION)
    TABLE 126.BOEING: COMPANY SNAPSHOT
    TABLE 127.BOEING: OPERATING SEGMENTS
    TABLE 128.BOEING: PRODUCT PORTFOLIO
    TABLE 129.BOEING: NET SALES,
    TABLE 130.BOEING: KEY STRATERGIES
    TABLE 131.LOCKHEED MARTIN CORPORATION: COMPANY SNAPSHOT
    TABLE 132.LOCKHEED MARTIN CORPORATION: OPERATING SEGMENTS
    TABLE 133.LOCKHEED MARTIN CORPORATION: PRODUCT PORTFOLIO
    TABLE 134.LOCKHEED MARTIN CORPORATION: NET SALES,
    TABLE 135.LOCKHEED MARTIN CORPORATION: KEY STRATERGIES
    TABLE 136.AIRBORNE: COMPANY SNAPSHOT
    TABLE 137.AIRBORNE: OPERATING SEGMENTS
    TABLE 138.AIRBORNE: PRODUCT PORTFOLIO
    TABLE 139.AIRBORNE: NET SALES,
    TABLE 140.AIRBORNE: KEY STRATERGIES
    TABLE 141.ZEPPELIN LUFTSCHIFFTECHNIK GMBH: COMPANY SNAPSHOT
    TABLE 142.ZEPPELIN LUFTSCHIFFTECHNIK GMBH: OPERATING SEGMENTS
    TABLE 143.ZEPPELIN LUFTSCHIFFTECHNIK GMBH: PRODUCT PORTFOLIO
    TABLE 144.ZEPPELIN LUFTSCHIFFTECHNIK GMBH: NET SALES,
    TABLE 145.ZEPPELIN LUFTSCHIFFTECHNIK GMBH: KEY STRATERGIES
    TABLE 146.HYBRID AIR VEHICLES: COMPANY SNAPSHOT
    TABLE 147.HYBRID AIR VEHICLES: OPERATING SEGMENTS
    TABLE 148.HYBRID AIR VEHICLES: PRODUCT PORTFOLIO
    TABLE 149.HYBRID AIR VEHICLES: NET SALES,
    TABLE 150.HYBRID AIR VEHICLES: KEY STRATERGIES
    TABLE 151.LINDSTRAND TECHNOLOGIES LIMITED: COMPANY SNAPSHOT
    TABLE 152.LINDSTRAND TECHNOLOGIES LIMITED: OPERATING SEGMENTS
    TABLE 153.LINDSTRAND TECHNOLOGIES LIMITED: PRODUCT PORTFOLIO
    TABLE 154.LINDSTRAND TECHNOLOGIES LIMITED: NET SALES,
    TABLE 155.LINDSTRAND TECHNOLOGIES LIMITED: KEY STRATERGIES
    TABLE 156.VANTAGE AIRSHIP: COMPANY SNAPSHOT
    TABLE 157.VANTAGE AIRSHIP: OPERATING SEGMENTS
    TABLE 158.VANTAGE AIRSHIP: PRODUCT PORTFOLIO
    TABLE 159.VANTAGE AIRSHIP: NET SALES,
    TABLE 160.VANTAGE AIRSHIP: KEY STRATERGIES
    TABLE 161.SKYSHIP SERVICES, INC.: COMPANY SNAPSHOT
    TABLE 162.SKYSHIP SERVICES, INC.: OPERATING SEGMENTS
    TABLE 163.SKYSHIP SERVICES, INC.: PRODUCT PORTFOLIO
    TABLE 164.SKYSHIP SERVICES, INC.: NET SALES,
    TABLE 165.SKYSHIP SERVICES, INC.: KEY STRATERGIES
    TABLE 166.ROSAERO SYSTEMS: COMPANY SNAPSHOT
    TABLE 167.ROSAERO SYSTEMS: OPERATING SEGMENTS
    TABLE 168.ROSAERO SYSTEMS: PRODUCT PORTFOLIO
    TABLE 169.ROSAERO SYSTEMS: NET SALES,
    TABLE 170.ROSAERO SYSTEMS: KEY STRATERGIES
    TABLE 171.GEFA-FLUG: COMPANY SNAPSHOT
    TABLE 172.GEFA-FLUG: OPERATING SEGMENTS
    TABLE 173.GEFA-FLUG: PRODUCT PORTFOLIO
    TABLE 174.GEFA-FLUG: NET SALES,
    TABLE 175.GEFA-FLUG: KEY STRATERGIES
    TABLE 176.SCEYE INC.: COMPANY SNAPSHOT
    TABLE 177.SCEYE INC.: OPERATING SEGMENTS
    TABLE 178.SCEYE INC.: PRODUCT PORTFOLIO
    TABLE 179.SCEYE INC.: NET SALES,
    TABLE 180.SCEYE INC.: KEY STRATERGIES
    TABLE 181.WDL LUFTSCHIFFGESELLSCHAFT MBH: COMPANY SNAPSHOT
    TABLE 182.WDL LUFTSCHIFFGESELLSCHAFT MBH: OPERATING SEGMENTS
    TABLE 183.WDL LUFTSCHIFFGESELLSCHAFT MBH: PRODUCT PORTFOLIO
    TABLE 184.WDL LUFTSCHIFFGESELLSCHAFT MBH: NET SALES,
    TABLE 185.WDL LUFTSCHIFFGESELLSCHAFT MBH: KEY STRATERGIES
    TABLE 186.AEROS: COMPANY SNAPSHOT
    TABLE 187.AEROS: OPERATING SEGMENTS
    TABLE 188.AEROS: PRODUCT PORTFOLIO
    TABLE 189.AEROS: NET SALES,
    TABLE 190.AEROS: KEY STRATERGIES
    TABLE 191.CARGOLIFTER: COMPANY SNAPSHOT
    TABLE 192.CARGOLIFTER: OPERATING SEGMENTS
    TABLE 193.CARGOLIFTER: PRODUCT PORTFOLIO
    TABLE 194.CARGOLIFTER: NET SALES,
    TABLE 195.CARGOLIFTER: KEY STRATERGIES
    TABLE 196.VARIALIFT: COMPANY SNAPSHOT
    TABLE 197.VARIALIFT: OPERATING SEGMENTS
    TABLE 198.VARIALIFT: PRODUCT PORTFOLIO
    TABLE 199.VARIALIFT: NET SALES,
    TABLE 200.VARIALIFT: KEY STRATERGIES
  • LIST OF FIGURES

  • FIGURE 1.AIRSHIPS MARKET SEGMENTATION
    FIGURE 2.AIRSHIPS MARKET,2021-2031
    FIGURE 3.AIRSHIPS MARKET,2021-2031
    FIGURE 4. TOP INVESTMENT POCKETS, BY REGION
    FIGURE 5.PORTER FIVE-1
    FIGURE 6.PORTER FIVE-2
    FIGURE 7.PORTER FIVE-3
    FIGURE 8.PORTER FIVE-4
    FIGURE 9.PORTER FIVE-5
    FIGURE 10.TOP PLAYER POSITIONING
    FIGURE 11.AIRSHIPS MARKET:DRIVERS, RESTRAINTS AND OPPORTUNITIES
    FIGURE 12.AIRSHIPS MARKET,BY CLASS,2021(%)
    FIGURE 13.COMPARATIVE SHARE ANALYSIS OF SMALL AIRSHIPS MARKET,2021-2031(%)
    FIGURE 14.COMPARATIVE SHARE ANALYSIS OF MEDIUM AIRSHIPS MARKET,2021-2031(%)
    FIGURE 15.COMPARATIVE SHARE ANALYSIS OF LARGE AIRSHIPS MARKET,2021-2031(%)
    FIGURE 16.AIRSHIPS MARKET,BY OPERATION,2021(%)
    FIGURE 17.COMPARATIVE SHARE ANALYSIS OF MANNED AIRSHIPS MARKET,2021-2031(%)
    FIGURE 18.COMPARATIVE SHARE ANALYSIS OF UNMANNED AIRSHIPS MARKET,2021-2031(%)
    FIGURE 19.AIRSHIPS MARKET,BY ARCHITECTURE,2021(%)
    FIGURE 20.COMPARATIVE SHARE ANALYSIS OF NON RIGID AIRSHIPS MARKET,2021-2031(%)
    FIGURE 21.COMPARATIVE SHARE ANALYSIS OF RIGID AIRSHIPS MARKET,2021-2031(%)
    FIGURE 22.COMPARATIVE SHARE ANALYSIS OF SEMI RIGID AIRSHIPS MARKET,2021-2031(%)
    FIGURE 23.AIRSHIPS MARKET,BY APPLICATION,2021(%)
    FIGURE 24.COMPARATIVE SHARE ANALYSIS OF TOURISM AND RECREATIONAL AIRSHIPS MARKET,2021-2031(%)
    FIGURE 25.COMPARATIVE SHARE ANALYSIS OF RESEARCH AND SURVEILLANCE AIRSHIPS MARKET,2021-2031(%)
    FIGURE 26.COMPARATIVE SHARE ANALYSIS OF ADVERTISEMENT AND CARGO AIRSHIPS MARKET,2021-2031(%)
    FIGURE 27.COMPARATIVE SHARE ANALYSIS OF MILITARY AND COMMUNICATION AIRSHIPS MARKET,2021-2031(%)
    FIGURE 28.AIRSHIPS MARKET BY REGION,2021
    FIGURE 29.U.S. AIRSHIPS MARKET,2021-2031($MILLION)
    FIGURE 30.CANADA AIRSHIPS MARKET,2021-2031($MILLION)
    FIGURE 31.MEXICO AIRSHIPS MARKET,2021-2031($MILLION)
    FIGURE 32.UK AIRSHIPS MARKET,2021-2031($MILLION)
    FIGURE 33.GERMANY AIRSHIPS MARKET,2021-2031($MILLION)
    FIGURE 34.FRANCE AIRSHIPS MARKET,2021-2031($MILLION)
    FIGURE 35.RUSSIA AIRSHIPS MARKET,2021-2031($MILLION)
    FIGURE 36.ITALY AIRSHIPS MARKET,2021-2031($MILLION)
    FIGURE 37.SPAIN AIRSHIPS MARKET,2021-2031($MILLION)
    FIGURE 38.REST OF EUROPE AIRSHIPS MARKET,2021-2031($MILLION)
    FIGURE 39.CHINA AIRSHIPS MARKET,2021-2031($MILLION)
    FIGURE 40.INDIA AIRSHIPS MARKET,2021-2031($MILLION)
    FIGURE 41.JAPAN AIRSHIPS MARKET,2021-2031($MILLION)
    FIGURE 42.AUSTRALIA AIRSHIPS MARKET,2021-2031($MILLION)
    FIGURE 43.SOUTH KOREA AIRSHIPS MARKET,2021-2031($MILLION)
    FIGURE 44.REST OF ASIA-PACIFIC AIRSHIPS MARKET,2021-2031($MILLION)
    FIGURE 45.LATIN AMERICA AIRSHIPS MARKET,2021-2031($MILLION)
    FIGURE 46.MIDDLE EAST AIRSHIPS MARKET,2021-2031($MILLION)
    FIGURE 47.SOUTH AFRICA AIRSHIPS MARKET,2021-2031($MILLION)
    FIGURE 48. TOP WINNING STRATEGIES, BY YEAR
    FIGURE 49. TOP WINNING STRATEGIES, BY DEVELOPMENT
    FIGURE 50. TOP WINNING STRATEGIES, BY COMPANY
    FIGURE 51.PRODUCT MAPPING OF TOP 10 PLAYERS
    FIGURE 52.COMPETITIVE DASHBOARD
    FIGURE 53.COMPETITIVE HEATMAP OF TOP 10 KEY PLAYERS
    FIGURE 54.BOEING.: NET SALES ,($MILLION)
    FIGURE 55.LOCKHEED MARTIN CORPORATION.: NET SALES ,($MILLION)
    FIGURE 56.AIRBORNE.: NET SALES ,($MILLION)
    FIGURE 57.ZEPPELIN LUFTSCHIFFTECHNIK GMBH.: NET SALES ,($MILLION)
    FIGURE 58.HYBRID AIR VEHICLES.: NET SALES ,($MILLION)
    FIGURE 59.LINDSTRAND TECHNOLOGIES LIMITED.: NET SALES ,($MILLION)
    FIGURE 60.VANTAGE AIRSHIP.: NET SALES ,($MILLION)
    FIGURE 61.SKYSHIP SERVICES, INC..: NET SALES ,($MILLION)
    FIGURE 62.ROSAERO SYSTEMS.: NET SALES ,($MILLION)
    FIGURE 63.GEFA-FLUG.: NET SALES ,($MILLION)
    FIGURE 64.SCEYE INC..: NET SALES ,($MILLION)
    FIGURE 65.WDL LUFTSCHIFFGESELLSCHAFT MBH.: NET SALES ,($MILLION)
    FIGURE 66.AEROS.: NET SALES ,($MILLION)
    FIGURE 67.CARGOLIFTER.: NET SALES ,($MILLION)
    FIGURE 68.VARIALIFT.: NET SALES ,($MILLION)


The airship market is expected to witness a significant growth rate attributed to the integration of new technologies within Airship. Integration of advanced optronics, followed by infrared and thermal cameras has allowed airship to be used in security and surveillance segment. Advancement in peripheral technologies such as semi-conductors and communication has allowed Airships to increase market penetration within the military and communication sector. Low acquisition cost and ease of operation is one of the primary factors supporting the growth of the airships market. The growing trend of advertisement and marketing, coupled with low acquisition and operational cost is playing a key role in boosting the demand for airships across the globe

To fulfill the changing demand scenarios, market participants are concentrating on product launches to offer a diverse range of products and meet new business opportunities. In addition, market participants are continuously focusing on contracts, business expansion and partnership efforts to match changing end-user requirements and improve the growth of the airship market. For instance, in June 2022, Air Nostrum, Spanish based company, signed an aircraft reservation agreement with UK Hybrid Air Vehicles for ten of the former Airlander 10 hybrid airship.

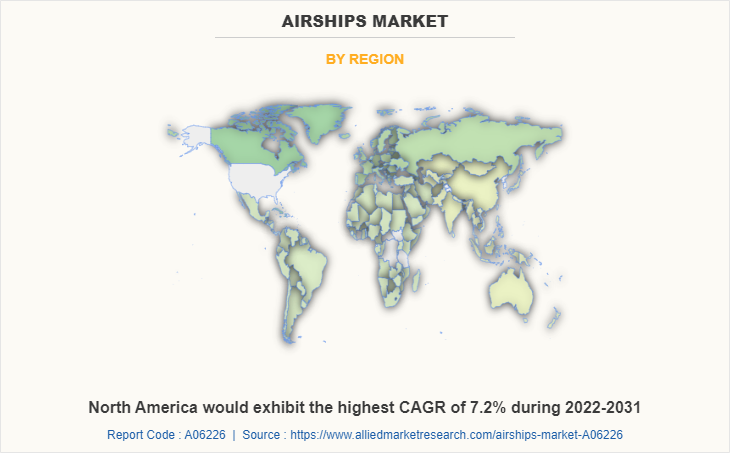
Among the analyzed regions, North America is the highest revenue contributor, followed by Europe, Asia-Pacific, and LAMEA. North America is expected to witness highest growth rate during the forecast period.

PURCHASE OPTIONS

Call or Email us

U.S.-Canada Toll-free: +1-800-792-5285
Int'l : +1-503-894-6022
Europe : +44-845-528-1300
Email : help@alliedmarketresearch.com
 
FREQUENTLY ASKED QUESTIONS?

A. Factors such as increased demand of surveillance in confined areas, trend of mega advertisement, live streaming of events and bolstering aerial recreational and sightseeing activities to support the demand of airship within the forecast period.

A. The leading applications of airship market include tourism and recreational, research and surveillance, advertisement and cargo, military and communication.

A. North America is the largest regional market for airships.

A. The global airship market was valued at $349.2million in 2021, and is projected to reach $608.1 million by 2031, registering a CAGR of 6.0% from 2022 to 2031.

A. The key players operating in the market are Lockheed Martin Corporation, Airborne Industries Inc., Zeppelin Luftschifftechnik GmbH, Hybrid Air Vehicles Ltd., Lindstrand Technologies Ltd., Shanghai Vantage Airship Manufacture Co. Ltd, Information Systems Laboratories Inc., Skyship Services Inc., RosAeroSystems s.r.a., GEFA-FLUG, Sceye Inc., Vantage Airship, West Deutsche Luftwerbung GmbH, Worldwide Aeros, CargoLifter AG, Boeing and Varialift Airships.

Looking for Customization?

 Customization Request

Have a Question?

 Speak with Analyst

Any Confusion?

 Inquire Before Buying

Have a glance of the Report

  Request Sample
RELATED TAGS

Purchase Full Report of
Airships Market

Start reading instantly.
This Report and over 67,404+ more Reports, Available with Avenue Library. T&C*.

  • Online Only
  • $3,570
  • Online cloud access only
  • Restricted print, copy, paste & download
  • Read only
  • Free industry update
    (Within 180 days)
  • Free report update in next update cycle
    (Oct 2023 - Oct 2024)
  • Data Pack
  • $3,840
  • Restricted to one authorized user
  • One print only
  • Available in
    Excel
  • Free industry update
    (Within 180 days)
  •   Free report update in next update cycle
    (Oct 2023 - Oct 2024)
  • Single User
  • $5,730
  • Restricted to one authorized user
  • One print only
  • Available in
    PDF
  • Free industry update
    (Within 180 days)
  •   Free report update in next update cycle
    (Oct 2023 - Oct 2024)
  • Five Users
  • $6,450
  • Limited to five authorized users
  • Print upto five copies
  • Available in
    PDF
  • Free industry update
    (Within 180 days)
  •   Free report update in next update cycle
    (Oct 2023 - Oct 2024)
  • Enterprise
    License/PDF

  • $9,600
  • Unlimited
    within
    company/enterprise
  • Available in Excel & PDF
  • Free industry update
    (Within 180 days)
  •   Free report update in next update cycle
    (Oct 2023 - Oct 2024)
  • Library
    Membership

  • $999 $ 1,175
    Per User/ Per month/ Billed annually
  • Published Content
    E-access
  • Company Profiles
    E-access
  • Newly Added Content Access
  • 10 PDF
    Downloads
  • 5 Excel Data
    Pack Downloads
  • 250 Company Profiles PDF Downloads
  • Buy Now

*Taxes/Fees, if applicable will be added during checkout. All prices in USD

RELATED REPORTS
 

Why Allied Market Research?


Infallible Methodology

To ensure high-level data integrity, accurate analysis, and impeccable forecasts

Analyst Support

For complete satisfaction

Customization

On-demand customization of scope of the report to exactly meet your needs

TARGETED MARKET VIEW

Targeted market view to provide pertinent information and save time of readers

Get fresh content delivered

Get insights on topics that are crucial for your business. Stay abreast of your interest areas.

Get Industry Data Alerts

Why Allied Market Research?

Infallible Methodology

To ensure high-level data integrity, accurate analysis, and impeccable forecasts

Analyst Support

For complete satisfaction

Customization

On-demand customization of scope of the report to exactly meet your needs

TARGETED MARKET VIEW

Targeted market view to provide pertinent information and save time of readers