
Alkyd Coatings Market Research, 2032
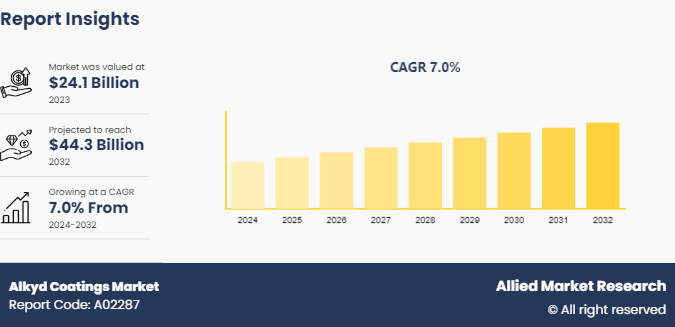
The global alkyd coatings market was valued at $24.1 billion in 2023, and is projected to reach $44.3 Billion by 2032, growing at a CAGR of 7% from 2024 to 2032.
Market Introduction and Definition
Alkyd coatings, also known as alkyd resins, are synthetic resins used in paints and coatings. They are produced by the polycondensation of polyols (typically glycerol or pentaerythritol) with dibasic acids (like phthalic anhydride) and fatty acids. This composition gives alkyd coatings a unique set of properties, making them highly versatile for various applications. Alkyd coatings are known for their excellent adhesion, durability, and gloss retention. They are typically used in decorative, industrial, and protective coatings due to their ability to form a hard, flexible film that can withstand a wide range of environmental conditions. The drying process of alkyd coatings involves oxidative cross-linking, which means they harden through a reaction with oxygen in the air, a process that is accelerated by the use of dryers or catalysts.
Alkyd coatings play a crucial role in industrial applications where protection against corrosion and environmental degradation is essential. They are often used on metal surfaces, including machinery, equipment, and structural steel. The excellent adhesion properties of alkyd coatings ensure that they form a strong bond with the substrate, providing long-term protection against rust and corrosion. Modified alkyds, such as silicone-alkyds and urethane-alkyds, offer enhanced performance characteristics, including improved weather resistance and chemical resistance, making them suitable for more demanding industrial environments.
In protective coatings, alkyd resins are valued for their ability to provide a tough, resilient barrier against harsh environmental conditions. They are used in marine coatings, where they protect ships and offshore structures from the corrosive effects of saltwater and marine organisms. Alkyd-based primers are commonly used in the automotive industry, providing a robust undercoat that improves the adhesion and durability of subsequent layers of paint. The versatility of alkyd resins allows them to be formulated for specific protective requirements, ensuring optimal performance in a wide range of applications.
Key Takeaways
The alkyd coatings market industry covers 20 countries. The research includes a segment analysis of each country in terms of value for the projected period.
The study integrated high-quality data, professional opinions and analysis, and critical independent perspectives. The research approach is intended to provide a balanced view of the global alkyd coatings market overview and to assist stakeholders in making educated decisions to achieve their growth objectives.
Over 3, 700 product literature, annual reports, industry statements, and other comparable materials from major industry participants were reviewed to gain a better understanding of the alkyd coatings market size.
The alkyd coatings market share is highly fragmented, with several players including Akzo Nobel N.V., PPG Industries, Inc., The Sherwin-Williams Company, BASF SE, Nippon Paint Holdings Co., Ltd., Axalta Coating Systems, LLC, Jotun, Kansai Paint Co., Ltd., Hempel (USA) , Inc., and Tikkurila. Also tracked key strategies such as acquisitions, product launches, mergers, and expansion of the players operating in the alkyd coatings market growth.
Segment Overview
The alkyd coatings market is segmented into technology, resin type, application, and region. On the basis of technology, the market is divided into solvent-borne alkyds, waterborne alkyds, high-solids alkyds, and others. On the basis of resin type, the market is classified into non-drying alkyd resins, drying alkyd resins, and semi-drying alkyd resins. By application, the market is categorized into decorative coatings, industrial coatings, automotive coatings, and others. Region-wise, it is analyzed across North America, Europe, Asia-Pacific, and LAMEA.
Key Market Dynamics
Surge in automotive refinish sector is expected to drive the growth of the alkyd coatings market during the forecast period. The automotive industry is one of the vital sectors propelling the demand for alkyd coatings, particularly in the area of automotive refinishing. This demand is significantly influenced by the global expansion of the automotive industry, especially in emerging economies, and the burgeoning need for aftermarket services. The global automotive industry has been experiencing robust growth over the past few decades. This growth is most pronounced in emerging economies such as China, India, Brazil, and Southeast Asian countries, where increasing urbanization and rising disposable incomes have led to a surge in vehicle ownership. As more individuals in these regions aspire to own personal vehicles, the demand for both new vehicles and the maintenance of existing ones has escalated. This expansion is not just limited to the sale of new vehicles but extends to the comprehensive ecosystem that supports vehicle longevity, including the automotive refinish sector.
In 2023, the China Association of Automobile Manufacturers (CAAM) reported that vehicle production in China reached 30.16 million units, marking an 11.6% increase compared to the previous year. This follows data from the International Organization of Motor Vehicle Manufacturers (OICA) , which noted that in 2022, vehicle production in China totaled 27.02 million units, reflecting a 3% growth over 2021. The increasing number of vehicles on the road inevitably boosts the demand for maintenance and repair services. Alkyd coatings have become essential in the automotive refinish industry due to their optimal balance of performance and affordability. It is widely used for repairing and refinishing vehicle exteriors, alkyd coatings offer a durable and attractive finish. Their excellent adhesion to various substrates, combined with flexibility and resistance to chipping and cracking, makes them particularly well-suited for automotive applications. This is especially important in a market where the visual appeal and structural integrity of a vehicle's exterior are key considerations for both owners and potential buyers.

However, environmental concerns of releasing volatile organic compounds (VOCs) are expected to hamper the growth of the market. Meeting low-VOC requirements poses technical challenges for formulators of alkyd coatings. Traditional alkyd resins rely on volatile solvents to achieve desirable application properties and film formation characteristics. Reformulating these coatings to minimize VOC content while maintaining performance standards requires innovation in resin chemistry and formulation techniques. However, achieving the desired balance between low VOC emissions and performance characteristics such as adhesion, durability, and drying times is complex and may necessitate trade-offs that compromise product quality or increase production costs. The proliferation of low-VOC coatings in response to environmental regulations has intensified market fragmentation and competition within the coatings industry. Manufacturers offering alternative coating technologies such as waterborne, powder, and UV-curable coatings vie for market share with low-VOC alkyd coatings. This increased competition puts pressure on alkyd coating producers to differentiate their products based on performance, cost, and sustainability.
Furthermore, integration with smart coating technologies is expected to provide lucrative opportunities in the alkyd coatings market. One significant application of this integration is in healthcare facilities, where maintaining high levels of hygiene and cleanliness is critical. Alkyd coatings infused with self-cleaning technology can repel dirt, dust, and other contaminants, reducing the need for frequent cleaning and disinfection. Additionally, antimicrobial additives can be incorporated into the coatings to inhibit the growth of bacteria and other harmful microorganisms, helping to prevent the spread of infections and diseases within healthcare industries. Alkyd coatings have applications in public spaces such as schools, airports, and transportation hubs, where large numbers of people congregate regularly.
In April 2022, The Sherwin-Williams Company made a strategic move by acquiring the European industrial coatings division of Sika AG, a renowned manufacturer specializing in corrosion-resistant coating systems. These coatings, integral to Sika AG's Performance Coatings segment, find extensive application across various sectors. From safeguarding interior and exterior steel infrastructure to fortifying bridges, airports, and railways, they play a crucial role in enhancing durability and longevity. By incorporating self-cleaning and antimicrobial features, these coatings can help maintain clean and hygienic environments, reducing the risk of cross-contamination and the spread of infectious diseases. Additionally, the durability and weather resistance of alkyd coatings make them well-suited for outdoor applications, where they can provide long-lasting protection against environmental factors such as UV radiation, moisture, and pollutants.
Regional Market Outlook
Region-wise, the alkyd coatings market is analyzed across North America, Europe, Asia-Pacific, and LAMEA. In North America, alkyd coatings are widely utilized in architectural applications, particularly in residential and commercial construction. These coatings offer exceptional protection against harsh weather conditions, UV radiation, and corrosion, making them ideal for exterior surfaces such as doors, windows, fences, and trim.
In the Asia-Pacific region, alkyd coatings play a vital role in various industries, including construction, automotive, and electronics. The burgeoning construction sector in countries like China, India, and Southeast Asian nations has propelled the demand for architectural coatings, where alkyd-based paints are widely used for their durability and weather resistance. Additionally, the automotive industry in Asia-Pacific, particularly in countries like Japan and South Korea, relies on alkyd coatings for vehicle refinishing and OEM applications, driven by the increasing production and sales of automobiles in the region.
China has a significant demand for alkyd coatings in various industries. In the construction sector, alkyd-based paints are commonly used for architectural applications, such as painting exterior surfaces of buildings, bridges, and infrastructure projects. India's diverse economy and expanding infrastructure drive the demand for alkyd coatings across multiple sectors. In the construction industry, alkyd paints are widely used for both residential and commercial projects, offering protection against harsh weather conditions and enhancing the aesthetic appeal of structures. In December 2022, Advanced Polymer Coatings Inc., a leading manufacturer of protective coatings, experienced growth in its business operations in China. The company secured a significant contract to provide protective coatings for two newly constructed ships belonging to the joint venture Proman Stena Bulk. Thus, growing popularity protective coatings of gaining popularity in protective coating is expected to boost the alkyd coatings demand.

Competitive Analysis
Key market players in the alkyd coatings market include Akzo Nobel N.V., PPG Industries, Inc., The Sherwin-Williams Company, BASF SE, Nippon Paint Holdings Co., Ltd., Axalta Coating Systems, LLC, Jotun, Kansai Paint Co., Ltd, Hempel (USA) , Inc., and Tikkurila.
Industry Trends
In May 2024, PPG invested $225 million to construct a new 250, 000-square-foot paints and coatings manufacturing facility in Loudon, Tennessee, marking its first new U.S. plant in 15 years. This facility is expected to create 129 jobs and produce 11 million gallons of paint and coatings annually. The Loudon facility is a key component of PPG’s $300 million initiative to enhance its paint and coatings manufacturing capabilities in North America, driven by increasing demand in the automotive sector. Consequently, the growing popularity of paints and coatings is anticipated to elevate the demand for PPG's alkyd coatings during the upcoming forecast period.
In April 2024, ASK Chemicals, a global leader in high-performance phenolic resins and foundry chemicals, introduced necowel alkyd resin emulsions at the American Coatings Show. These new emulsions are VOC-free, emphasizing enhanced environmental protection and sustainability.
In March 2024, AkzoNobel is investing $30 million to modernize equipment and boost manufacturing capabilities at four North American powder coating sites.
In May 2023, PPG revealed a $44 million investment aimed at enhancing five of its powder coating manufacturing facilities across the U.S. and Latin America. These initiatives are part of PPG's strategic plan to broaden its powder coatings portfolio and boost global production to cater to the rising customer demand for more sustainable products.
In February 2024, BASF Coatings entered into a strategic partnership with INEOS Automotive for their Global Body and Paint Program. This collaboration aims to distinguish itself within the industry by exceeding the standard practices in vehicle body repairs and paint refinishing. The partnership will focus on offering sustainable refinish services, providing expertise, and implementing advanced digital color-matching solutions and training.
Key Regulation Analysis
The ISO 12944 standard provides guidelines for corrosion protection and recommends solvent-based alkyd coatings for certain applications, such as metal coatings.
Some solvents, like para-chlorobenzotrifluoride (Oxsol 100) , acetone, t-butyl acetate, VMS fluids, methyl acetate, and di-methyl carbonate, are exempt from VOC calculations in many areas. However, these solvents have their own limitations and challenges.
Society for Protective Coatings (SSPC) defines environmental zones for alkyd coatings, which categorize exposure conditions based on factors like humidity and saltwater exposure. This helps in selecting the appropriate coating for specific applications
Key Sources Referred
AMERICAN COATINGS ASSOCIATION
The International Trade Administration
U.S. Department of Commerce
Association for Materials Protection and Performance
United State Environmental Protection Agency
Key Benefits For Stakeholders
This report provides a quantitative analysis of the market segments, current trends, estimations, and dynamics of the alkyd coatings market analysis from 2024 to 2032 to identify the prevailing alkyd coatings market opportunities.
The market research is offered along with information related to key drivers, restraints, and opportunities.
Porter's five forces analysis highlights the potency of buyers and suppliers to enable stakeholders make profit-oriented business decisions and strengthen their supplier-buyer network.
In-depth analysis of the alkyd coatings market segmentation assists to determine the prevailing market opportunities.
Major countries in each region are mapped according to their revenue contribution to the global market.
Market player positioning facilitates benchmarking and provides a clear understanding of the present position of the market players.
The report includes the analysis of the regional as well as global alkyd coatings market trends, key players, market segments, application areas, and market growth strategies.
Alkyd Coatings Market Report Highlights
| Aspects | Details |
| Market Size By 2032 | USD 44.3 Billion |
| Growth Rate | CAGR of 7% |
| Forecast period | 2024 - 2032 |
| Report Pages | 300 |
| By Technology |
|
| By Resin Type |
|
| By Application |
|
| By Region |
|
| Key Market Players | Kansai Paint Co.,Ltd, Nippon Paint Holdings Co., Ltd., Hempel (USA), Inc., Akzo Nobel N.V., PPG Industries, Inc., Axalta Coating Systems, LLC, BASF SE, Jotun, Tikkurila, The Sherwin-Williams Company |
Loading Table Of Content...

