0
2022
All-terrain Vehicle Market

All-terrain Vehicle Market

by Type (Utility all-terrain vehicle, Sport all-terrain vehicle, Others), by Fuel Type (Gasoline powered, Diesel powered, Electric powered, Solar powered), by Displacement (Less than 400 CC, Between 400 CC and 800 CC, Greater than 800 CC), by End-use (Agriculture, Military, Mountaineering, Others): Global Opportunity Analysis and Industry Forecast, 2021-2031

Report Code: A02095
Sep 2022 | Pages: 311
Tables: 178
Charts: 64
  • Formats*:

  • pdf

    Single User License, Five User
    License & Enterprise User License

  • xls

    Data Pack Excel License

  • ppt

    It comes with the additional cost
    of $2500.00 contact sales.


ATV Market 2022-2031:

The global all-terrain vehicle market was valued at $3.2 billion in 2021, and is projected to reach $5 billion by 2031, growing at a CAGR of 4.8% from 2022 to 2031.

An all-terrain vehicle (ATV) is a vehicle fitted with at least three low-pressure tires and handle bars. An all-terrain vehicle could have three, four or even six wheels. In addition, ATVs are of two types such as Type I ATVs and Type II ATVs. Type I ATVs are intended to be utilized by a single operator and no passenger. Type II ATVs are intended to be utilized by an operator and a passenger. ATVs are known for their manoeuvrability & off-road capabilities and are applicable in military, survey, forestry, agriculture, sports, and others. These are handled quite differently and require training. These are usually used in off-road environments, but few regions permit the use of these vehicles on public roads as well. These have gained popularity over the past few years as they allow access to remote areas and provide a convenient way to carry supplies and equipment.

The rapid spread of COVID-19 had a significant impact on the global automotive industry, which, in turns, affects the ATV industry, with a decline in the demand for vehicles. Several automobile and ATV manufacturers faced shortage of components such as semiconductor chips, and others, which further resulted in delay in production of automobiles and ATVs. In addition, COVID-19 also impacted the production of ATV vehicles across the globe. It forced ATV manufacturers in North America to temporarily shut down their production plants, in response to the coronavirus outbreak. For instance, in 2020, Yamaha Motor Corporation temporarily shut down its assembly plant in Newnan, U.S. The Newnan plant assembles most of the company’s ATV, WaveRunner, Side-by-Side vehicles and Golf cars intended for the U.S. markets. Perhaps the most immediate challenge for businesses in this sector during 2022 will involve evaluating the extent of the impact of the recent pandemic. Some manufacturers experienced short-term shutdowns during 2020 due to health-related emergencies. At the same time, the demand for these recreational products soared, creating sporadic inventory shortages.

All-terrain Vehicle Market, All-terrain Vehicle Industry

The global all-terrain vehicle market is witnessing growth, due to increase in trend of adventure sports and recreational activities, rise in demand for ATV in military activities, and government rules to support driving ATVs on road. However, ban on ATV driving in wildlife area due to terrain damage, and high maintenance cost of ATVs are the factors hampering the growth of the market. Furthermore, production of safer ATVs is the factor expected to offer growth opportunities during the forecast period.

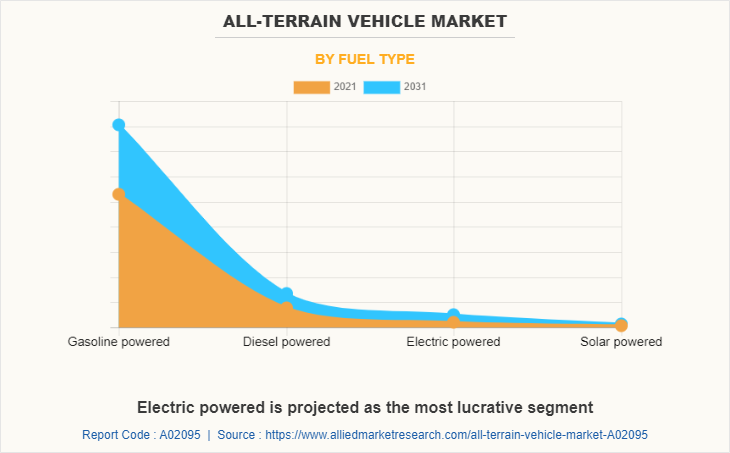
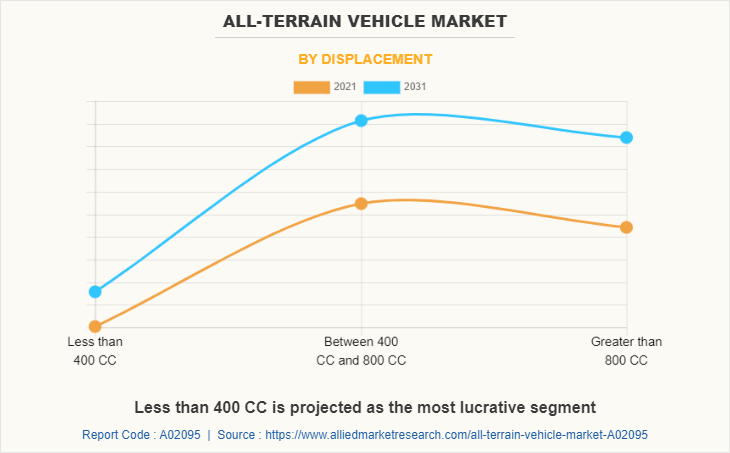
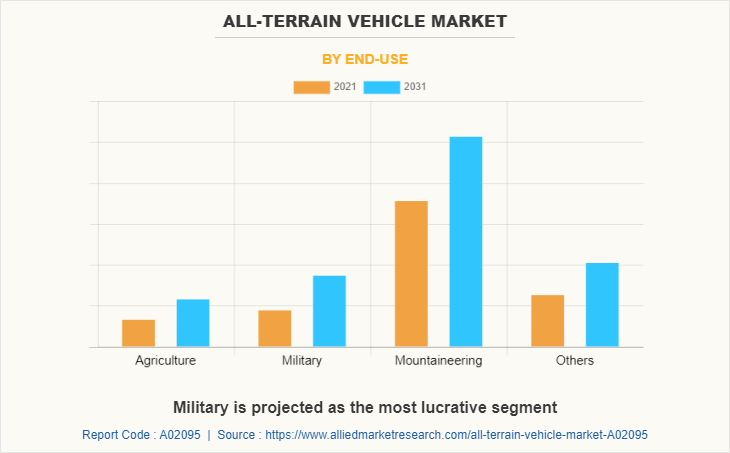
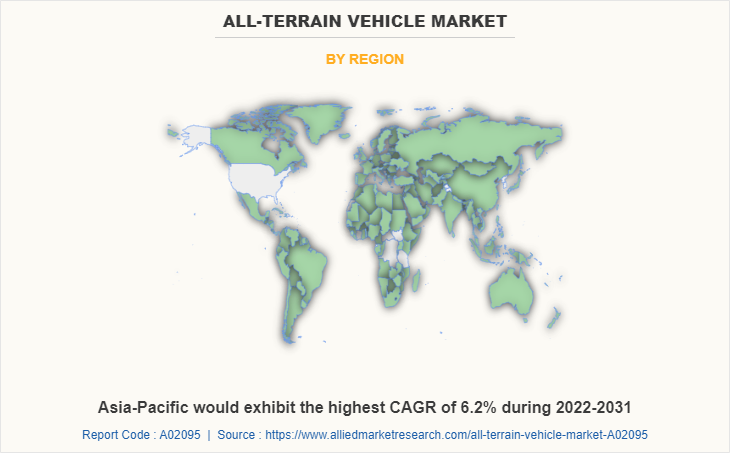
The all-terrain vehicle market is segmented on the basis of type, fuel type, displacement, end-use, and region. By type, it is segmented into utility all-terrain vehicle, sport all-terrain vehicle, and others. By fuel type, it is classified into gasoline powered, diesel powered, electric powered, and solar powered. By displacement, it is fragmented into less than 400 cc, 400 - 800 cc, and more than 800 cc. By end-use, it is categorized into agriculture, military, mountaineering, and others. By region, the report is analyzed across North America, Europe, Asia-Pacific, and LAMEA. 

Some leading companies profiled in the ATV market report comprises BRP Inc., CFMoto, Deere & Company, Hisun, Honda Motor Co., Ltd., Kawasaki Heavy Industries Ltd., Kubota Corporation, Kwang Yang Motor Co., Ltd., Polaris Industries Inc., Suzuki Motor Corporation, Textron Inc., and Yamaha Motor Co., Ltd.

Increase in trend of adventure sports and recreational activities

In recent days, tourists are highly attracted to the trails of ATV along with related activities for recreational purposes. Many tourism councils are introducing ATV related activities by building tracks for these vehicles to attract and retain visitors. In addition, increase in the expenditure on off-trailing activities and outdoor sports activities has been observed, which is contributing in the growth of the market. For instance, in 2020, as per the Bureau of Economic Analysis (BEA), the outdoor recreation economy accounted for 1.8% of GDP, which is $374.3 billion of current-dollar gross domestic product (GDP) of the U.S. At the state level, outdoor recreation value-added as a share of state GDP ranged from 4.3% in Montana to 1.2% in New York. Moreover, several countries are organizing yearly championships, which are gaining popularity at a remarkable rate as anyone capable of driving ATV can participate in the race. Therefore, increase in trend of such adventure sports attracts the tourists and propels the growth of the all-terrain vehicle market.
All-terrain Vehicle Market

Rise in demand for ATV in military activities

There is an increase in demand for ATV for military activities such as transportation of troops, driving on difficult terrain, and others. In addition, ATVs are expected to witness substantial growth in the military segment, owing to superior mobility provided for tactical missions. Moreover, factors, such as high maneuverability, flexibility, and superior navigational aids to provide instant directions for vehicle operators, further foster the ATV market growth. For instance, in October 2020, Kia Motors Corporation, revealed its plan of developing a new generation military ATVs. The vehicle will be equipped with automatic transmission systems, satellite navigation, rear parking assistant, anti-spin regulator, and around view monitor.

In addition, in May 2020, the U.S. Special Operations Command (USSOCOM) awarded $109 million seven year contract to Polaris Government and Defense for the Polaris MRZR Alpha, a new Lightweight Tactical All-Terrain Vehicle (LTATV). Therefore, rise in demand for ATVs from military troop drives the growth of the all-terrain vehicle market.
All-terrain Vehicle Market

Government rules to support driving ATVs on road

Earlier, driving ATV on roadways was not allowed for safety purpose. However, in recent days, new bills and ordinance are being passed by government authorities to allow driving ATVs on road. For instance, in 2021, in U.S., Washington State Legislature passed two bills regarding ATV use on public roads. The first bill SHB 1322 modifies the reciprocity provision which enables a person who has properly registered an ATV in another state, to use the vehicle in Washington without first registering it in Washington. The second bill EHB 1251, amends RCW 46.09.455 and expands the locations where a person may potentially operate an ATV, as long as it is approved by the local entity. In addition, in October 2020, the Wisconsin Dells Common Council approved an ordinance opening all city streets to ATV access. Therefore, government support to allow ATV on roadways is anticipated to boost the growth of the all-terrain vehicle market.
All-terrain Vehicle Market

Ban on ATV driving in wildlife area due to terrain damage

Driving ATV in wildlife area has many negative effects on the terrain such as noise disturbance, damage to vegetation, increased runoff, soil erosion, and degradation of water quality. In several countries, driving ATV in wildlife areas is banned due to terrain damage to protect wildlife habitat and others. In addition, when ATVs leave trails, plants and young saplings are damaged, reducing coverage for the forest floor. As soil is eroded, roots are often exposed and damaged, thereby harming nearby trees. Some regulations are incorporated to support wildlife recovery management strategies and to control unmanaged ATV use in the area. Therefore, ATVs are banned in wildlife area as they affect the wildlife habitat and grassland health, which is anticipated to hamper the growth of the all-terrain vehicle market.

High maintenance cost of ATVs

ATVs are durable, but are prone to part breakage, part failure, overheating, and others. Both used and new vehicle show wear & tear over time, but aging ATVs have completely different maintenance needs than that of new vehicles. Maintenance of new vehicle for a year is covered under one year warranty by manufacturer, but replacement of broken part is not covered in this warranty. These vehicles are majorly used in uneven terrain, mountains, uphill, and others due to which parts of the vehicle are prone to damage. Regular maintenance of these vehicles for optimum performance is recommended due to the damage caused to ATVs by driving on rough terrain. However, this maintenance is very expensive. Therefore, high maintenance cost of ATVs is anticipated to hinder the growth of the all-terrain vehicle market.
All-terrain Vehicle Market

The all-terrain vehicle market is segmented into Type, Fuel Type, Displacement and End-use.

Key Benefits For Stakeholders

  • This report provides a quantitative analysis of the market segments, current trends, estimations, and dynamics of the all-terrain vehicle market analysis from 2021 to 2031 to identify the prevailing all-terrain vehicle market opportunities.
  • The market research is offered along with information related to key drivers, restraints, and opportunities.
  • Porter's five forces analysis highlights the potency of buyers and suppliers to enable stakeholders make profit-oriented business decisions and strengthen their supplier-buyer network.
  • In-depth analysis of the all-terrain vehicle market segmentation assists to determine the prevailing market opportunities.
  • Major countries in each region are mapped according to their revenue contribution to the global market.
  • Market player positioning facilitates benchmarking and provides a clear understanding of the present position of the market players.
  • The report includes the analysis of the regional as well as global all-terrain vehicle market trends, key players, market segments, application areas, and market growth strategies.

All-terrain Vehicle Market Report Highlights

Aspects Details
By Type
  • Utility all-terrain vehicle
  • Sport all-terrain vehicle
  • Others
By Fuel Type
  • Gasoline powered
  • Diesel powered
  • Electric powered
  • Solar powered
By Displacement
  • Less than 400 CC
  • Between 400 CC and 800 CC
  • Greater than 800 CC
By End-use
  • Agriculture
  • Military
  • Mountaineering
  • Others
By Region
  • North America  (U.S., Canada, Mexico)
  • Europe  (UK, Germany, France, Italy, Rest of Europe)
  • Asia-Pacific  (China, Japan, India, South Korea, Rest Of Asia Pacific)
  • LAMEA  (Latin America, Middle East, Africa)
Key Market Players Honda Motor Co., Ltd., Kwang Yang Motor Co., Ltd., Yamaha Motor Co., Ltd., Kawasaki Heavy Industries Ltd., Polaris Industries, Inc., CFMOTO, Textron Inc., KUBOTA Corporation, Suzuki Motor Corporation, BRP Inc., Deere & Company, Hisun Motors Corp.
 
  • CHAPTER 1:INTRODUCTION

    • 1.1.Report description

    • 1.2.Key market segments

    • 1.3.Key benefits to the stakeholders

    • 1.4.Research Methodology

      • 1.4.1.Secondary research

      • 1.4.2.Primary research

      • 1.4.3.Analyst tools and models

  • CHAPTER 2:EXECUTIVE SUMMARY

    • 2.1.Key findings of the study

    • 2.2.CXO Perspective

  • CHAPTER 3:MARKET OVERVIEW

    • 3.1.Market definition and scope

    • 3.2.Key findings

      • 3.2.1.Top investment pockets

    • 3.3.Porter’s five forces analysis

    • 3.4.Top player positioning

    • 3.5.Market dynamics

      • 3.5.1.Drivers

      • 3.5.2.Restraints

      • 3.5.3.Opportunities

    • 3.6.COVID-19 Impact Analysis on the market

  • CHAPTER 4: ALL-TERRAIN VEHICLE MARKET, BY TYPE

    • 4.1 Overview

      • 4.1.1 Market size and forecast

    • 4.2 Utility all-terrain vehicle

      • 4.2.1 Key market trends, growth factors and opportunities

      • 4.2.2 Market size and forecast, by region

      • 4.2.3 Market analysis by country

    • 4.3 Sport all-terrain vehicle

      • 4.3.1 Key market trends, growth factors and opportunities

      • 4.3.2 Market size and forecast, by region

      • 4.3.3 Market analysis by country

    • 4.4 Others

      • 4.4.1 Key market trends, growth factors and opportunities

      • 4.4.2 Market size and forecast, by region

      • 4.4.3 Market analysis by country

  • CHAPTER 5: ALL-TERRAIN VEHICLE MARKET, BY FUEL TYPE

    • 5.1 Overview

      • 5.1.1 Market size and forecast

    • 5.2 Gasoline powered

      • 5.2.1 Key market trends, growth factors and opportunities

      • 5.2.2 Market size and forecast, by region

      • 5.2.3 Market analysis by country

    • 5.3 Diesel powered

      • 5.3.1 Key market trends, growth factors and opportunities

      • 5.3.2 Market size and forecast, by region

      • 5.3.3 Market analysis by country

    • 5.4 Electric powered

      • 5.4.1 Key market trends, growth factors and opportunities

      • 5.4.2 Market size and forecast, by region

      • 5.4.3 Market analysis by country

    • 5.5 Solar powered

      • 5.5.1 Key market trends, growth factors and opportunities

      • 5.5.2 Market size and forecast, by region

      • 5.5.3 Market analysis by country

  • CHAPTER 6: ALL-TERRAIN VEHICLE MARKET, BY DISPLACEMENT

    • 6.1 Overview

      • 6.1.1 Market size and forecast

    • 6.2 Less than 400 CC

      • 6.2.1 Key market trends, growth factors and opportunities

      • 6.2.2 Market size and forecast, by region

      • 6.2.3 Market analysis by country

    • 6.3 Between 400 CC and 800 CC

      • 6.3.1 Key market trends, growth factors and opportunities

      • 6.3.2 Market size and forecast, by region

      • 6.3.3 Market analysis by country

    • 6.4 Greater than 800 CC

      • 6.4.1 Key market trends, growth factors and opportunities

      • 6.4.2 Market size and forecast, by region

      • 6.4.3 Market analysis by country

  • CHAPTER 7: ALL-TERRAIN VEHICLE MARKET, BY END-USE

    • 7.1 Overview

      • 7.1.1 Market size and forecast

    • 7.2 Agriculture

      • 7.2.1 Key market trends, growth factors and opportunities

      • 7.2.2 Market size and forecast, by region

      • 7.2.3 Market analysis by country

    • 7.3 Military

      • 7.3.1 Key market trends, growth factors and opportunities

      • 7.3.2 Market size and forecast, by region

      • 7.3.3 Market analysis by country

    • 7.4 Mountaineering

      • 7.4.1 Key market trends, growth factors and opportunities

      • 7.4.2 Market size and forecast, by region

      • 7.4.3 Market analysis by country

    • 7.5 Others

      • 7.5.1 Key market trends, growth factors and opportunities

      • 7.5.2 Market size and forecast, by region

      • 7.5.3 Market analysis by country

  • CHAPTER 8: ALL-TERRAIN VEHICLE MARKET, BY REGION

    • 8.1 Overview

      • 8.1.1 Market size and forecast

    • 8.2 North America

      • 8.2.1 Key trends and opportunities

      • 8.2.2 North America Market size and forecast, by Type

      • 8.2.3 North America Market size and forecast, by Fuel Type

      • 8.2.4 North America Market size and forecast, by Displacement

      • 8.2.5 North America Market size and forecast, by End-use

      • 8.2.6 North America Market size and forecast, by country

        • 8.2.6.1 U.S.
          • 8.2.6.1.1 Market size and forecast, by Type
          • 8.2.6.1.2 Market size and forecast, by Fuel Type
          • 8.2.6.1.3 Market size and forecast, by Displacement
          • 8.2.6.1.4 Market size and forecast, by End-use
        • 8.2.6.2 Canada
          • 8.2.6.2.1 Market size and forecast, by Type
          • 8.2.6.2.2 Market size and forecast, by Fuel Type
          • 8.2.6.2.3 Market size and forecast, by Displacement
          • 8.2.6.2.4 Market size and forecast, by End-use
        • 8.2.6.3 Mexico
          • 8.2.6.3.1 Market size and forecast, by Type
          • 8.2.6.3.2 Market size and forecast, by Fuel Type
          • 8.2.6.3.3 Market size and forecast, by Displacement
          • 8.2.6.3.4 Market size and forecast, by End-use
    • 8.3 Europe

      • 8.3.1 Key trends and opportunities

      • 8.3.2 Europe Market size and forecast, by Type

      • 8.3.3 Europe Market size and forecast, by Fuel Type

      • 8.3.4 Europe Market size and forecast, by Displacement

      • 8.3.5 Europe Market size and forecast, by End-use

      • 8.3.6 Europe Market size and forecast, by country

        • 8.3.6.1 UK
          • 8.3.6.1.1 Market size and forecast, by Type
          • 8.3.6.1.2 Market size and forecast, by Fuel Type
          • 8.3.6.1.3 Market size and forecast, by Displacement
          • 8.3.6.1.4 Market size and forecast, by End-use
        • 8.3.6.2 Germany
          • 8.3.6.2.1 Market size and forecast, by Type
          • 8.3.6.2.2 Market size and forecast, by Fuel Type
          • 8.3.6.2.3 Market size and forecast, by Displacement
          • 8.3.6.2.4 Market size and forecast, by End-use
        • 8.3.6.3 France
          • 8.3.6.3.1 Market size and forecast, by Type
          • 8.3.6.3.2 Market size and forecast, by Fuel Type
          • 8.3.6.3.3 Market size and forecast, by Displacement
          • 8.3.6.3.4 Market size and forecast, by End-use
        • 8.3.6.4 Italy
          • 8.3.6.4.1 Market size and forecast, by Type
          • 8.3.6.4.2 Market size and forecast, by Fuel Type
          • 8.3.6.4.3 Market size and forecast, by Displacement
          • 8.3.6.4.4 Market size and forecast, by End-use
        • 8.3.6.5 Rest of Europe
          • 8.3.6.5.1 Market size and forecast, by Type
          • 8.3.6.5.2 Market size and forecast, by Fuel Type
          • 8.3.6.5.3 Market size and forecast, by Displacement
          • 8.3.6.5.4 Market size and forecast, by End-use
    • 8.4 Asia-Pacific

      • 8.4.1 Key trends and opportunities

      • 8.4.2 Asia-Pacific Market size and forecast, by Type

      • 8.4.3 Asia-Pacific Market size and forecast, by Fuel Type

      • 8.4.4 Asia-Pacific Market size and forecast, by Displacement

      • 8.4.5 Asia-Pacific Market size and forecast, by End-use

      • 8.4.6 Asia-Pacific Market size and forecast, by country

        • 8.4.6.1 China
          • 8.4.6.1.1 Market size and forecast, by Type
          • 8.4.6.1.2 Market size and forecast, by Fuel Type
          • 8.4.6.1.3 Market size and forecast, by Displacement
          • 8.4.6.1.4 Market size and forecast, by End-use
        • 8.4.6.2 Japan
          • 8.4.6.2.1 Market size and forecast, by Type
          • 8.4.6.2.2 Market size and forecast, by Fuel Type
          • 8.4.6.2.3 Market size and forecast, by Displacement
          • 8.4.6.2.4 Market size and forecast, by End-use
        • 8.4.6.3 India
          • 8.4.6.3.1 Market size and forecast, by Type
          • 8.4.6.3.2 Market size and forecast, by Fuel Type
          • 8.4.6.3.3 Market size and forecast, by Displacement
          • 8.4.6.3.4 Market size and forecast, by End-use
        • 8.4.6.4 South Korea
          • 8.4.6.4.1 Market size and forecast, by Type
          • 8.4.6.4.2 Market size and forecast, by Fuel Type
          • 8.4.6.4.3 Market size and forecast, by Displacement
          • 8.4.6.4.4 Market size and forecast, by End-use
        • 8.4.6.5 Rest Of Asia Pacific
          • 8.4.6.5.1 Market size and forecast, by Type
          • 8.4.6.5.2 Market size and forecast, by Fuel Type
          • 8.4.6.5.3 Market size and forecast, by Displacement
          • 8.4.6.5.4 Market size and forecast, by End-use
    • 8.5 LAMEA

      • 8.5.1 Key trends and opportunities

      • 8.5.2 LAMEA Market size and forecast, by Type

      • 8.5.3 LAMEA Market size and forecast, by Fuel Type

      • 8.5.4 LAMEA Market size and forecast, by Displacement

      • 8.5.5 LAMEA Market size and forecast, by End-use

      • 8.5.6 LAMEA Market size and forecast, by country

        • 8.5.6.1 Latin America
          • 8.5.6.1.1 Market size and forecast, by Type
          • 8.5.6.1.2 Market size and forecast, by Fuel Type
          • 8.5.6.1.3 Market size and forecast, by Displacement
          • 8.5.6.1.4 Market size and forecast, by End-use
        • 8.5.6.2 Middle East
          • 8.5.6.2.1 Market size and forecast, by Type
          • 8.5.6.2.2 Market size and forecast, by Fuel Type
          • 8.5.6.2.3 Market size and forecast, by Displacement
          • 8.5.6.2.4 Market size and forecast, by End-use
        • 8.5.6.3 Africa
          • 8.5.6.3.1 Market size and forecast, by Type
          • 8.5.6.3.2 Market size and forecast, by Fuel Type
          • 8.5.6.3.3 Market size and forecast, by Displacement
          • 8.5.6.3.4 Market size and forecast, by End-use
  • CHAPTER 9: COMPANY LANDSCAPE

    • 9.1. Introduction

    • 9.2. Top winning strategies

    • 9.3. Product Mapping of Top 10 Player

    • 9.4. Competitive Dashboard

    • 9.5. Competitive Heatmap

    • 9.6. Key developments

  • CHAPTER 10: COMPANY PROFILES

    • 10.1 BRP Inc.

      • 10.1.1 Company overview

      • 10.1.2 Company snapshot

      • 10.1.3 Operating business segments

      • 10.1.4 Product portfolio

      • 10.1.5 Business performance

      • 10.1.6 Key strategic moves and developments

    • 10.2 CFMOTO

      • 10.2.1 Company overview

      • 10.2.2 Company snapshot

      • 10.2.3 Operating business segments

      • 10.2.4 Product portfolio

      • 10.2.5 Business performance

      • 10.2.6 Key strategic moves and developments

    • 10.3 Deere & Company

      • 10.3.1 Company overview

      • 10.3.2 Company snapshot

      • 10.3.3 Operating business segments

      • 10.3.4 Product portfolio

      • 10.3.5 Business performance

      • 10.3.6 Key strategic moves and developments

    • 10.4 Hisun Motors Corp.

      • 10.4.1 Company overview

      • 10.4.2 Company snapshot

      • 10.4.3 Operating business segments

      • 10.4.4 Product portfolio

      • 10.4.5 Business performance

      • 10.4.6 Key strategic moves and developments

    • 10.5 Honda Motor Co., Ltd.

      • 10.5.1 Company overview

      • 10.5.2 Company snapshot

      • 10.5.3 Operating business segments

      • 10.5.4 Product portfolio

      • 10.5.5 Business performance

      • 10.5.6 Key strategic moves and developments

    • 10.6 Kawasaki Heavy Industries Ltd.

      • 10.6.1 Company overview

      • 10.6.2 Company snapshot

      • 10.6.3 Operating business segments

      • 10.6.4 Product portfolio

      • 10.6.5 Business performance

      • 10.6.6 Key strategic moves and developments

    • 10.7 KUBOTA Corporation

      • 10.7.1 Company overview

      • 10.7.2 Company snapshot

      • 10.7.3 Operating business segments

      • 10.7.4 Product portfolio

      • 10.7.5 Business performance

      • 10.7.6 Key strategic moves and developments

    • 10.8 Kwang Yang Motor Co., Ltd.

      • 10.8.1 Company overview

      • 10.8.2 Company snapshot

      • 10.8.3 Operating business segments

      • 10.8.4 Product portfolio

      • 10.8.5 Business performance

      • 10.8.6 Key strategic moves and developments

    • 10.9 Polaris Industries, Inc.

      • 10.9.1 Company overview

      • 10.9.2 Company snapshot

      • 10.9.3 Operating business segments

      • 10.9.4 Product portfolio

      • 10.9.5 Business performance

      • 10.9.6 Key strategic moves and developments

    • 10.10 Suzuki Motor Corporation

      • 10.10.1 Company overview

      • 10.10.2 Company snapshot

      • 10.10.3 Operating business segments

      • 10.10.4 Product portfolio

      • 10.10.5 Business performance

      • 10.10.6 Key strategic moves and developments

    • 10.11 Textron Inc.

      • 10.11.1 Company overview

      • 10.11.2 Company snapshot

      • 10.11.3 Operating business segments

      • 10.11.4 Product portfolio

      • 10.11.5 Business performance

      • 10.11.6 Key strategic moves and developments

    • 10.12 Yamaha Motor Co., Ltd.

      • 10.12.1 Company overview

      • 10.12.2 Company snapshot

      • 10.12.3 Operating business segments

      • 10.12.4 Product portfolio

      • 10.12.5 Business performance

      • 10.12.6 Key strategic moves and developments

  • LIST OF TABLES

  • TABLE 1. GLOBAL ALL-TERRAIN VEHICLE MARKET, BY TYPE, 2021-2031 ($MILLION)
    TABLE 2. ALL-TERRAIN VEHICLE MARKET SIZE, FOR UTILITY ALL-TERRAIN VEHICLE, BY REGION, 2021-2031 ($MILLION)
    TABLE 3. ALL-TERRAIN VEHICLE MARKET FOR UTILITY ALL-TERRAIN VEHICLE, BY COUNTRY, 2021-2031 ($MILLION)
    TABLE 4. ALL-TERRAIN VEHICLE MARKET SIZE, FOR SPORT ALL-TERRAIN VEHICLE, BY REGION, 2021-2031 ($MILLION)
    TABLE 5. ALL-TERRAIN VEHICLE MARKET FOR SPORT ALL-TERRAIN VEHICLE, BY COUNTRY, 2021-2031 ($MILLION)
    TABLE 6. ALL-TERRAIN VEHICLE MARKET SIZE, FOR OTHERS, BY REGION, 2021-2031 ($MILLION)
    TABLE 7. ALL-TERRAIN VEHICLE MARKET FOR OTHERS, BY COUNTRY, 2021-2031 ($MILLION)
    TABLE 8. GLOBAL ALL-TERRAIN VEHICLE MARKET, BY FUEL TYPE, 2021-2031 ($MILLION)
    TABLE 9. ALL-TERRAIN VEHICLE MARKET SIZE, FOR GASOLINE POWERED, BY REGION, 2021-2031 ($MILLION)
    TABLE 10. ALL-TERRAIN VEHICLE MARKET FOR GASOLINE POWERED, BY COUNTRY, 2021-2031 ($MILLION)
    TABLE 11. ALL-TERRAIN VEHICLE MARKET SIZE, FOR DIESEL POWERED, BY REGION, 2021-2031 ($MILLION)
    TABLE 12. ALL-TERRAIN VEHICLE MARKET FOR DIESEL POWERED, BY COUNTRY, 2021-2031 ($MILLION)
    TABLE 13. ALL-TERRAIN VEHICLE MARKET SIZE, FOR ELECTRIC POWERED, BY REGION, 2021-2031 ($MILLION)
    TABLE 14. ALL-TERRAIN VEHICLE MARKET FOR ELECTRIC POWERED, BY COUNTRY, 2021-2031 ($MILLION)
    TABLE 15. ALL-TERRAIN VEHICLE MARKET SIZE, FOR SOLAR POWERED, BY REGION, 2021-2031 ($MILLION)
    TABLE 16. ALL-TERRAIN VEHICLE MARKET FOR SOLAR POWERED, BY COUNTRY, 2021-2031 ($MILLION)
    TABLE 17. GLOBAL ALL-TERRAIN VEHICLE MARKET, BY DISPLACEMENT, 2021-2031 ($MILLION)
    TABLE 18. ALL-TERRAIN VEHICLE MARKET SIZE, FOR LESS THAN 400 CC, BY REGION, 2021-2031 ($MILLION)
    TABLE 19. ALL-TERRAIN VEHICLE MARKET FOR LESS THAN 400 CC, BY COUNTRY, 2021-2031 ($MILLION)
    TABLE 20. ALL-TERRAIN VEHICLE MARKET SIZE, FOR BETWEEN 400 CC AND 800 CC, BY REGION, 2021-2031 ($MILLION)
    TABLE 21. ALL-TERRAIN VEHICLE MARKET FOR BETWEEN 400 CC AND 800 CC, BY COUNTRY, 2021-2031 ($MILLION)
    TABLE 22. ALL-TERRAIN VEHICLE MARKET SIZE, FOR GREATER THAN 800 CC, BY REGION, 2021-2031 ($MILLION)
    TABLE 23. ALL-TERRAIN VEHICLE MARKET FOR GREATER THAN 800 CC, BY COUNTRY, 2021-2031 ($MILLION)
    TABLE 24. GLOBAL ALL-TERRAIN VEHICLE MARKET, BY END-USE, 2021-2031 ($MILLION)
    TABLE 25. ALL-TERRAIN VEHICLE MARKET SIZE, FOR AGRICULTURE, BY REGION, 2021-2031 ($MILLION)
    TABLE 26. ALL-TERRAIN VEHICLE MARKET FOR AGRICULTURE, BY COUNTRY, 2021-2031 ($MILLION)
    TABLE 27. ALL-TERRAIN VEHICLE MARKET SIZE, FOR MILITARY, BY REGION, 2021-2031 ($MILLION)
    TABLE 28. ALL-TERRAIN VEHICLE MARKET FOR MILITARY, BY COUNTRY, 2021-2031 ($MILLION)
    TABLE 29. ALL-TERRAIN VEHICLE MARKET SIZE, FOR MOUNTAINEERING, BY REGION, 2021-2031 ($MILLION)
    TABLE 30. ALL-TERRAIN VEHICLE MARKET FOR MOUNTAINEERING, BY COUNTRY, 2021-2031 ($MILLION)
    TABLE 31. ALL-TERRAIN VEHICLE MARKET SIZE, FOR OTHERS, BY REGION, 2021-2031 ($MILLION)
    TABLE 32. ALL-TERRAIN VEHICLE MARKET FOR OTHERS, BY COUNTRY, 2021-2031 ($MILLION)
    TABLE 33. ALL-TERRAIN VEHICLE MARKET, BY REGION, 2021-2031 ($MILLION)
    TABLE 34. NORTH AMERICA ALL-TERRAIN VEHICLE MARKET, BY TYPE, 2021-2031 ($MILLION)
    TABLE 35. NORTH AMERICA ALL-TERRAIN VEHICLE MARKET, BY FUEL TYPE, 2021-2031 ($MILLION)
    TABLE 36. NORTH AMERICA ALL-TERRAIN VEHICLE MARKET, BY DISPLACEMENT, 2021-2031 ($MILLION)
    TABLE 37. NORTH AMERICA ALL-TERRAIN VEHICLE MARKET, BY END-USE, 2021-2031 ($MILLION)
    TABLE 38. NORTH AMERICA ALL-TERRAIN VEHICLE MARKET, BY COUNTRY, 2021-2031 ($MILLION)
    TABLE 39. U.S. ALL-TERRAIN VEHICLE MARKET, BY TYPE, 2021-2031 ($MILLION)
    TABLE 40. U.S. ALL-TERRAIN VEHICLE MARKET, BY FUEL TYPE, 2021-2031 ($MILLION)
    TABLE 41. U.S. ALL-TERRAIN VEHICLE MARKET, BY DISPLACEMENT, 2021-2031 ($MILLION)
    TABLE 42. U.S. ALL-TERRAIN VEHICLE MARKET, BY END-USE, 2021-2031 ($MILLION)
    TABLE 43. CANADA ALL-TERRAIN VEHICLE MARKET, BY TYPE, 2021-2031 ($MILLION)
    TABLE 44. CANADA ALL-TERRAIN VEHICLE MARKET, BY FUEL TYPE, 2021-2031 ($MILLION)
    TABLE 45. CANADA ALL-TERRAIN VEHICLE MARKET, BY DISPLACEMENT, 2021-2031 ($MILLION)
    TABLE 46. CANADA ALL-TERRAIN VEHICLE MARKET, BY END-USE, 2021-2031 ($MILLION)
    TABLE 47. MEXICO ALL-TERRAIN VEHICLE MARKET, BY TYPE, 2021-2031 ($MILLION)
    TABLE 48. MEXICO ALL-TERRAIN VEHICLE MARKET, BY FUEL TYPE, 2021-2031 ($MILLION)
    TABLE 49. MEXICO ALL-TERRAIN VEHICLE MARKET, BY DISPLACEMENT, 2021-2031 ($MILLION)
    TABLE 50. MEXICO ALL-TERRAIN VEHICLE MARKET, BY END-USE, 2021-2031 ($MILLION)
    TABLE 51. EUROPE ALL-TERRAIN VEHICLE MARKET, BY TYPE, 2021-2031 ($MILLION)
    TABLE 52. EUROPE ALL-TERRAIN VEHICLE MARKET, BY FUEL TYPE, 2021-2031 ($MILLION)
    TABLE 53. EUROPE ALL-TERRAIN VEHICLE MARKET, BY DISPLACEMENT, 2021-2031 ($MILLION)
    TABLE 54. EUROPE ALL-TERRAIN VEHICLE MARKET, BY END-USE, 2021-2031 ($MILLION)
    TABLE 55. EUROPE ALL-TERRAIN VEHICLE MARKET, BY COUNTRY, 2021-2031 ($MILLION)
    TABLE 56. UK ALL-TERRAIN VEHICLE MARKET, BY TYPE, 2021-2031 ($MILLION)
    TABLE 57. UK ALL-TERRAIN VEHICLE MARKET, BY FUEL TYPE, 2021-2031 ($MILLION)
    TABLE 58. UK ALL-TERRAIN VEHICLE MARKET, BY DISPLACEMENT, 2021-2031 ($MILLION)
    TABLE 59. UK ALL-TERRAIN VEHICLE MARKET, BY END-USE, 2021-2031 ($MILLION)
    TABLE 60. GERMANY ALL-TERRAIN VEHICLE MARKET, BY TYPE, 2021-2031 ($MILLION)
    TABLE 61. GERMANY ALL-TERRAIN VEHICLE MARKET, BY FUEL TYPE, 2021-2031 ($MILLION)
    TABLE 62. GERMANY ALL-TERRAIN VEHICLE MARKET, BY DISPLACEMENT, 2021-2031 ($MILLION)
    TABLE 63. GERMANY ALL-TERRAIN VEHICLE MARKET, BY END-USE, 2021-2031 ($MILLION)
    TABLE 64. FRANCE ALL-TERRAIN VEHICLE MARKET, BY TYPE, 2021-2031 ($MILLION)
    TABLE 65. FRANCE ALL-TERRAIN VEHICLE MARKET, BY FUEL TYPE, 2021-2031 ($MILLION)
    TABLE 66. FRANCE ALL-TERRAIN VEHICLE MARKET, BY DISPLACEMENT, 2021-2031 ($MILLION)
    TABLE 67. FRANCE ALL-TERRAIN VEHICLE MARKET, BY END-USE, 2021-2031 ($MILLION)
    TABLE 68. ITALY ALL-TERRAIN VEHICLE MARKET, BY TYPE, 2021-2031 ($MILLION)
    TABLE 69. ITALY ALL-TERRAIN VEHICLE MARKET, BY FUEL TYPE, 2021-2031 ($MILLION)
    TABLE 70. ITALY ALL-TERRAIN VEHICLE MARKET, BY DISPLACEMENT, 2021-2031 ($MILLION)
    TABLE 71. ITALY ALL-TERRAIN VEHICLE MARKET, BY END-USE, 2021-2031 ($MILLION)
    TABLE 72. REST OF EUROPE ALL-TERRAIN VEHICLE MARKET, BY TYPE, 2021-2031 ($MILLION)
    TABLE 73. REST OF EUROPE ALL-TERRAIN VEHICLE MARKET, BY FUEL TYPE, 2021-2031 ($MILLION)
    TABLE 74. REST OF EUROPE ALL-TERRAIN VEHICLE MARKET, BY DISPLACEMENT, 2021-2031 ($MILLION)
    TABLE 75. REST OF EUROPE ALL-TERRAIN VEHICLE MARKET, BY END-USE, 2021-2031 ($MILLION)
    TABLE 76. ASIA-PACIFIC ALL-TERRAIN VEHICLE MARKET, BY TYPE, 2021-2031 ($MILLION)
    TABLE 77. ASIA-PACIFIC ALL-TERRAIN VEHICLE MARKET, BY FUEL TYPE, 2021-2031 ($MILLION)
    TABLE 78. ASIA-PACIFIC ALL-TERRAIN VEHICLE MARKET, BY DISPLACEMENT, 2021-2031 ($MILLION)
    TABLE 79. ASIA-PACIFIC ALL-TERRAIN VEHICLE MARKET, BY END-USE, 2021-2031 ($MILLION)
    TABLE 80. ASIA-PACIFIC ALL-TERRAIN VEHICLE MARKET, BY COUNTRY, 2021-2031 ($MILLION)
    TABLE 81. CHINA ALL-TERRAIN VEHICLE MARKET, BY TYPE, 2021-2031 ($MILLION)
    TABLE 82. CHINA ALL-TERRAIN VEHICLE MARKET, BY FUEL TYPE, 2021-2031 ($MILLION)
    TABLE 83. CHINA ALL-TERRAIN VEHICLE MARKET, BY DISPLACEMENT, 2021-2031 ($MILLION)
    TABLE 84. CHINA ALL-TERRAIN VEHICLE MARKET, BY END-USE, 2021-2031 ($MILLION)
    TABLE 85. JAPAN ALL-TERRAIN VEHICLE MARKET, BY TYPE, 2021-2031 ($MILLION)
    TABLE 86. JAPAN ALL-TERRAIN VEHICLE MARKET, BY FUEL TYPE, 2021-2031 ($MILLION)
    TABLE 87. JAPAN ALL-TERRAIN VEHICLE MARKET, BY DISPLACEMENT, 2021-2031 ($MILLION)
    TABLE 88. JAPAN ALL-TERRAIN VEHICLE MARKET, BY END-USE, 2021-2031 ($MILLION)
    TABLE 89. INDIA ALL-TERRAIN VEHICLE MARKET, BY TYPE, 2021-2031 ($MILLION)
    TABLE 90. INDIA ALL-TERRAIN VEHICLE MARKET, BY FUEL TYPE, 2021-2031 ($MILLION)
    TABLE 91. INDIA ALL-TERRAIN VEHICLE MARKET, BY DISPLACEMENT, 2021-2031 ($MILLION)
    TABLE 92. INDIA ALL-TERRAIN VEHICLE MARKET, BY END-USE, 2021-2031 ($MILLION)
    TABLE 93. SOUTH KOREA ALL-TERRAIN VEHICLE MARKET, BY TYPE, 2021-2031 ($MILLION)
    TABLE 94. SOUTH KOREA ALL-TERRAIN VEHICLE MARKET, BY FUEL TYPE, 2021-2031 ($MILLION)
    TABLE 95. SOUTH KOREA ALL-TERRAIN VEHICLE MARKET, BY DISPLACEMENT, 2021-2031 ($MILLION)
    TABLE 96. SOUTH KOREA ALL-TERRAIN VEHICLE MARKET, BY END-USE, 2021-2031 ($MILLION)
    TABLE 97. REST OF ASIA PACIFIC ALL-TERRAIN VEHICLE MARKET, BY TYPE, 2021-2031 ($MILLION)
    TABLE 98. REST OF ASIA PACIFIC ALL-TERRAIN VEHICLE MARKET, BY FUEL TYPE, 2021-2031 ($MILLION)
    TABLE 99. REST OF ASIA PACIFIC ALL-TERRAIN VEHICLE MARKET, BY DISPLACEMENT, 2021-2031 ($MILLION)
    TABLE 100. REST OF ASIA PACIFIC ALL-TERRAIN VEHICLE MARKET, BY END-USE, 2021-2031 ($MILLION)
    TABLE 101. LAMEA ALL-TERRAIN VEHICLE MARKET, BY TYPE, 2021-2031 ($MILLION)
    TABLE 102. LAMEA ALL-TERRAIN VEHICLE MARKET, BY FUEL TYPE, 2021-2031 ($MILLION)
    TABLE 103. LAMEA ALL-TERRAIN VEHICLE MARKET, BY DISPLACEMENT, 2021-2031 ($MILLION)
    TABLE 104. LAMEA ALL-TERRAIN VEHICLE MARKET, BY END-USE, 2021-2031 ($MILLION)
    TABLE 105. LAMEA ALL-TERRAIN VEHICLE MARKET, BY COUNTRY, 2021-2031 ($MILLION)
    TABLE 106. LATIN AMERICA ALL-TERRAIN VEHICLE MARKET, BY TYPE, 2021-2031 ($MILLION)
    TABLE 107. LATIN AMERICA ALL-TERRAIN VEHICLE MARKET, BY FUEL TYPE, 2021-2031 ($MILLION)
    TABLE 108. LATIN AMERICA ALL-TERRAIN VEHICLE MARKET, BY DISPLACEMENT, 2021-2031 ($MILLION)
    TABLE 109. LATIN AMERICA ALL-TERRAIN VEHICLE MARKET, BY END-USE, 2021-2031 ($MILLION)
    TABLE 110. MIDDLE EAST ALL-TERRAIN VEHICLE MARKET, BY TYPE, 2021-2031 ($MILLION)
    TABLE 111. MIDDLE EAST ALL-TERRAIN VEHICLE MARKET, BY FUEL TYPE, 2021-2031 ($MILLION)
    TABLE 112. MIDDLE EAST ALL-TERRAIN VEHICLE MARKET, BY DISPLACEMENT, 2021-2031 ($MILLION)
    TABLE 113. MIDDLE EAST ALL-TERRAIN VEHICLE MARKET, BY END-USE, 2021-2031 ($MILLION)
    TABLE 114. AFRICA ALL-TERRAIN VEHICLE MARKET, BY TYPE, 2021-2031 ($MILLION)
    TABLE 115. AFRICA ALL-TERRAIN VEHICLE MARKET, BY FUEL TYPE, 2021-2031 ($MILLION)
    TABLE 116. AFRICA ALL-TERRAIN VEHICLE MARKET, BY DISPLACEMENT, 2021-2031 ($MILLION)
    TABLE 117. AFRICA ALL-TERRAIN VEHICLE MARKET, BY END-USE, 2021-2031 ($MILLION)
    TABLE 118.BRP INC.: COMPANY SNAPSHOT
    TABLE 119.BRP INC.: OPERATING SEGMENTS
    TABLE 120.BRP INC.: PRODUCT PORTFOLIO
    TABLE 121.BRP INC.: NET SALES,
    TABLE 122.BRP INC.: KEY STRATERGIES
    TABLE 123.CFMOTO: COMPANY SNAPSHOT
    TABLE 124.CFMOTO: OPERATING SEGMENTS
    TABLE 125.CFMOTO: PRODUCT PORTFOLIO
    TABLE 126.CFMOTO: NET SALES,
    TABLE 127.CFMOTO: KEY STRATERGIES
    TABLE 128.DEERE & COMPANY: COMPANY SNAPSHOT
    TABLE 129.DEERE & COMPANY: OPERATING SEGMENTS
    TABLE 130.DEERE & COMPANY: PRODUCT PORTFOLIO
    TABLE 131.DEERE & COMPANY: NET SALES,
    TABLE 132.DEERE & COMPANY: KEY STRATERGIES
    TABLE 133.HISUN MOTORS CORP.: COMPANY SNAPSHOT
    TABLE 134.HISUN MOTORS CORP.: OPERATING SEGMENTS
    TABLE 135.HISUN MOTORS CORP.: PRODUCT PORTFOLIO
    TABLE 136.HISUN MOTORS CORP.: NET SALES,
    TABLE 137.HISUN MOTORS CORP.: KEY STRATERGIES
    TABLE 138.HONDA MOTOR CO., LTD.: COMPANY SNAPSHOT
    TABLE 139.HONDA MOTOR CO., LTD.: OPERATING SEGMENTS
    TABLE 140.HONDA MOTOR CO., LTD.: PRODUCT PORTFOLIO
    TABLE 141.HONDA MOTOR CO., LTD.: NET SALES,
    TABLE 142.HONDA MOTOR CO., LTD.: KEY STRATERGIES
    TABLE 143.KAWASAKI HEAVY INDUSTRIES LTD.: COMPANY SNAPSHOT
    TABLE 144.KAWASAKI HEAVY INDUSTRIES LTD.: OPERATING SEGMENTS
    TABLE 145.KAWASAKI HEAVY INDUSTRIES LTD.: PRODUCT PORTFOLIO
    TABLE 146.KAWASAKI HEAVY INDUSTRIES LTD.: NET SALES,
    TABLE 147.KAWASAKI HEAVY INDUSTRIES LTD.: KEY STRATERGIES
    TABLE 148.KUBOTA CORPORATION: COMPANY SNAPSHOT
    TABLE 149.KUBOTA CORPORATION: OPERATING SEGMENTS
    TABLE 150.KUBOTA CORPORATION: PRODUCT PORTFOLIO
    TABLE 151.KUBOTA CORPORATION: NET SALES,
    TABLE 152.KUBOTA CORPORATION: KEY STRATERGIES
    TABLE 153.KWANG YANG MOTOR CO., LTD.: COMPANY SNAPSHOT
    TABLE 154.KWANG YANG MOTOR CO., LTD.: OPERATING SEGMENTS
    TABLE 155.KWANG YANG MOTOR CO., LTD.: PRODUCT PORTFOLIO
    TABLE 156.KWANG YANG MOTOR CO., LTD.: NET SALES,
    TABLE 157.KWANG YANG MOTOR CO., LTD.: KEY STRATERGIES
    TABLE 158.POLARIS INDUSTRIES, INC.: COMPANY SNAPSHOT
    TABLE 159.POLARIS INDUSTRIES, INC.: OPERATING SEGMENTS
    TABLE 160.POLARIS INDUSTRIES, INC.: PRODUCT PORTFOLIO
    TABLE 161.POLARIS INDUSTRIES, INC.: NET SALES,
    TABLE 162.POLARIS INDUSTRIES, INC.: KEY STRATERGIES
    TABLE 163.SUZUKI MOTOR CORPORATION: COMPANY SNAPSHOT
    TABLE 164.SUZUKI MOTOR CORPORATION: OPERATING SEGMENTS
    TABLE 165.SUZUKI MOTOR CORPORATION: PRODUCT PORTFOLIO
    TABLE 166.SUZUKI MOTOR CORPORATION: NET SALES,
    TABLE 167.SUZUKI MOTOR CORPORATION: KEY STRATERGIES
    TABLE 168.TEXTRON INC.: COMPANY SNAPSHOT
    TABLE 169.TEXTRON INC.: OPERATING SEGMENTS
    TABLE 170.TEXTRON INC.: PRODUCT PORTFOLIO
    TABLE 171.TEXTRON INC.: NET SALES,
    TABLE 172.TEXTRON INC.: KEY STRATERGIES
    TABLE 173.YAMAHA MOTOR CO., LTD.: COMPANY SNAPSHOT
    TABLE 174.YAMAHA MOTOR CO., LTD.: OPERATING SEGMENTS
    TABLE 175.YAMAHA MOTOR CO., LTD.: PRODUCT PORTFOLIO
    TABLE 176.YAMAHA MOTOR CO., LTD.: NET SALES,
    TABLE 177.YAMAHA MOTOR CO., LTD.: KEY STRATERGIES
  • LIST OF FIGURES

  • FIGURE 1.ALL-TERRAIN VEHICLE MARKET SEGMENTATION
    FIGURE 2.ALL-TERRAIN VEHICLE MARKET,2021-2031
    FIGURE 3.ALL-TERRAIN VEHICLE MARKET,2021-2031
    FIGURE 4. TOP INVESTMENT POCKETS, BY REGION
    FIGURE 5.PORTER FIVE-1
    FIGURE 6.PORTER FIVE-2
    FIGURE 7.PORTER FIVE-3
    FIGURE 8.PORTER FIVE-4
    FIGURE 9.PORTER FIVE-5
    FIGURE 10.TOP PLAYER POSITIONING
    FIGURE 11.ALL-TERRAIN VEHICLE MARKET:DRIVERS, RESTRAINTS AND OPPORTUNITIES
    FIGURE 12.ALL-TERRAIN VEHICLE MARKET,BY TYPE,2021(%)
    FIGURE 13.COMPARATIVE SHARE ANALYSIS OF UTILITY ALL-TERRAIN VEHICLE ALL-TERRAIN VEHICLE MARKET,2021-2031(%)
    FIGURE 14.COMPARATIVE SHARE ANALYSIS OF SPORT ALL-TERRAIN VEHICLE ALL-TERRAIN VEHICLE MARKET,2021-2031(%)
    FIGURE 15.COMPARATIVE SHARE ANALYSIS OF OTHERS ALL-TERRAIN VEHICLE MARKET,2021-2031(%)
    FIGURE 16.ALL-TERRAIN VEHICLE MARKET,BY FUEL TYPE,2021(%)
    FIGURE 17.COMPARATIVE SHARE ANALYSIS OF GASOLINE POWERED ALL-TERRAIN VEHICLE MARKET,2021-2031(%)
    FIGURE 18.COMPARATIVE SHARE ANALYSIS OF DIESEL POWERED ALL-TERRAIN VEHICLE MARKET,2021-2031(%)
    FIGURE 19.COMPARATIVE SHARE ANALYSIS OF ELECTRIC POWERED ALL-TERRAIN VEHICLE MARKET,2021-2031(%)
    FIGURE 20.COMPARATIVE SHARE ANALYSIS OF SOLAR POWERED ALL-TERRAIN VEHICLE MARKET,2021-2031(%)
    FIGURE 21.ALL-TERRAIN VEHICLE MARKET,BY DISPLACEMENT,2021(%)
    FIGURE 22.COMPARATIVE SHARE ANALYSIS OF LESS THAN 400 CC ALL-TERRAIN VEHICLE MARKET,2021-2031(%)
    FIGURE 23.COMPARATIVE SHARE ANALYSIS OF BETWEEN 400 CC AND 800 CC ALL-TERRAIN VEHICLE MARKET,2021-2031(%)
    FIGURE 24.COMPARATIVE SHARE ANALYSIS OF GREATER THAN 800 CC ALL-TERRAIN VEHICLE MARKET,2021-2031(%)
    FIGURE 25.ALL-TERRAIN VEHICLE MARKET,BY END-USE,2021(%)
    FIGURE 26.COMPARATIVE SHARE ANALYSIS OF AGRICULTURE ALL-TERRAIN VEHICLE MARKET,2021-2031(%)
    FIGURE 27.COMPARATIVE SHARE ANALYSIS OF MILITARY ALL-TERRAIN VEHICLE MARKET,2021-2031(%)
    FIGURE 28.COMPARATIVE SHARE ANALYSIS OF MOUNTAINEERING ALL-TERRAIN VEHICLE MARKET,2021-2031(%)
    FIGURE 29.COMPARATIVE SHARE ANALYSIS OF OTHERS ALL-TERRAIN VEHICLE MARKET,2021-2031(%)
    FIGURE 30.ALL-TERRAIN VEHICLE MARKET BY REGION,2021
    FIGURE 31.U.S. ALL-TERRAIN VEHICLE MARKET,2021-2031($MILLION)
    FIGURE 32.CANADA ALL-TERRAIN VEHICLE MARKET,2021-2031($MILLION)
    FIGURE 33.MEXICO ALL-TERRAIN VEHICLE MARKET,2021-2031($MILLION)
    FIGURE 34.UK ALL-TERRAIN VEHICLE MARKET,2021-2031($MILLION)
    FIGURE 35.GERMANY ALL-TERRAIN VEHICLE MARKET,2021-2031($MILLION)
    FIGURE 36.FRANCE ALL-TERRAIN VEHICLE MARKET,2021-2031($MILLION)
    FIGURE 37.ITALY ALL-TERRAIN VEHICLE MARKET,2021-2031($MILLION)
    FIGURE 38.REST OF EUROPE ALL-TERRAIN VEHICLE MARKET,2021-2031($MILLION)
    FIGURE 39.CHINA ALL-TERRAIN VEHICLE MARKET,2021-2031($MILLION)
    FIGURE 40.JAPAN ALL-TERRAIN VEHICLE MARKET,2021-2031($MILLION)
    FIGURE 41.INDIA ALL-TERRAIN VEHICLE MARKET,2021-2031($MILLION)
    FIGURE 42.SOUTH KOREA ALL-TERRAIN VEHICLE MARKET,2021-2031($MILLION)
    FIGURE 43.REST OF ASIA PACIFIC ALL-TERRAIN VEHICLE MARKET,2021-2031($MILLION)
    FIGURE 44.LATIN AMERICA ALL-TERRAIN VEHICLE MARKET,2021-2031($MILLION)
    FIGURE 45.MIDDLE EAST ALL-TERRAIN VEHICLE MARKET,2021-2031($MILLION)
    FIGURE 46.AFRICA ALL-TERRAIN VEHICLE MARKET,2021-2031($MILLION)
    FIGURE 47. TOP WINNING STRATEGIES, BY YEAR
    FIGURE 48. TOP WINNING STRATEGIES, BY DEVELOPMENT
    FIGURE 49. TOP WINNING STRATEGIES, BY COMPANY
    FIGURE 50.PRODUCT MAPPING OF TOP 10 PLAYERS
    FIGURE 51.COMPETITIVE DASHBOARD
    FIGURE 52.COMPETITIVE HEATMAP OF TOP 10 KEY PLAYERS
    FIGURE 53.BRP INC..: NET SALES ,($MILLION)
    FIGURE 54.CFMOTO.: NET SALES ,($MILLION)
    FIGURE 55.DEERE & COMPANY.: NET SALES ,($MILLION)
    FIGURE 56.HISUN MOTORS CORP..: NET SALES ,($MILLION)
    FIGURE 57.HONDA MOTOR CO., LTD..: NET SALES ,($MILLION)
    FIGURE 58.KAWASAKI HEAVY INDUSTRIES LTD..: NET SALES ,($MILLION)
    FIGURE 59.KUBOTA CORPORATION.: NET SALES ,($MILLION)
    FIGURE 60.KWANG YANG MOTOR CO., LTD..: NET SALES ,($MILLION)
    FIGURE 61.POLARIS INDUSTRIES, INC..: NET SALES ,($MILLION)
    FIGURE 62.SUZUKI MOTOR CORPORATION.: NET SALES ,($MILLION)
    FIGURE 63.TEXTRON INC..: NET SALES ,($MILLION)
    FIGURE 64.YAMAHA MOTOR CO., LTD..: NET SALES ,($MILLION)


The global all-terrain vehicle market is expected to witness significant growth due to increase in trend of adventure sports and recreational activities, rise in demand for ATV in military activities, and government rules to support driving ATVs on road.

ATVs are used for exploring nature camping and others, but these vehicles are also very risky and dangerous. There is an increase in the rate of accidents related to ATVs, owing to the rise in the number of such vehicles in the market. For instance, the highest number of deaths due to ATV accidents occurred in the U.S., a country with the highest number of ATVs. Nearly all the accidents related to these vehicles are caused due to the driver’s failure to act in a safe and reasonable manner.

Moreover, the market players are introducing more safe and secure ATVs with advanced features such as GPS. For instance, automotive company, Yamaha Motor Corp., USA, announced its proven off-road recreational, utility, and sport ATVs with class-leading safety, capability, comfort, and equipped with GPS tablet. Therefore, the production of ATVs with added safety measures to avoid injuries and death hold an opportunity for the key players operating in the all-terrain vehicle market.

In order to gain a fair share of the market, major players adopted different strategies, for instance, partnership, product launch, and business expansion. Among these, business expansion is the leading strategy used by prominent players such as Honda Motor Co., Ltd., Kawasaki Heavy Industries Ltd., KUBOTA Corporation, Kwang Yang Motor Co., Ltd., Polaris Industries, Inc. Aforementioned companies launched cutting-edge all-terrain vehicle products seeking to grab a fair share of the market.

PURCHASE OPTIONS

Call or Email us

U.S.-Canada Toll-free: +1-800-792-5285
Int'l : +1-503-894-6022
Europe : +44-845-528-1300
Email : help@alliedmarketresearch.com
 
FREQUENTLY ASKED QUESTIONS?

A. The global all-terrain vehicle market was valued at $3.2 billion in 2021 and is projected to reach $5.0 billion in 2031, registering a CAGR of 4.8%.

A. The leading companies include BRP Inc., CFMoto, Deere & Company, Hisun, Honda Motor Co., Ltd., Kawasaki Heavy Industries Ltd., Kubota Corporation, Kwang Yang Motor Co., Ltd., Polaris Industries Inc., Suzuki Motor Corporation, Textron Inc., and Yamaha Motor Co., Ltd.

A. The largest regional market is North America.

A. The leading application is mountaineering.

A. The upcoming trends in the market include greater adoption of electric-powered vehicles and increasing adoption in mountaineering applications.

Looking for Customization?

 Customization Request

Have a Question?

 Speak with Analyst

Any Confusion?

 Inquire Before Buying

Have a glance of the Report

  Request Sample
RELATED TAGS

Purchase Full Report of
All-terrain Vehicle Market

Start reading instantly.
This Report and over 67,112+ more Reports, Available with Avenue Library. T&C*.

  • Online Only
  • $3,570
  • Online cloud access only
  • Restricted print, copy, paste & download
  • Read only
  • Free industry update
    (Within 180 days)
  • Free report update in next update cycle
    (Sep 2023 - Sep 2024)
  • Data Pack
  • $3,840
  • Restricted to one authorized user
  • One print only
  • Available in
    Excel
  • Free industry update
    (Within 180 days)
  •   Free report update in next update cycle
    (Sep 2023 - Sep 2024)
  • Single User
  • $5,730
  • Restricted to one authorized user
  • One print only
  • Available in
    PDF
  • Free industry update
    (Within 180 days)
  •   Free report update in next update cycle
    (Sep 2023 - Sep 2024)
  • Five Users
  • $6,450
  • Limited to five authorized users
  • Print upto five copies
  • Available in
    PDF
  • Free industry update
    (Within 180 days)
  •   Free report update in next update cycle
    (Sep 2023 - Sep 2024)
  • Enterprise
    License/PDF

  • $9,600
  • Unlimited
    within
    company/enterprise
  • Available in Excel & PDF
  • Free industry update
    (Within 180 days)
  •   Free report update in next update cycle
    (Sep 2023 - Sep 2024)
  • Library
    Membership

  • $999 $ 1,175
    Per User/ Per month/ Billed annually
  • Published Content
    E-access
  • Company Profiles
    E-access
  • Newly Added Content Access
  • 10 PDF
    Downloads
  • 5 Excel Data
    Pack Downloads
  • 250 Company Profiles PDF Downloads
  • Buy Now

*Taxes/Fees, if applicable will be added during checkout. All prices in USD

RELATED REPORTS
 

Why Allied Market Research?


Infallible Methodology

To ensure high-level data integrity, accurate analysis, and impeccable forecasts

Analyst Support

For complete satisfaction

Customization

On-demand customization of scope of the report to exactly meet your needs

TARGETED MARKET VIEW

Targeted market view to provide pertinent information and save time of readers

Get fresh content delivered

Get insights on topics that are crucial for your business. Stay abreast of your interest areas.

Get Industry Data Alerts

Why Allied Market Research?

Infallible Methodology

To ensure high-level data integrity, accurate analysis, and impeccable forecasts

Analyst Support

For complete satisfaction

Customization

On-demand customization of scope of the report to exactly meet your needs

TARGETED MARKET VIEW

Targeted market view to provide pertinent information and save time of readers