
Allergy Immunotherapy Market Research, 2033
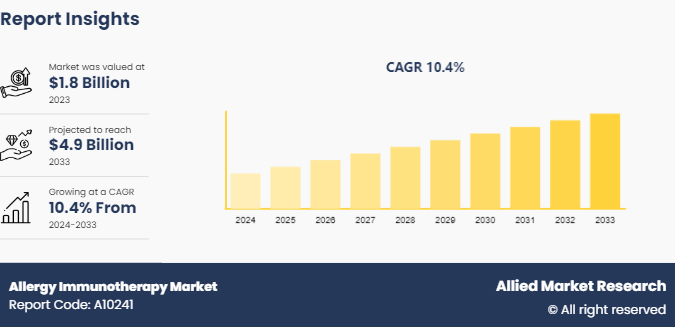
The global allergy immunotherapy market size was valued at $1.8 billion in 2023, and is projected to reach $4.9 billion by 2033, growing at a CAGR of 10.4% from 2024 to 2033. The allergy immunotherapy market growth is driven by rise in prevalence of allergic disorders and advancements in treatment options. Increase in incidence of allergies also boosts the growth of the market. Allergy immunotherapy represents a transformative approach to managing allergic diseases. It addresses the root cause of allergic responses rather than merely alleviating symptoms and offers durable benefits, improved quality of life, and potential prevention of disease progression.
Allergy immunotherapy is designed to reduce allergic symptoms. This type of treatment works by retraining the immune system to tolerate specific allergens. Allergic reactions occur when the immune system overreacts to harmless substances. In sensitized individuals, exposure to these allergens triggers the production of immunoglobulin E antibodies. Allergy immunotherapy works by administering gradually increasing doses of the specific allergen to which the patient is sensitive. This controlled exposure shifts the immune response from an IgE-dominated pathway to a regulated immune profile.
Market Introduction and Definition
Allergy immunotherapy, also known as desensitization or hypo-sensitization, is a medical treatment aimed at reducing the sensitivity to allergens. It involves the gradual introduction of increasing amounts of the allergen into the body of the patient through injections or tablets or drops. This process helps the immune system become less reactive to the allergen, thereby reducing the severity and frequency of allergic reactions. This therapy is used to treat conditions such as allergic rhinitis, allergic asthma, and insect venom allergies. It is beneficial for patients who do not respond well to conventional allergy medications.
Subcutaneous immunotherapy involves injecting small amounts of allergen extracts under the skin. It is used by the physicians to treat pollen, dust mite, pet dander, and insect venom allergies. Sublingual immunotherapy involves placing allergen tablets or drops under the tongue, where they are absorbed through the oral mucosa. It is used by the physicians to treat grass pollen, ragweed, and house dust mite allergies.
Advancements in biotechnology help enhance the precision and safety of allergy immunotherapy. Recombinant allergens, peptide-based therapies, and adjuvants are being developed to improve efficacy while reducing treatment duration and adverse effects. Personalized approaches based on molecular allergy diagnostics are also enabling targeted treatment strategies.
Key Takeaways
- The allergy immunotherapy market share study covers 20 countries. The research includes a segment analysis of each country in terms of value ($Billion) for the projected 2024-2033 allergy immunotherapy market forecast period.
- More than 1, 500 product literatures, industry releases, annual reports, and other such documents of major Allergy Immunotherapy industry participants along with authentic industry journals, trade associations' releases, and government websites have been reviewed for generating high-value industry insights.
- The study integrated high-quality data, professional opinions and analysis, and critical independent perspectives. The research approach is intended to provide a balanced view of global allergy immunotherapy market and to assist stakeholders in making educated decisions in order to achieve their most ambitious growth objectives.
Key Market Dynamics
The allergy immunotherapy market is experiencing steady growth. This is attributed to increase in prevalence of allergies, advancements in technology, and surge in awareness of long-term treatment benefits. However, the market also faces several restraints that impact adoption and accessibility. Understanding the key drivers, restraints, and emerging opportunities provides insight into the future trajectory of this therapeutic area.
Drivers
Rise in prevalence of allergic diseases is one of the major factors that fuels the growth of the allergy immunotherapy market. Urbanization, environmental pollution, and climate change contribute to a significant increase in allergic rhinitis, asthma, and food allergies. Further, developments in industrialization and exposure to airborne allergens increase immune sensitization in developed and rapidly urbanizing regions. In addition, there is an increase in demand for disease-modifying therapies. Regulatory approvals of standardized sublingual tablets help increase physician confidence. Furthermore, increase in healthcare awareness and availability of enhanced diagnostic tools enable precise identification of allergen sensitivities. This supports personalized immunotherapy approaches and enhances treatment outcomes.
Restraints
Long treatment duration can reduce patient adherence and discourage initiation of allergy immunotherapy. Further, high costs of treatment and limited reimbursement in certain regions also restrict market penetration. In many developing countries, immunotherapy remains underutilized due to inadequate healthcare infrastructure and lack of specialist availability. Concerns regarding safety are also projected to deter some patients and providers from opting for allergy immunotherapy.
Opportunities
Developments in healthcare infrastructure and increase in disposable income in Asia-Pacific, Latin America, and the Middle East offer growth potential to the allergy immunotherapy market during the forecast period. Development of shorter-course immunotherapy regimens and peptide vaccines help enhance treatment outcomes, thus fueling the market growth. The integration of digital health tools help improve compliance and expand access to care. Personalized medicine approaches using biomarker-based patient selection are projected to further optimize treatment effectiveness.
Which Region Dominates the Global Allergy Immunotherapy Market and What Drives Its Leadership?
Europe dominates the global allergy immunotherapy market. This is attributed to presence of advanced healthcare systems and favorable reimbursement frameworks that increase the accessibility of the immunotherapy treatments to patients. Many countries in Western Europe provide structured insurance coverage or national reimbursement schemes for allergy immunotherapy. This helps reduce out-of-pocket costs and encourage usage of allergy immunotherapy across the region. Further, surge in prevalence of allergic conditions, including allergic rhinitis and asthma also foster the growth of the Europe allergy immunotherapy market.
Prevalence of Self-Reported Allergies By Gender for Allergy Immunotherapy industry
According to an case study published in National Library Of Medicine in January 2022. The data shows the prevalence of self-reported allergies by gender, highlighting differences in allergy types for the allergy immunotherapy market. Women report higher overall allergy prevalence compared to men. Specific allergies like pollen (10.4% vs. 6.2%) , house dust mite (6.9% vs. 5.1%) , food (6.8% vs. 3.0%) , contact allergies (8.1% vs. 2.3%) , drug allergies (7.6% vs. 3.0%) , and animal allergies (7.6% vs. 3.0%) are more common in women. Insect venom and other allergies are also more frequent in women (4.4% and 1.6%) than in men (3.4% and 0.9%) . This indicates a significant gender disparity in allergy prevalence, which could impact the demand for allergy immunotherapy treatments.
Market Segmentation
The allergy immunotherapy market is segmented into type, application, distribution channel, and region. On the basis of type, the market is categorized into subcutaneous immunotherapy, and sublingual immunotherapy. On the basis of Application, the market is segmented into Allergy Rhinitis, Asthma, Food Allergy, and Others. On the basis of Distribution channels, the market is segmented into hospital pharmacies, retail, and online pharmacies. Region wise, it is analyzed across North America, Europe, Asia-Pacific, and LAMEA.
Regional/Country Market Outlook
The Allergy Immunotherapy Market Size shows significant regional variation in its growth and adoption. North America, particularly the United States, dominates due to high prevalence of allergic conditions and advanced healthcare infrastructure. Europe, led by Germany and the UK, follows closely, supported by favorable reimbursement policies and extensive clinical research. In Asia-Pacific, countries like China and Japan are experiencing rapid market expansion, driven by increasing allergy awareness, improving healthcare access, and growing adoption of innovative therapies. Emerging markets in Latin America and the Middle East also show potential, with rising investments in healthcare and growing prevalence of allergies enhancing the demand for effective immunotherapy solutions.
- In June, 2021, Stallergenes Greer, a biopharmaceutical company specialising in treatments for respiratory allergies, announces that Alustal, its subcutaneous allergen immunotherapy (SCIT) solution, is now available in Italy and Spain following the full resumption of SCIT production in Antony (France) . Alustal will be also available in Australia, France and Switzerland in the coming months.
- In November 2021, Vimian Group, signed an agreement to develop new vaccines for allergy and atopic dermatitis together with Angany, a Canadian biotechnology company focused on the development of novel bioparticle-based vaccines.
Industry Trends
- In September 2023, Stallergenes Greer, a leading global healthcare company specialising in allergen immunotherapy (AIT) , announced today that it has signed global agreements with Nestlé to harness the peanut allergy oral immunotherapy treatment Palforzia.
- In February 2024, the U.S. FDA approved Xolair (omalizumab) injections for treating immunoglobulin E-mediated food allergies in specific adults and children. This medication reduces the risk of anaphylaxis from accidental food exposure.
- In June, 2021, Stallergenes Greer, a biopharmaceutical company specialising in treatments for respiratory allergies, announces that Alustal, its subcutaneous allergen immunotherapy (SCIT) solution, is now available in Italy and Spain following the full resumption of SCIT production in Antony (France) . Alustal will be also available in Australia, France and Switzerland in the coming months.
- In November 2021, Vimian Group, signed an agreement to develop new vaccines for allergy and atopic dermatitis together with Angany, a Canadian biotechnology company focused on the development of novel bioparticle-based vaccines.
Which Regions Are Emerging as High-Growth Markets?
The Asia-Pacific region is the fastest-growing market segment in the global allergy immunotherapy market. This is attributed to urbanization, rise in pollution levels, and lifestyle changes that increase the prevalence of allergic rhinitis and other allergic conditions. Developments in healthcare systems and investments in advanced diagnostic and treatment services also boost the growth of the market. Public health campaigns and increase in physician education help improve awareness of immunotherapy benefits, driving earlier diagnosis and treatment adoption.
Further, the LAMEA region is also experiencing growth owing to expansion of allergy care infrastructure and introduction of reimbursement initiatives that support immunotherapy demand. North America is witnessing growth owing to increase in prevalence of cases of allergy, advancements in clinical practices, and increase in adoption of newer immunotherapy forms.
Competitive Landscape
The major players operating in the Allergy Immunotherapy market share include Torii Pharmaceutical Co., Ltd., Biomay AG, ALK-Abello A/S, HAL Allergy Group, Allergy Therapeutics, Stallergenes Greer, Allovate LLC, Jubliant Pharma, Leti Pharma, and Merck KGaA. Other players in the Allergy Immunotherapy market include Zhejiang Wolwo Bio-pharmaceutical Co., Ltd, Holding Dermapharm, and so on.
What Makes the U.S./Europe/Asia-Pacific Key Markets for Industry Players?
United States:
The U.S. has one of the highest prevalence rates of allergic diseases, with a significant portion of the population reporting seasonal allergies, asthma, or other IgE-mediated conditions. Increase in disease burden drives the demand for both traditional and emerging therapies. Advancements in healthcare infrastructure and a strong emphasis on personalized medicine support the adoption of immunotherapy. Additionally, the U.S. regulatory environment, with FDA approvals for new immunotherapy products and expanded indications, encourages innovation and commercialization.
Europe:
Europe is the largest existing market in the allergy immunotherapy sector. This is attributed to well-structured public healthcare systems, strong reimbursement policies, and high physician familiarity with immunotherapy protocols. National health coverage in major markets like Germany and France supports sustained patient access, while regulatory harmonization within the EU enables efficient product approvals and wider market reach. Europe also leads in clinical research and has a long history of integrating immunotherapy into standard allergy care pathways. This makes the region attractive for companies launching both established and innovative therapies.
Asia-Pacific:
Asia-Pacific offers a major growth potential for industry players. Surge in urbanization, increase in allergy prevalence, and rise in healthcare expenditure are opportunistic for the growth of the market. Rise in awareness among healthcare professionals and patients helps improve diagnosis rates and treatment uptake. For many companies, early investments in Asia-Pacific positions them to benefit from large, expanding populations.
Recent Key Strategies and Developments
- In April 2021, ALK-Abelló A/S, a pharmaceutical company which specializes in the development and manufacturing of allergy immunotherapy products, initiated a clinical trial to study the safety and efficacy of sublingual immunotherapy tablets in children and adolescents suffering from allergic rhinitis induced by birch pollen.
- In October 2022, Allergy Partners, the nation’s largest single specialty allergy practice group leading the development and delivery of high-quality health care for patients with asthma and allergic disease, announced a strategic collaboration with Aimmune Therapeutics, Inc., a Nestlé Health Science company developing pharmaceutical therapies to prevent, manage, and treat food, gastrointestinal, and metabolic-related diseases, to provide Allergy Partners’ patients aged 4 through 17 years with a confirmed diagnosis of peanut allergy with direct access to PALFORZIA, the first and only FDA-approved peanut allergy treatment.
What Recent Mergers, Acquisitions, or Partnerships Are Shaping the Market?
The allergy immunotherapy market is increasingly influenced by mergers, acquisitions, and strategic partnerships that enhance product portfolios, expand geographic reach, and accelerate innovation. According to Allied Market Research, recent moves reflect a broader trend in the industry toward consolidation and collaborative development.
One of the most significant recent developments is the acquisition of RAPT Therapeutics by GlaxoSmithKline (GSK) for approximately $2.2 billion. This agreement gives GSK access to ozureprubart, an experimental long-acting antibody therapy targeting IgE-mediated food allergies. This deal is important because it expands GSK’s immunotherapy and immunology portfolio and reflects broader industry interest in biologic-based allergy treatments.
A strategic collaboration provides direct access for pediatric patients to PALFORZIA—an FDA-approved oral immunotherapy for peanut allergies. This partnership enhances clinical reach and patient access while supporting growth in the food allergy segment.
Companies are also entering research agreements with universities and scientific institutions to develop biomarkers and next-generation immunotherapy approaches. Such collaborations accelerate translational research, transforming laboratory findings into clinical solutions.
Regional licensing and co-development agreements remain popular. For example, firms sometimes partner with local biotechnology companies to commercialize specific products in markets like Asia-Pacific and Latin America. These arrangements broaden geographic coverage and adapt products to regional regulatory environments.
Key Sources Referred
- World Health Organization (WHO)
- Centers for Medicare & Medicaid Services (CMS)
- World Allergy Organization
- National Health Service (NHS)
- National Health Mission (NHM)
- Centers for Disease Control and Prevention (CDC)
- Food and Drug Administration (FDA)
- National Institutes of Health (NIH)
- Mental Health Foundation
Key Benefits for Stakeholders
- This report provides a quantitative analysis of the market segments, current trends, estimations, and dynamics of the allergy immunotherapy market analysis from 2024 to 2033 to identify the prevailing allergy immunotherapy market opportunity.
- The market research is offered along with information related to key drivers, restraints, and opportunities.
- Porter's five forces analysis highlights the potency of buyers and suppliers to enable stakeholders make profit-oriented business decisions and strengthen their supplier-buyer network.
- In-depth analysis of the allergy immunotherapy market segmentation assists to determine the prevailing market opportunities.
- Major countries in each region are mapped according to their revenue contribution to the global allergy immunotherapy market.
- Market player positioning facilitates benchmarking and provides a clear understanding of the present position of the allergy immunotherapy market players.
- The report includes the analysis of the regional as well as global allergy immunotherapy market trends, key players, market segments, application areas, and market growth strategies.
Allergy Immunotherapy Market Report Highlights
| Aspects | Details |
| Market Size By 2033 | USD 4.9 Billion |
| Growth Rate | CAGR of 10.4% |
| Forecast period | 2024 - 2033 |
| Report Pages | 216 |
| By Type |
|
| By Application |
|
| By Distribution Channel |
|
| By Region |
|
| Key Market Players | Jubliant Pharma, Allovate, LLC, Stallergenes Greer, Biomay AG, Allergy Therapeutics, HAL Allergy Group, Torii Pharmaceutical Co., Ltd., Merck KGaA, Leti Pharma, ALK-Abello A/S |
The total market value of Allergy Immunotherapy Market is $1.8 billion in 2023.
The forecast period for Allergy Immunotherapy Market is 2024 to 2033
The market value of Allergy Immunotherapy Market in 2033 is $4.9 billion
The base year is 2023 in Allergy Immunotherapy Market .
Top companies such as Torii Pharmaceutical Co., Ltd., Biomay AG ,ALK-Abello A/S, HAL Allergy Group, Allergy Therapeutics, held a high market position in 2023. These key players held a high market postion owing to the strong geographical foothold in North America, Europe, Asia-Pacific, LAMEA.
The subcutaneous immunotherapy (SCIT) segment is the most influencing segment in Allergy Immunotherapy Market.
Loading Table Of Content...

