
Allergy Treatment Market Research, 2025
The global allergy treatment market size was valued at $24,653.4 million in 2017 and is expected to reach $40,360.2 million by 2025, registering a CAGR of 6.3% from 2018 to 2025. An allergy is a condition caused by hypersensitivity of the immune system to typically harmless substances, often referred to as allergens, in the environment. Allergens can include aeroallergens such as dust mite, mold, tree weed, grass pollen, milk, egg, soy, wheat, and others. These allergens can cause various allergic disease conditions including hay fever or allergic rhinitis, asthma, atopic dermatitis, and others. The major symptoms of allergic reactions include itching in the nose, roof of the mouth, throat, or eyes as well as sneezing, stuffy nose (congestion), teary eyes, and others. In addition, food allergies can cause symptoms such as vomiting, diarrhea, or respiratory symptoms, after ingestion of an allergen. According to the WHO, allergies are the fourth largest global pathology condition after cancer, AIDS, and cardiovascular diseases.
Market Dynamics
The major key factors that drive the global allergy treatment market include significant increase in the prevalence of allergic diseases, rise in preferences toward over-the-counter drugs for allergy treatment, and surge in self-medication in consumers. However, increased usage of biosimilars, and safety & efficacy concerns regarding the side effects associated with vigorous consumption of anti-allergy drugs are anticipated to hamper the growth of the allergy treatment market. On the contrary, increased R&D and rise in awareness among healthcare professionals as well as patients regarding immunotherapy for the treatment of allergies are expected to create lucrative opportunities in future.
Segment Overview
The allergy treatment market is segmented on the basis of type, treatment, and geography. On the basis of type, the market is bifurcated into eye allergy, food allergy, skin allergy, asthma, rhinitis, and others. On the basis of treatment, the allergy treatment market is classified into anti-allergy drugs and immunotherapy. On the basis of geography, the market is analyzed across North America, Europe, Asia-Pacific, and LAMEA.
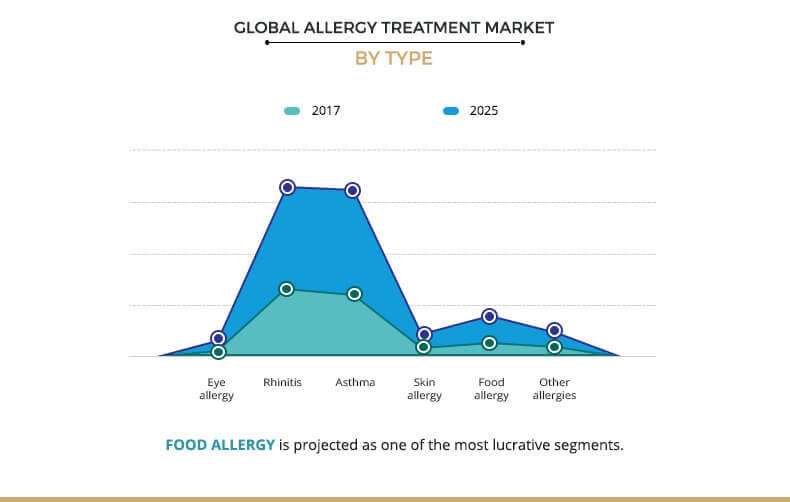
By Type
Based on type, the allergy treatment market is bifurcated into eye allergy, food allergy, skin allergy, asthma, rhinitis, and others. The rhinitis allergy segment was the highest contributor to the market in 2017, and is anticipated to maintain its dominance throughout the forecast period. This was attributed to the increase in prevalence of allergic rhinitis across the globe. For instance, according to the European Academy of Allergy and Clinical Immunology (EAACI), in 2017, around 400 million people suffered from rhinitis worldwide.
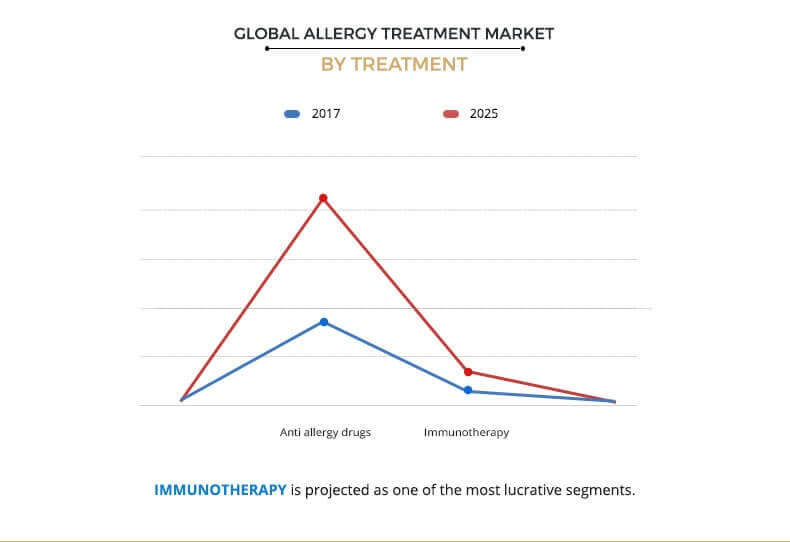
By Treatment
Based on treatment, the allergy treatment market is classified into anti-allergy drugs and immunotherapy. The anti-allergy drugs segment accounted for the highest revenue in 2017 and is expected to maintain its dominance throughout the forecast period. This is attributed to the convenience of self-administration, compactness, and easy manufacturing of oral dosage forms.
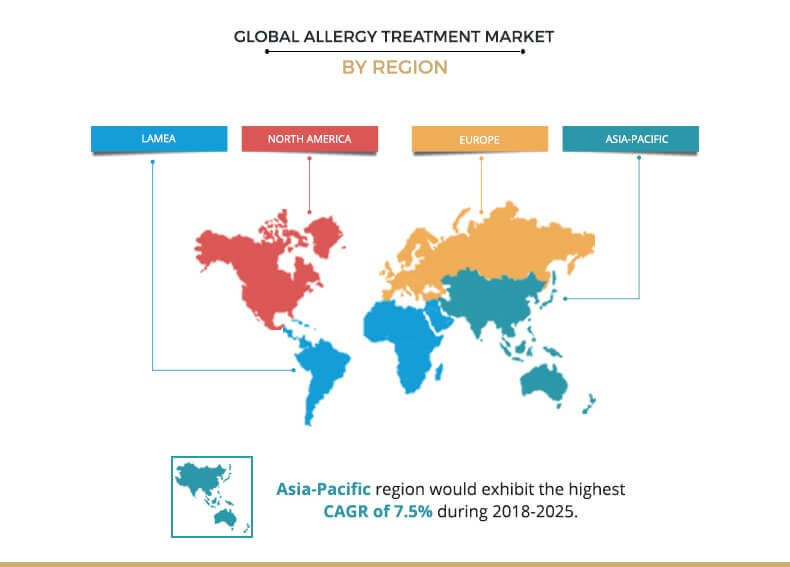
By Geography
Based on region, the allergy treatment market is analyzed across North America, Europe, Asia-Pacific, and LAMEA. North America dominated the market in 2017, accounting for the highest share, and is anticipated to maintain this trend throughout the forecast period. However, Asia-Pacific is projected to register the highest growth rate from 2018 to 2025.
The report provides a comprehensive analysis of the leading companies operating in the global market such as GlaxoSmithKline, ALK-Abelló A/S, Sallergenes Greer, Allergy Therapeutics, Sanofi SA, Johnson & Johnson, Merck Co. In, Merck KGaA, F. Hoffmann-La Roche AG, and Allergan plc.
Key Benefits for Stakeholders
- The study provides an in-depth analysis of the global allergy treatment market share with the current trends and future estimations to elucidate the imminent investment pockets.
- A comprehensive analysis of the factors that drive and restrict the allergy treatment market growth is provided.
- A comprehensive quantitative analysis of the industry is provided from 2018 to 2025 to assist stakeholders to capitalize on the prevailing market opportunities.
- An extensive analysis of the key segments of the industry helps understand the global allergy treatment market trends.
- Key players and their strategies are provided to understand the competitive outlook of the industry.
Allergy Treatment Market Report Highlights
| Aspects | Details |
| By Type |
|
| By Treatment Type |
|
| By Dosage Form |
|
| By Distribution Channels |
|
| By Region |
|
| Key Market Players | Stallergenes Greer plc, Allergan Plc., Merck & Co. Inc., Johnson & Johnson, Merck KGaA (Allergopharma), F. Hoffmann-La Roche Ltd. (Genentech Inc.), AALK-Abello A, Allergy Therapeutics plc, Sanofi SA, GlaxoSmithKline plc |
Analyst Review
Allergy is a hypersensitive reaction by the patient’s immune system in response to certain substances. The substances that stimulate the immune system in response are known as allergens. Different allergens are responsible to cause various types of allergic reactions. Allergy is one of the major health concerns globally. The allergy treatment market has piqued the interest of the healthcare industry due to significant increase in the prevalence of various allergies in the recent years. Among all allergies, rhinitis and asthma are the most prevailing diseases, both in the developing as well as developed economies. However, incidents of food allergies have also been on the rise over the years across the globe.
Based on dosage form, the oral drugs segment generated the highest revenue, owing to the rise in preference among consumers toward oral drug consumption, and ease in its manufacturing process. However, intranasal dosage form is anticipated to grow at the highest CAGR throughout the forecast period.
The allergy treatment market is expected to witness a substantial growth owing to the surge in self-directed consumers and rise in awareness regarding immunotherapy treatment. Increase in traction toward incorporation of immunotherapies for the treatment of various allergies contributes to the market growth. There have been remarkable advancements in the field of immunotherapy, which have enabled key market players to focus on the development of allergen-specific immunotherapies. These factors are expected to boost the growth of the market in near future.
Loading Table Of Content...

