0
2022
Alpha Olefin Market

Alpha Olefin Market

by Product (1-Octene, 1-Hexene, 1-Butene, Others), by Application (Synthetic Lubricants, Detergent Alcohol, Polyethylene, Others): Global Opportunity Analysis and Industry Forecast, 2021-2031

Report Code: A11577
Oct 2022 | Pages: 280
Tables: 107
Charts: 61
  • Formats*:

  • pdf

    Single User License, Five User
    License & Enterprise User License

  • xls

    Data Pack Excel License

  • ppt

    It comes with the additional cost
    of $2500.00 contact sales.


Alpha Olefin Market Research, 2031

The global alpha olefin market was valued at $4.1 billion in 2021, and is projected to reach $8.2 billion by 2031, growing at a CAGR of 7.5% from 2022 to 2031.Olefins are hydrocarbons with one or more double bonds between two adjacent carbon atoms, often known as alkenes. Olefins or alkenes with the chemical formula CnH2n are known as alpha olefins, which can be identified from other mono-olefins with a similar molecular formula by the regularity of the hydrocarbon chain and the positioning of the double bond at the main or alpha position. Alpha olefin are primarily used in the production of polyethylene, lubricants, detergents, plasticizers, oil field chemicals, and fine chemicals.

The COVID-19 pandemic has brought several uncertainties leading to severe economic losses as various businesses across the world were standstill.The COVID-19 pandemic had a detrimental influence on the market due to statewide lock down, social distancing measures, and worldwide travel restrictions that disrupted the car and oil and gas industries. This has ultimately lowered the demand for alpha olefins due to disruptions in supply chain, closure of manufacturing plants, as well as economic slowdown across several countries.

Alpha Olefin Market

The increase in demand from the automobile industry is a major driver that is anticipated to expand the alpha olefin market size. Alpha olefin base synthetic lubricants are in high demand because of the constant rise in the number of automobiles around the world. Alpha olefin end products such as plasticizers, synthetic lubricants, and others are mostly used in the automotive industry. Natural atomic orbitals and their derivatives are widely used as plasticizers, surfactants, vehicle additives, synthetic lubricating oils, lubricating, paper scaling, and in a variety of specialized applications. Due to these applications, alpha olefins serve as the foundation for synthetic lubricants used in automotive and industrial applications. When compared to mineral base stocks, a number of parameters, including kinematic viscosity and viscosity index, pour point, volatility, thermal and oxidative stability, sensitivity to antioxidants, and flash and auto-ignition points, are superior to mineral-based synthetic lubricants.

The process used to manufacture alpha olefin is considered to be the main market constraint. The process requires extreme pressure and temperature for the manufacturing of olefins. Incorrect pressure and temperature changes may result in a product fault that makes it unusable and results in a considerable loss for the manufacturing company. These factors are projected to hamper the alpha olefin market growth in the forecast time.

The consumption of alpha-olefins is increasing across the globe due to the increase in usage of alpha olefins in various industries. The major businesses are ready to make huge investments in the study and creation of alpha olefins. The market for alpha olefins is anticipated to expand in the upcoming years due to its numerous applications in areas such as consumer goods, packaging, industrial processes, and others. Alpha olefins can be used as the drilling fluids for drilling equipment owing to the increase in the extraction of oil and gas.

The industry players are investing on the R&D of smart and unique strategies to sustain their growth in the market. These strategies include product launches, mergers & acquisitions, collaborations, partnerships, and refurbishing of existing technology. On February 25, 2022, Axens and Univation Technologies entered into an agreement to increase capital and operational efficiency for the production of on-purpose linear alpha olefins, including butene-1 and hexene-1, for use in producing polyethylene resins using the UNIPOL PE process.

The alpha olefin market key players profiled in the report include Qatar Chemical Company Ltd (Q-chem)., Chevron Phillips Chemical Company LLC, Mitsubishi Chemical Corp, Exxon Mobil Corporation, INEOS Oligomers, Petrochemicals Sdn. Bhd, Royal Dutch Shell, Evonik Industries, and JAM Petrochemicals Company.

The alpha olefin market forecast is segmented on the basis of product, application, and region. By product, the market is divided into 1-Octene, 1-Hexene, 1-Butene, and others. By application, the market is classified into synthetic lubricants, detergent alcohol, polyethylene, and others. By region, the alpha olefin market outlook is analyzed across North America, Europe, Asia-Pacific, and LAMEA.
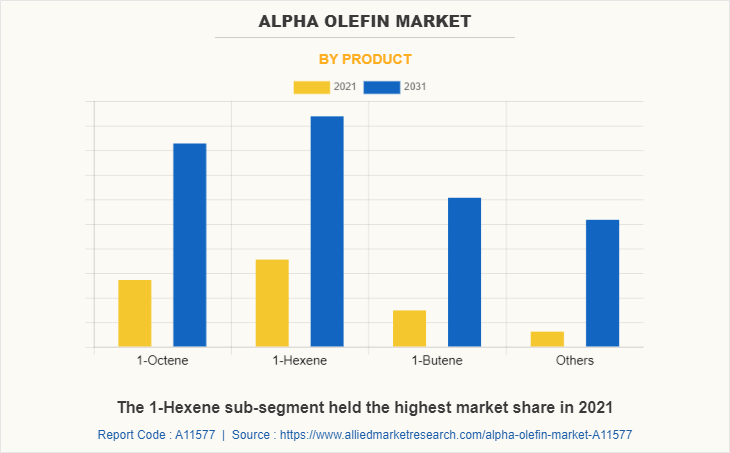
The alpha olefin market is segmented into Product and Application.

Alpha Olefin Market

By product, the 1-Hexene sub-segment dominated the market in 2021. 1-Hexene is a higher olefin, or alkene, with the formula C6H12. Since 1-hexene is an alpha-olefin, its double bond is in the alpha position, giving the alpha olefins greater reactivity and hence advantageous chemical characteristics. 1-Hexene is a commercially important linear alpha olefin. The principal application of 1-hexene is as a comonomer in the manufacturing of polyethene. Another important application of 1-hexene is the manufacturing of linear aldehyde by hydroformylation for the subsequent generation of the short-chain fatty acid heptanoic acid. These are predicted to be the major factors affecting the alpha olefin market share during the forecast period.
Alpha Olefin Market

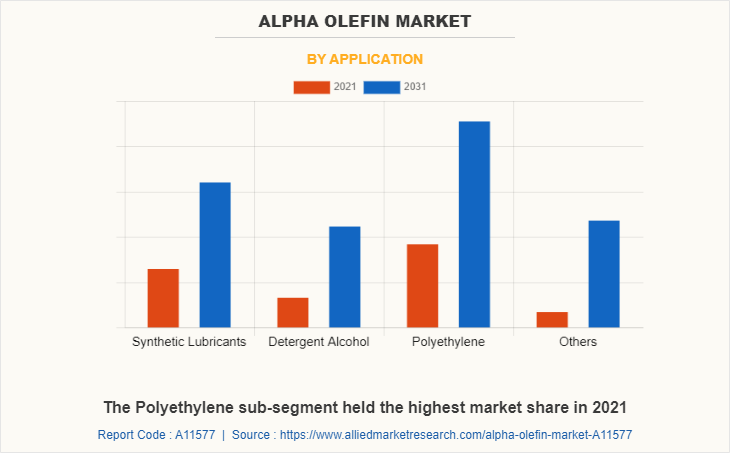
By application, the polyethylene sub-segment dominated the global alpha olefin market share in 2021. One of the most widely used polymers in the world is polyethylene, usually referred to as polythene or polyethene. Synthetic polymers are largely used in packaging; polyethylene is commonly used in plastic bottles, films, bags, and containers. Every year, more than 100 million tons of polyethene are produced for commercial and industrial purposes.
Alpha Olefin Market

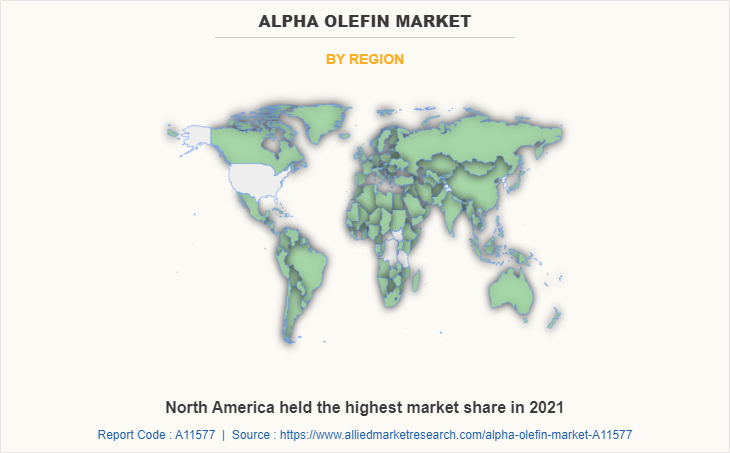
By region, North America dominated the global market in 2021 and is projected to remain the fastest growing region during the forecast period. The region offers significant market potential for alpha olefins due to its extensive and diverse industrial base. The existence of several manufacturing enterprises, as well as an increase in developments in petrochemical and gas and oil infrastructure, are projected to drive the expansion of the regional market. North America is considered as a potential investment hub for the manufacturing of alpha olefins by both local and international firms due to its abundant natural resource reserves. For instance, in December 2021, Chevron Phillips Chemical announced a final investment decision for a new C3 splitter facility to help expand its propylene business. The unit will be housed within the company's Cedar Bayou factory in Baytown, Texas. Starting in 2023, it is planned to have an annual capacity of 1 billion pounds.

Impact of COVID-19 on the Global Alpha Olefin Industry

  • The COVID-19 pandemic has had a severe impact on the alpha olefin market globally. The alpha olefins market growth has suffered as a result of prolonged lockdowns in the majority of the countries.
  • Sales of alpha olefins are directly proportional to the demand from end-use industries namely automotive, chemicals, appliances, packaging, and others. However, the demand for alpha olefins in the chemicals industry was greatly affected owing to import-export restrictions, closed borders, and supply chain disruptions due to the outbreak of the COVID-19 pandemic.
  • The economic slowdown has affected the setup of new alpha olefins projects across the world as the majority of government funding was diverted toward the healthcare sector owing to the rapid spread of COVID-19, impacting the market to a great extent

Key Benefits For Stakeholders

  • This report provides a quantitative analysis of the market segments, current trends, estimations, and dynamics of the alpha olefin market analysis from 2021 to 2031 to identify the prevailing alpha olefin market opportunities.
  • The market research is offered along with information related to key drivers, restraints, and opportunities.
  • Porter's five forces analysis highlights the potency of buyers and suppliers to enable stakeholders make profit-oriented business decisions and strengthen their supplier-buyer network.
  • In-depth analysis of the alpha olefin market segmentation assists to determine the prevailing market opportunities.
  • Major countries in each region are mapped according to their revenue contribution to the global market.
  • Market player positioning facilitates benchmarking and provides a clear understanding of the present position of the market players.
  • The report includes the analysis of the regional as well as global alpha olefin market trends, key players, market segments, application areas, and market growth strategies.

Alpha Olefin Market Report Highlights

Aspects Details
Market Size By 2031 USD 8.2 billion
Growth Rate CAGR of 7.5%
Forecast period 2021 - 2031
Report Pages 280
By Product
  • 1-Octene
  • 1-Hexene
  • 1-Butene
  • Others
By Application
  • Synthetic Lubricants
  • Detergent Alcohol
  • Polyethylene
  • Others
By Region
  • North America  (U.S., Canada, Mexico)
  • Europe  (Germany, UK, France, Spain, Italy, Rest Of Europe)
  • Asia-Pacific  (China, Japan, India, South Korea, Australia, Rest Of Asia-Pacific)
  • LAMEA  (Brazil, Saudi Arabia, UAE, South Africa, Rest Of LAMEA)
Key Market Players Evonik Industries AG, Exxon Mobil Corporation, Idemitsu Kosan Co., Ltd, SABIC, Chevron Phillips Chemical Company LLC, Qatar Chemical Company Ltd, INEOS, LANXESS
 
  • CHAPTER 1:INTRODUCTION

    • 1.1.Report description

    • 1.2.Key market segments

    • 1.3.Key benefits to the stakeholders

    • 1.4.Research Methodology

      • 1.4.1.Secondary research

      • 1.4.2.Primary research

      • 1.4.3.Analyst tools and models

  • CHAPTER 2:EXECUTIVE SUMMARY

    • 2.1.Key findings of the study

    • 2.2.CXO Perspective

  • CHAPTER 3:MARKET OVERVIEW

    • 3.1.Market definition and scope

    • 3.2.Key findings

      • 3.2.1.Top investment pockets

    • 3.3.Porter’s five forces analysis

    • 3.4.Top player positioning

    • 3.5.Market dynamics

      • 3.5.1.Drivers

      • 3.5.2.Restraints

      • 3.5.3.Opportunities

    • 3.6.COVID-19 Impact Analysis on the market

    • 3.7.Value Chain Analysis

    • 3.8.Market Share Analysis

    • 3.9.Regulatory Guidelines

    • 3.10.Key Regulation Analysis

    • 3.11.Patent Landscape

  • CHAPTER 4: ALPHA OLEFIN MARKET, BY PRODUCT

    • 4.1 Overview

      • 4.1.1 Market size and forecast

    • 4.2 1-Octene

      • 4.2.1 Key market trends, growth factors and opportunities

      • 4.2.2 Market size and forecast, by region

      • 4.2.3 Market analysis by country

    • 4.3 1-Hexene

      • 4.3.1 Key market trends, growth factors and opportunities

      • 4.3.2 Market size and forecast, by region

      • 4.3.3 Market analysis by country

    • 4.4 1-Butene

      • 4.4.1 Key market trends, growth factors and opportunities

      • 4.4.2 Market size and forecast, by region

      • 4.4.3 Market analysis by country

    • 4.5 Others

      • 4.5.1 Key market trends, growth factors and opportunities

      • 4.5.2 Market size and forecast, by region

      • 4.5.3 Market analysis by country

  • CHAPTER 5: ALPHA OLEFIN MARKET, BY APPLICATION

    • 5.1 Overview

      • 5.1.1 Market size and forecast

    • 5.2 Synthetic Lubricants

      • 5.2.1 Key market trends, growth factors and opportunities

      • 5.2.2 Market size and forecast, by region

      • 5.2.3 Market analysis by country

    • 5.3 Detergent Alcohol

      • 5.3.1 Key market trends, growth factors and opportunities

      • 5.3.2 Market size and forecast, by region

      • 5.3.3 Market analysis by country

    • 5.4 Polyethylene

      • 5.4.1 Key market trends, growth factors and opportunities

      • 5.4.2 Market size and forecast, by region

      • 5.4.3 Market analysis by country

    • 5.5 Others

      • 5.5.1 Key market trends, growth factors and opportunities

      • 5.5.2 Market size and forecast, by region

      • 5.5.3 Market analysis by country

  • CHAPTER 6: ALPHA OLEFIN MARKET, BY REGION

    • 6.1 Overview

      • 6.1.1 Market size and forecast

    • 6.2 North America

      • 6.2.1 Key trends and opportunities

      • 6.2.2 North America Market size and forecast, by Product

      • 6.2.3 North America Market size and forecast, by Application

      • 6.2.4 North America Market size and forecast, by country

        • 6.2.4.1 U.S.
          • 6.2.4.1.1 Market size and forecast, by Product
          • 6.2.4.1.2 Market size and forecast, by Application
        • 6.2.4.2 Canada
          • 6.2.4.2.1 Market size and forecast, by Product
          • 6.2.4.2.2 Market size and forecast, by Application
        • 6.2.4.3 Mexico
          • 6.2.4.3.1 Market size and forecast, by Product
          • 6.2.4.3.2 Market size and forecast, by Application
    • 6.3 Europe

      • 6.3.1 Key trends and opportunities

      • 6.3.2 Europe Market size and forecast, by Product

      • 6.3.3 Europe Market size and forecast, by Application

      • 6.3.4 Europe Market size and forecast, by country

        • 6.3.4.1 Germany
          • 6.3.4.1.1 Market size and forecast, by Product
          • 6.3.4.1.2 Market size and forecast, by Application
        • 6.3.4.2 UK
          • 6.3.4.2.1 Market size and forecast, by Product
          • 6.3.4.2.2 Market size and forecast, by Application
        • 6.3.4.3 France
          • 6.3.4.3.1 Market size and forecast, by Product
          • 6.3.4.3.2 Market size and forecast, by Application
        • 6.3.4.4 Spain
          • 6.3.4.4.1 Market size and forecast, by Product
          • 6.3.4.4.2 Market size and forecast, by Application
        • 6.3.4.5 Italy
          • 6.3.4.5.1 Market size and forecast, by Product
          • 6.3.4.5.2 Market size and forecast, by Application
        • 6.3.4.6 Rest of Europe
          • 6.3.4.6.1 Market size and forecast, by Product
          • 6.3.4.6.2 Market size and forecast, by Application
    • 6.4 Asia-Pacific

      • 6.4.1 Key trends and opportunities

      • 6.4.2 Asia-Pacific Market size and forecast, by Product

      • 6.4.3 Asia-Pacific Market size and forecast, by Application

      • 6.4.4 Asia-Pacific Market size and forecast, by country

        • 6.4.4.1 China
          • 6.4.4.1.1 Market size and forecast, by Product
          • 6.4.4.1.2 Market size and forecast, by Application
        • 6.4.4.2 Japan
          • 6.4.4.2.1 Market size and forecast, by Product
          • 6.4.4.2.2 Market size and forecast, by Application
        • 6.4.4.3 India
          • 6.4.4.3.1 Market size and forecast, by Product
          • 6.4.4.3.2 Market size and forecast, by Application
        • 6.4.4.4 South Korea
          • 6.4.4.4.1 Market size and forecast, by Product
          • 6.4.4.4.2 Market size and forecast, by Application
        • 6.4.4.5 Australia
          • 6.4.4.5.1 Market size and forecast, by Product
          • 6.4.4.5.2 Market size and forecast, by Application
        • 6.4.4.6 Rest of Asia-Pacific
          • 6.4.4.6.1 Market size and forecast, by Product
          • 6.4.4.6.2 Market size and forecast, by Application
    • 6.5 LAMEA

      • 6.5.1 Key trends and opportunities

      • 6.5.2 LAMEA Market size and forecast, by Product

      • 6.5.3 LAMEA Market size and forecast, by Application

      • 6.5.4 LAMEA Market size and forecast, by country

        • 6.5.4.1 Brazil
          • 6.5.4.1.1 Market size and forecast, by Product
          • 6.5.4.1.2 Market size and forecast, by Application
        • 6.5.4.2 Saudi Arabia
          • 6.5.4.2.1 Market size and forecast, by Product
          • 6.5.4.2.2 Market size and forecast, by Application
        • 6.5.4.3 UAE
          • 6.5.4.3.1 Market size and forecast, by Product
          • 6.5.4.3.2 Market size and forecast, by Application
        • 6.5.4.4 South Africa
          • 6.5.4.4.1 Market size and forecast, by Product
          • 6.5.4.4.2 Market size and forecast, by Application
        • 6.5.4.5 Rest of LAMEA
          • 6.5.4.5.1 Market size and forecast, by Product
          • 6.5.4.5.2 Market size and forecast, by Application
  • CHAPTER 7: COMPANY LANDSCAPE

    • 7.1. Introduction

    • 7.2. Top winning strategies

    • 7.3. Product Mapping of Top 10 Player

    • 7.4. Competitive Dashboard

    • 7.5. Competitive Heatmap

    • 7.6. Key developments

  • CHAPTER 8: COMPANY PROFILES

    • 8.1 Chevron Phillips Chemical Company LLC

      • 8.1.1 Company overview

      • 8.1.2 Company snapshot

      • 8.1.3 Operating business segments

      • 8.1.4 Product portfolio

      • 8.1.5 Business performance

      • 8.1.6 Key strategic moves and developments

    • 8.2 Exxon Mobil Corporation

      • 8.2.1 Company overview

      • 8.2.2 Company snapshot

      • 8.2.3 Operating business segments

      • 8.2.4 Product portfolio

      • 8.2.5 Business performance

      • 8.2.6 Key strategic moves and developments

    • 8.3 Evonik Industries AG

      • 8.3.1 Company overview

      • 8.3.2 Company snapshot

      • 8.3.3 Operating business segments

      • 8.3.4 Product portfolio

      • 8.3.5 Business performance

      • 8.3.6 Key strategic moves and developments

    • 8.4 Idemitsu Kosan Co., Ltd

      • 8.4.1 Company overview

      • 8.4.2 Company snapshot

      • 8.4.3 Operating business segments

      • 8.4.4 Product portfolio

      • 8.4.5 Business performance

      • 8.4.6 Key strategic moves and developments

    • 8.5 INEOS, LANXESS

      • 8.5.1 Company overview

      • 8.5.2 Company snapshot

      • 8.5.3 Operating business segments

      • 8.5.4 Product portfolio

      • 8.5.5 Business performance

      • 8.5.6 Key strategic moves and developments

    • 8.6 Qatar Chemical Company Ltd

      • 8.6.1 Company overview

      • 8.6.2 Company snapshot

      • 8.6.3 Operating business segments

      • 8.6.4 Product portfolio

      • 8.6.5 Business performance

      • 8.6.6 Key strategic moves and developments

    • 8.7 SABIC

      • 8.7.1 Company overview

      • 8.7.2 Company snapshot

      • 8.7.3 Operating business segments

      • 8.7.4 Product portfolio

      • 8.7.5 Business performance

      • 8.7.6 Key strategic moves and developments

  • LIST OF TABLES

  • TABLE 1. GLOBAL ALPHA OLEFIN MARKET, BY PRODUCT, 2021-2031 ($MILLION)
    TABLE 2. ALPHA OLEFIN MARKET, FOR 1-OCTENE, BY REGION, 2021-2031 ($MILLION)
    TABLE 3. ALPHA OLEFIN MARKET FOR 1-OCTENE, BY COUNTRY, 2021-2031 ($MILLION)
    TABLE 4. ALPHA OLEFIN MARKET, FOR 1-HEXENE, BY REGION, 2021-2031 ($MILLION)
    TABLE 5. ALPHA OLEFIN MARKET FOR 1-HEXENE, BY COUNTRY, 2021-2031 ($MILLION)
    TABLE 6. ALPHA OLEFIN MARKET, FOR 1-BUTENE, BY REGION, 2021-2031 ($MILLION)
    TABLE 7. ALPHA OLEFIN MARKET FOR 1-BUTENE, BY COUNTRY, 2021-2031 ($MILLION)
    TABLE 8. ALPHA OLEFIN MARKET, FOR OTHERS, BY REGION, 2021-2031 ($MILLION)
    TABLE 9. ALPHA OLEFIN MARKET FOR OTHERS, BY COUNTRY, 2021-2031 ($MILLION)
    TABLE 10. GLOBAL ALPHA OLEFIN MARKET, BY APPLICATION, 2021-2031 ($MILLION)
    TABLE 11. ALPHA OLEFIN MARKET, FOR SYNTHETIC LUBRICANTS, BY REGION, 2021-2031 ($MILLION)
    TABLE 12. ALPHA OLEFIN MARKET FOR SYNTHETIC LUBRICANTS, BY COUNTRY, 2021-2031 ($MILLION)
    TABLE 13. ALPHA OLEFIN MARKET, FOR DETERGENT ALCOHOL, BY REGION, 2021-2031 ($MILLION)
    TABLE 14. ALPHA OLEFIN MARKET FOR DETERGENT ALCOHOL, BY COUNTRY, 2021-2031 ($MILLION)
    TABLE 15. ALPHA OLEFIN MARKET, FOR POLYETHYLENE, BY REGION, 2021-2031 ($MILLION)
    TABLE 16. ALPHA OLEFIN MARKET FOR POLYETHYLENE, BY COUNTRY, 2021-2031 ($MILLION)
    TABLE 17. ALPHA OLEFIN MARKET, FOR OTHERS, BY REGION, 2021-2031 ($MILLION)
    TABLE 18. ALPHA OLEFIN MARKET FOR OTHERS, BY COUNTRY, 2021-2031 ($MILLION)
    TABLE 19. ALPHA OLEFIN MARKET, BY REGION, 2021-2031 ($MILLION)
    TABLE 20. NORTH AMERICA ALPHA OLEFIN MARKET, BY PRODUCT, 2021-2031 ($MILLION)
    TABLE 21. NORTH AMERICA ALPHA OLEFIN MARKET, BY APPLICATION, 2021-2031 ($MILLION)
    TABLE 22. NORTH AMERICA ALPHA OLEFIN MARKET, BY COUNTRY, 2021-2031 ($MILLION)
    TABLE 23. U.S. ALPHA OLEFIN MARKET, BY PRODUCT, 2021-2031 ($MILLION)
    TABLE 24. U.S. ALPHA OLEFIN MARKET, BY APPLICATION, 2021-2031 ($MILLION)
    TABLE 25. CANADA ALPHA OLEFIN MARKET, BY PRODUCT, 2021-2031 ($MILLION)
    TABLE 26. CANADA ALPHA OLEFIN MARKET, BY APPLICATION, 2021-2031 ($MILLION)
    TABLE 27. MEXICO ALPHA OLEFIN MARKET, BY PRODUCT, 2021-2031 ($MILLION)
    TABLE 28. MEXICO ALPHA OLEFIN MARKET, BY APPLICATION, 2021-2031 ($MILLION)
    TABLE 29. EUROPE ALPHA OLEFIN MARKET, BY PRODUCT, 2021-2031 ($MILLION)
    TABLE 30. EUROPE ALPHA OLEFIN MARKET, BY APPLICATION, 2021-2031 ($MILLION)
    TABLE 31. EUROPE ALPHA OLEFIN MARKET, BY COUNTRY, 2021-2031 ($MILLION)
    TABLE 32. GERMANY ALPHA OLEFIN MARKET, BY PRODUCT, 2021-2031 ($MILLION)
    TABLE 33. GERMANY ALPHA OLEFIN MARKET, BY APPLICATION, 2021-2031 ($MILLION)
    TABLE 34. UK ALPHA OLEFIN MARKET, BY PRODUCT, 2021-2031 ($MILLION)
    TABLE 35. UK ALPHA OLEFIN MARKET, BY APPLICATION, 2021-2031 ($MILLION)
    TABLE 36. FRANCE ALPHA OLEFIN MARKET, BY PRODUCT, 2021-2031 ($MILLION)
    TABLE 37. FRANCE ALPHA OLEFIN MARKET, BY APPLICATION, 2021-2031 ($MILLION)
    TABLE 38. SPAIN ALPHA OLEFIN MARKET, BY PRODUCT, 2021-2031 ($MILLION)
    TABLE 39. SPAIN ALPHA OLEFIN MARKET, BY APPLICATION, 2021-2031 ($MILLION)
    TABLE 40. ITALY ALPHA OLEFIN MARKET, BY PRODUCT, 2021-2031 ($MILLION)
    TABLE 41. ITALY ALPHA OLEFIN MARKET, BY APPLICATION, 2021-2031 ($MILLION)
    TABLE 42. REST OF EUROPE ALPHA OLEFIN MARKET, BY PRODUCT, 2021-2031 ($MILLION)
    TABLE 43. REST OF EUROPE ALPHA OLEFIN MARKET, BY APPLICATION, 2021-2031 ($MILLION)
    TABLE 44. ASIA-PACIFIC ALPHA OLEFIN MARKET, BY PRODUCT, 2021-2031 ($MILLION)
    TABLE 45. ASIA-PACIFIC ALPHA OLEFIN MARKET, BY APPLICATION, 2021-2031 ($MILLION)
    TABLE 46. ASIA-PACIFIC ALPHA OLEFIN MARKET, BY COUNTRY, 2021-2031 ($MILLION)
    TABLE 47. CHINA ALPHA OLEFIN MARKET, BY PRODUCT, 2021-2031 ($MILLION)
    TABLE 48. CHINA ALPHA OLEFIN MARKET, BY APPLICATION, 2021-2031 ($MILLION)
    TABLE 49. JAPAN ALPHA OLEFIN MARKET, BY PRODUCT, 2021-2031 ($MILLION)
    TABLE 50. JAPAN ALPHA OLEFIN MARKET, BY APPLICATION, 2021-2031 ($MILLION)
    TABLE 51. INDIA ALPHA OLEFIN MARKET, BY PRODUCT, 2021-2031 ($MILLION)
    TABLE 52. INDIA ALPHA OLEFIN MARKET, BY APPLICATION, 2021-2031 ($MILLION)
    TABLE 53. SOUTH KOREA ALPHA OLEFIN MARKET, BY PRODUCT, 2021-2031 ($MILLION)
    TABLE 54. SOUTH KOREA ALPHA OLEFIN MARKET, BY APPLICATION, 2021-2031 ($MILLION)
    TABLE 55. AUSTRALIA ALPHA OLEFIN MARKET, BY PRODUCT, 2021-2031 ($MILLION)
    TABLE 56. AUSTRALIA ALPHA OLEFIN MARKET, BY APPLICATION, 2021-2031 ($MILLION)
    TABLE 57. REST OF ASIA-PACIFIC ALPHA OLEFIN MARKET, BY PRODUCT, 2021-2031 ($MILLION)
    TABLE 58. REST OF ASIA-PACIFIC ALPHA OLEFIN MARKET, BY APPLICATION, 2021-2031 ($MILLION)
    TABLE 59. LAMEA ALPHA OLEFIN MARKET, BY PRODUCT, 2021-2031 ($MILLION)
    TABLE 60. LAMEA ALPHA OLEFIN MARKET, BY APPLICATION, 2021-2031 ($MILLION)
    TABLE 61. LAMEA ALPHA OLEFIN MARKET, BY COUNTRY, 2021-2031 ($MILLION)
    TABLE 62. BRAZIL ALPHA OLEFIN MARKET, BY PRODUCT, 2021-2031 ($MILLION)
    TABLE 63. BRAZIL ALPHA OLEFIN MARKET, BY APPLICATION, 2021-2031 ($MILLION)
    TABLE 64. SAUDI ARABIA ALPHA OLEFIN MARKET, BY PRODUCT, 2021-2031 ($MILLION)
    TABLE 65. SAUDI ARABIA ALPHA OLEFIN MARKET, BY APPLICATION, 2021-2031 ($MILLION)
    TABLE 66. UAE ALPHA OLEFIN MARKET, BY PRODUCT, 2021-2031 ($MILLION)
    TABLE 67. UAE ALPHA OLEFIN MARKET, BY APPLICATION, 2021-2031 ($MILLION)
    TABLE 68. SOUTH AFRICA ALPHA OLEFIN MARKET, BY PRODUCT, 2021-2031 ($MILLION)
    TABLE 69. SOUTH AFRICA ALPHA OLEFIN MARKET, BY APPLICATION, 2021-2031 ($MILLION)
    TABLE 70. REST OF LAMEA ALPHA OLEFIN MARKET, BY PRODUCT, 2021-2031 ($MILLION)
    TABLE 71. REST OF LAMEA ALPHA OLEFIN MARKET, BY APPLICATION, 2021-2031 ($MILLION)
    TABLE 72.CHEVRON PHILLIPS CHEMICAL COMPANY LLC: COMPANY SNAPSHOT
    TABLE 73.CHEVRON PHILLIPS CHEMICAL COMPANY LLC: OPERATING SEGMENTS
    TABLE 74.CHEVRON PHILLIPS CHEMICAL COMPANY LLC: PRODUCT PORTFOLIO
    TABLE 75.CHEVRON PHILLIPS CHEMICAL COMPANY LLC: NET SALES,
    TABLE 76.CHEVRON PHILLIPS CHEMICAL COMPANY LLC: KEY STRATERGIES
    TABLE 77.EXXON MOBIL CORPORATION: COMPANY SNAPSHOT
    TABLE 78.EXXON MOBIL CORPORATION: OPERATING SEGMENTS
    TABLE 79.EXXON MOBIL CORPORATION: PRODUCT PORTFOLIO
    TABLE 80.EXXON MOBIL CORPORATION: NET SALES,
    TABLE 81.EXXON MOBIL CORPORATION: KEY STRATERGIES
    TABLE 82.EVONIK INDUSTRIES AG: COMPANY SNAPSHOT
    TABLE 83.EVONIK INDUSTRIES AG: OPERATING SEGMENTS
    TABLE 84.EVONIK INDUSTRIES AG: PRODUCT PORTFOLIO
    TABLE 85.EVONIK INDUSTRIES AG: NET SALES,
    TABLE 86.EVONIK INDUSTRIES AG: KEY STRATERGIES
    TABLE 87.IDEMITSU KOSAN CO., LTD: COMPANY SNAPSHOT
    TABLE 88.IDEMITSU KOSAN CO., LTD: OPERATING SEGMENTS
    TABLE 89.IDEMITSU KOSAN CO., LTD: PRODUCT PORTFOLIO
    TABLE 90.IDEMITSU KOSAN CO., LTD: NET SALES,
    TABLE 91.IDEMITSU KOSAN CO., LTD: KEY STRATERGIES
    TABLE 92.INEOS, LANXESS: COMPANY SNAPSHOT
    TABLE 93.INEOS, LANXESS: OPERATING SEGMENTS
    TABLE 94.INEOS, LANXESS: PRODUCT PORTFOLIO
    TABLE 95.INEOS, LANXESS: NET SALES,
    TABLE 96.INEOS, LANXESS: KEY STRATERGIES
    TABLE 97.QATAR CHEMICAL COMPANY LTD: COMPANY SNAPSHOT
    TABLE 98.QATAR CHEMICAL COMPANY LTD: OPERATING SEGMENTS
    TABLE 99.QATAR CHEMICAL COMPANY LTD: PRODUCT PORTFOLIO
    TABLE 100.QATAR CHEMICAL COMPANY LTD: NET SALES,
    TABLE 101.QATAR CHEMICAL COMPANY LTD: KEY STRATERGIES
    TABLE 102.SABIC: COMPANY SNAPSHOT
    TABLE 103.SABIC: OPERATING SEGMENTS
    TABLE 104.SABIC: PRODUCT PORTFOLIO
    TABLE 105.SABIC: NET SALES,
    TABLE 106.SABIC: KEY STRATERGIES
  • LIST OF FIGURES

  • FIGURE 1.ALPHA OLEFIN MARKET SEGMENTATION
    FIGURE 2.ALPHA OLEFIN MARKET,2021-2031
    FIGURE 3.ALPHA OLEFIN MARKET,2021-2031
    FIGURE 4. TOP INVESTMENT POCKETS, BY REGION
    FIGURE 5.PORTER FIVE-1
    FIGURE 6.PORTER FIVE-2
    FIGURE 7.PORTER FIVE-3
    FIGURE 8.PORTER FIVE-4
    FIGURE 9.PORTER FIVE-5
    FIGURE 10.TOP PLAYER POSITIONING
    FIGURE 11.ALPHA OLEFIN MARKET:DRIVERS, RESTRAINTS AND OPPORTUNITIES
    FIGURE 12.VALUE CHAIN ANALYSIS
    FIGURE 13.MARKET SHARE ANALYSIS
    FIGURE 14.REGULATORY GUIDELINES
    FIGURE 15.KEY REGULATION ANALYSIS
    FIGURE 16.PATENT ANALYSIS BY COMPANY
    FIGURE 17.PATENT ANALYSIS BY COUNTRY
    FIGURE 18.ALPHA OLEFIN MARKET,BY PRODUCT,2021(%)
    FIGURE 19.COMPARATIVE SHARE ANALYSIS OF 1-OCTENE ALPHA OLEFIN MARKET,2021-2031(%)
    FIGURE 20.COMPARATIVE SHARE ANALYSIS OF 1-HEXENE ALPHA OLEFIN MARKET,2021-2031(%)
    FIGURE 21.COMPARATIVE SHARE ANALYSIS OF 1-BUTENE ALPHA OLEFIN MARKET,2021-2031(%)
    FIGURE 22.COMPARATIVE SHARE ANALYSIS OF OTHERS ALPHA OLEFIN MARKET,2021-2031(%)
    FIGURE 23.ALPHA OLEFIN MARKET,BY APPLICATION,2021(%)
    FIGURE 24.COMPARATIVE SHARE ANALYSIS OF SYNTHETIC LUBRICANTS ALPHA OLEFIN MARKET,2021-2031(%)
    FIGURE 25.COMPARATIVE SHARE ANALYSIS OF DETERGENT ALCOHOL ALPHA OLEFIN MARKET,2021-2031(%)
    FIGURE 26.COMPARATIVE SHARE ANALYSIS OF POLYETHYLENE ALPHA OLEFIN MARKET,2021-2031(%)
    FIGURE 27.COMPARATIVE SHARE ANALYSIS OF OTHERS ALPHA OLEFIN MARKET,2021-2031(%)
    FIGURE 28.ALPHA OLEFIN MARKET BY REGION,2021
    FIGURE 29.U.S. ALPHA OLEFIN MARKET,2021-2031($MILLION)
    FIGURE 30.CANADA ALPHA OLEFIN MARKET,2021-2031($MILLION)
    FIGURE 31.MEXICO ALPHA OLEFIN MARKET,2021-2031($MILLION)
    FIGURE 32.GERMANY ALPHA OLEFIN MARKET,2021-2031($MILLION)
    FIGURE 33.UK ALPHA OLEFIN MARKET,2021-2031($MILLION)
    FIGURE 34.FRANCE ALPHA OLEFIN MARKET,2021-2031($MILLION)
    FIGURE 35.SPAIN ALPHA OLEFIN MARKET,2021-2031($MILLION)
    FIGURE 36.ITALY ALPHA OLEFIN MARKET,2021-2031($MILLION)
    FIGURE 37.REST OF EUROPE ALPHA OLEFIN MARKET,2021-2031($MILLION)
    FIGURE 38.CHINA ALPHA OLEFIN MARKET,2021-2031($MILLION)
    FIGURE 39.JAPAN ALPHA OLEFIN MARKET,2021-2031($MILLION)
    FIGURE 40.INDIA ALPHA OLEFIN MARKET,2021-2031($MILLION)
    FIGURE 41.SOUTH KOREA ALPHA OLEFIN MARKET,2021-2031($MILLION)
    FIGURE 42.AUSTRALIA ALPHA OLEFIN MARKET,2021-2031($MILLION)
    FIGURE 43.REST OF ASIA-PACIFIC ALPHA OLEFIN MARKET,2021-2031($MILLION)
    FIGURE 44.BRAZIL ALPHA OLEFIN MARKET,2021-2031($MILLION)
    FIGURE 45.SAUDI ARABIA ALPHA OLEFIN MARKET,2021-2031($MILLION)
    FIGURE 46.UAE ALPHA OLEFIN MARKET,2021-2031($MILLION)
    FIGURE 47.SOUTH AFRICA ALPHA OLEFIN MARKET,2021-2031($MILLION)
    FIGURE 48.REST OF LAMEA ALPHA OLEFIN MARKET,2021-2031($MILLION)
    FIGURE 49. TOP WINNING STRATEGIES, BY YEAR
    FIGURE 50. TOP WINNING STRATEGIES, BY DEVELOPMENT
    FIGURE 51. TOP WINNING STRATEGIES, BY COMPANY
    FIGURE 52.PRODUCT MAPPING OF TOP 10 PLAYERS
    FIGURE 53.COMPETITIVE DASHBOARD
    FIGURE 54.COMPETITIVE HEATMAP OF TOP 10 KEY PLAYERS
    FIGURE 55.CHEVRON PHILLIPS CHEMICAL COMPANY LLC.: NET SALES ,($MILLION)
    FIGURE 56.EXXON MOBIL CORPORATION.: NET SALES ,($MILLION)
    FIGURE 57.EVONIK INDUSTRIES AG.: NET SALES ,($MILLION)
    FIGURE 58.IDEMITSU KOSAN CO., LTD.: NET SALES ,($MILLION)
    FIGURE 59.INEOS, LANXESS.: NET SALES ,($MILLION)
    FIGURE 60.QATAR CHEMICAL COMPANY LTD.: NET SALES ,($MILLION)
    FIGURE 61.SABIC.: NET SALES ,($MILLION)


An increase in demand for polyethylene is the key factor that is projected to drive the growth of the global alpha olefins market during the forecast period. In addition, increase in demand for alpha olefins in the automotive sector for various uses such as surfactants, lubricants, and oil chemicals is expected to drive the growth of the market during the forecast period. However, high initial investments and environmental concerns associated with alpha olefins are the key factors expected to hamper the market growth. The rapid increase in the extraction of crude oil and natural gas, rise in demand for synthetic lubricants for automobiles, and increase in investments in R&D of synthetic polymers are all factors expected to contribute to the alpha olefins market growth in the upcoming years.

Among the analyzed regions, North America is expected to account for the highest revenue in the market by 2031, followed by Asia-Pacific, Europe, and LAMEA. Rapid industrialization and urbanization are the key factors responsible for the leading position of North America and Asia-Pacific in the global alpha olefins market.

PURCHASE OPTIONS

Call or Email us

U.S.-Canada Toll-free: +1-800-792-5285
Int'l : +1-503-894-6022
Europe : +44-845-528-1300
Email : help@alliedmarketresearch.com
 
FREQUENTLY ASKED QUESTIONS?

A. The alpha olefin market is being driven by an increase in demand from end-use industries including plastic and automotive. For instance, polyethylene is manufactured using alpha olefin. Therefore, the increase in usage of polyethylene in the plastic industry is likely to drive the market for alpha olefin.

A. The increase in usage of polyethylene and rising demand for alpha olefin in the automotive sector are estimated to be the most important driving factors in the alpha olefin market.

A. The major growth strategies adopted by the alpha olefin market players are investment and agreement.

A. Asia-Pacific will provide more business opportunities for the global alpha olefin market in the future.

A. The polyethylene sub-segment of the application acquired the maximum share of the global alpha olefin market in 2021.

A. Qatar Chemical Company Ltd (Q-chem)., Chevron Phillips Chemical Company LLC, Mitsubishi Chemical Corp, Exxon Mobil Corporation, INEOS Oligomers, Petrochemicals Sdn. Bhd, Royal Dutch Shell, Evonik Industries, and JAM Petrochemicals Company are the major players in the alpha olefin market.

Looking for Customization?

 Customization Request

Have a Question?

 Speak with Analyst

Any Confusion?

 Inquire Before Buying

Have a glance of the Report

  Request Sample
RELATED TAGS

Purchase Full Report of
Alpha Olefin Market

Start reading instantly.
This Report and over 66,983+ more Reports, Available with Avenue Library. T&C*.

  • Online Only
  • $3,570
  • Online cloud access only
  • Restricted print, copy, paste & download
  • Read only
  • Free industry update
    (Within 180 days)
  • Free report update in next update cycle
    (Oct 2023 - Oct 2024)
  • Data Pack
  • $3,840
  • Restricted to one authorized user
  • One print only
  • Available in
    Excel
  • Free industry update
    (Within 180 days)
  •   Free report update in next update cycle
    (Oct 2023 - Oct 2024)
  • Single User
  • $5,730
  • Restricted to one authorized user
  • One print only
  • Available in
    PDF
  • Free industry update
    (Within 180 days)
  •   Free report update in next update cycle
    (Oct 2023 - Oct 2024)
  • Five Users
  • $6,450
  • Limited to five authorized users
  • Print upto five copies
  • Available in
    PDF
  • Free industry update
    (Within 180 days)
  •   Free report update in next update cycle
    (Oct 2023 - Oct 2024)
  • Enterprise
    License/PDF

  • $9,600
  • Unlimited
    within
    company/enterprise
  • Available in Excel & PDF
  • Free industry update
    (Within 180 days)
  •   Free report update in next update cycle
    (Oct 2023 - Oct 2024)
  • Library
    Membership

  • $999 $ 1,175
    Per User/ Per month/ Billed annually
  • Published Content
    E-access
  • Company Profiles
    E-access
  • Newly Added Content Access
  • 10 PDF
    Downloads
  • 5 Excel Data
    Pack Downloads
  • 250 Company Profiles PDF Downloads
  • Buy Now

*Taxes/Fees, if applicable will be added during checkout. All prices in USD

RELATED REPORTS
 

Why Allied Market Research?


Infallible Methodology

To ensure high-level data integrity, accurate analysis, and impeccable forecasts

Analyst Support

For complete satisfaction

Customization

On-demand customization of scope of the report to exactly meet your needs

TARGETED MARKET VIEW

Targeted market view to provide pertinent information and save time of readers

Get fresh content delivered

Get insights on topics that are crucial for your business. Stay abreast of your interest areas.

Get Industry Data Alerts

Why Allied Market Research?

Infallible Methodology

To ensure high-level data integrity, accurate analysis, and impeccable forecasts

Analyst Support

For complete satisfaction

Customization

On-demand customization of scope of the report to exactly meet your needs

TARGETED MARKET VIEW

Targeted market view to provide pertinent information and save time of readers