
Aluminum Composite Panels Market Research, 2033
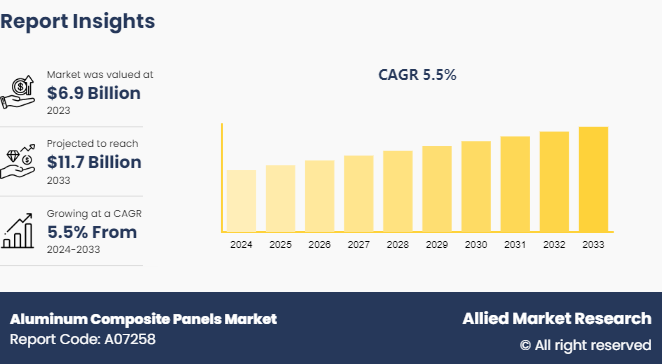
The global aluminum composite panels market size was valued at $6.9 billion in 2023, and is projected to reach $11.7 billion by 2033, growing at a CAGR of 5.5% from 2024 to 2033.
Market Introduction and Definition
Aluminum composite panels (ACPs) are a versatile and widely used construction material composed of two thin layers of aluminum enclosing a non-aluminum core, typically made of polyethylene or mineral-filled material. These panels combine the lightweight properties of aluminum with the strength and rigidity provided by the core, resulting in a material that is both durable and easy to work with. The use of aluminum ensures that ACPs are resistant to corrosion that makes them suitable for exterior applications where they are exposed to the elements. In addition, the smooth surface of aluminum allows for a variety of finishes such as paint, anodizing, and even digital printing, making ACPs an aesthetically flexible option for architects and designers.
Key Takeaways
- The aluminum composite panels market study covers 20 countries. The research includes a segment analysis of each country in terms of value for the projected period.
- More than 1,500 product literatures, industry releases, annual reports, and other such documents of major aluminum composite panel participants along with authentic industry journals, trade associations' releases, and government websites have been reviewed for generating high-value industry insights.
- The study integrated high-quality data, professional opinions and analysis, and critical independent perspectives. The research approach is intended to provide a balanced view of global markets and to assist stakeholders in making educated decisions to achieve their most ambitious growth objectives.
Key Market Dynamics
The lightweight nature of ACPs makes them ideal for use in high-rise buildings and other structures where reducing the overall weight is crucial. This characteristic simplifies the construction process and minimizes the load on the building's foundation and structural framework, potentially resulting in cost savings and increased efficiency during construction. As cities expand and populations increase, there is a greater need for new buildings and infrastructure to accommodate residential, commercial, and industrial activities. ACPs offer several advantages that make them an attractive choice for construction projects in urban areas. All these factors are expected to drive the demand for the aluminum composite panels market during the forecast period.

However, fluctuations in raw material prices have been a significant challenge for the growth of the aluminum composite panels (ACPs) industry. The primary components of ACPs are aluminum sheets and the core material, typically made of polyethylene or mineral-filled substances. The prices of these raw materials are subject to market dynamics, including changes in supply and demand, geopolitical factors, and currency fluctuations. As a result, the cost of manufacturing ACPs are unpredictable and prone to sudden spikes or declines, impacting the profitability and competitiveness of manufacturers. All these factors hamper the growth of the aluminum composite panels market.
Advancements in surface finishes and coating technologies have greatly improved the aesthetic flexibility of ACPs. New coating techniques allow for a wider range of colors, textures, and patterns, including metallic, matte, and high-gloss finishes, as well as custom digital printing. These innovations enable designers to achieve more creative and visually striking facades that help buildings to stand out in competitive urban environments. The improved durability of these coatings also ensures that the panels maintain their appearance over time, even in harsh environmental conditions. All these factors are anticipated to offer new growth opportunities for the global aluminum composite panels market during the forecast period.
Patent Analysis of Global Aluminum Composite Panels Market
The U.S. is the leading innovator in the field of aluminum composite panels, holding the 52.3% of patents. This dominant share underscores the U.S.'s leadership in the development and advancement of ACP technologies. The high percentage indicates a robust ecosystem of research and development, supported by substantial investments from both the private sector and academic institutions. The European Union, with 11.5% of the patents, and other developed regions such as Canada (8.6%) and Australia (5.3%) , also show significant contributions to ACP technology. Europe's involvement reflects its strong emphasis on innovation and sustainable building materials, driven by stringent environmental regulations and a market demand for energy-efficient construction solutions. Similarly, Canada's and Australia's shares indicate active participation in the global ACP market, likely driven by their own construction needs and innovation policies. The recently filed patent is related to the aluminum composite panel containing aerogel and method for manufacturing, aluminum composite panel installation by hanging rain screen system, aluminum composite panel installation by male female rain screen system, and continuous manufacturing system for composite aluminum panels.

Market Segmentation
The aluminum composite panels market is segmented into coating type, application, and region. By coating type, the market is divided into polyvinylidene fluoride (PVDF) , polyester (PE) , and others. By application, the market is categorized building and construction, transportation, advertising and signage, and others. Region-wise the market is analyzed across North America, Europe, Asia-Pacific, and LAMEA.
Regional Market Outlook
Countries in the Asia-Pacific region continue to urbanize that create need for modern, efficient, and aesthetically pleasing building materials. ACPs, with their versatility, durability, and aesthetic appeal, are ideally suited to meet these needs. Major cities in countries such as China, India, and Southeast Asian nations are witnessing a construction boom, encompassing residential, commercial, and industrial projects, all of which contribute to the growing demand for ACPs. Furthermore, government initiatives and policies aimed at improving infrastructure are also significant driving factors for the ACP market in the Asia-Pacific region. Numerous countries have launched ambitious programs to upgrade their infrastructure, including transportation systems, public buildings, and housing. For instance, China’s Belt and Road Initiative and India’s Smart Cities Mission are major undertakings that necessitate vast amounts of construction materials, including ACPs. These government-led projects often emphasize the use of durable, cost-effective, and sustainable materials, which aligns well with the properties of ACPs.
- The construction industry in India is expected to reach $1.4 trillion by 2025. An estimated 600 million people are likely to be living in urban centers by 2030.
- India is expected to enhance its infrastructure to reach its 2025 economic growth target of $5 trillion. Budget 2023-24 is complemented with the continuation of the 50-year interest-free loan to state governments for one more year to spur investment in infrastructure and to incentivize them for complementary policy actions, with a significantly enhanced outlay of $16 billion.
- China’s 14th five-year plan emphasizes new infrastructure projects in transportation, energy, water systems, and new urbanization. According to the International Trade Administration, overall investment in new infrastructure during the 14th five-year plan period (2021-2025) is expected to reach $4.2 trillion.
Competitive Landscape
The major players operating in the aluminum composite panels market include Aludecor, Aldeko Panels Private Limited, 3A Composites, Mitsubishi Chemical Group Corporation, Arconic, Jyi Shyang Industrial Co., Ltd., ALUBOND U.S.A., EuramaxLab, Jiangsu Yaret Technology Industrial Park Co., Ltd, and Taizhou Kingertai Decoration Material Co., Ltd.
Industry Trends
- The demand for fire-resistant ACPs is on the rise due to stringent building safety regulations globally. These panels provide enhanced safety for high-rise buildings and other structures
- Increasing use of lightweight materials in the automotive and transportation sectors is another critical factor. ACPs help reduce vehicle weight, improving fuel efficiency and reducing emissions?
- According to the Internation Energy Agency (IEA) , electric car sales in 2023 were 3.5 million higher than in 2022, a 35% year-on-year increase. This is more than six times higher than in 2018. In 2023, there were over 250, 000 new registrations per week, which is more than the annual total in 2013.
- According to the report of the Aluminum Institute of America, for every 1kg of aluminum used in a car, a weight reduction effect of 2.2kg is obtained, and the exhaust emission is reduced by 20kg during the use period.
Major Plans of India Infrastructure
Roads: The Bharatmala Pariyojana is progressing with Phase I focusing on developing 34, 800 km of National Highways. It emphasizes corridor-based development and is set to conclude by 2027-2028, covering 31 States/UTs and over 550 districts. In addition, the government targets building 22 new greenfield expressways, signaling significant advancements in India's transportation infrastructure.
Railways: India's railway sector is undertaking ambitious projects such as the Mumbai-Ahmedabad Speed Rail Corridor, the world's highest pier bridge under construction, and the Chenab bridge in Jammu & Kashmir - the world's highest railway bridge.
Ports: The Union Minister for Ports, Shipping and Waterways said that the country’s total port capacity is expected to increase from the existing 2, 600 MTPA (Million Tons per annum) to more than 10, 000 MTPA in 2047.
Key Sources Referred
- World Intellectual Property Organization
- International Trade Administration
- Internation Energy Agency (IEA)
- Invest India
- World Bank
- The Aluminum Association
- International Aluminum Institute
- India Brand Equity Foundation
- European Aluminum
- Aluminum Association of India
Key Benefits for Stakeholders
- This report provides a quantitative analysis of the market segments, current trends, estimations, and dynamics of the aluminum composite panels market analysis from 2024 to 2033 to identify the prevailing aluminum composite panels market opportunities.
- The market research is offered along with information related to key drivers, restraints, and opportunities.
- Porter's five forces analysis highlights the potency of buyers and suppliers to enable stakeholders make profit-oriented business decisions and strengthen their supplier-buyer network.
- In-depth analysis of the aluminum composite panels market segmentation assists to determine the prevailing market opportunities.
- Major countries in each region are mapped according to their revenue contribution to the global market.
- Market player positioning facilitates benchmarking and provides a clear understanding of the present position of the market players.
- The report includes the analysis of the regional as well as global aluminum composite panels market trends, key players, market segments, application areas, and market growth strategies.
Aluminum Composite Panels Market Report Highlights
| Aspects | Details |
| Market Size By 2033 | USD 11.7 Billion |
| Growth Rate | CAGR of 5.5% |
| Forecast period | 2024 - 2033 |
| Report Pages | 420 |
| By Coating Type |
|
| By Application |
|
| By Region |
|
| Key Market Players | Jyi Shyang Industrial Co., Ltd., Aludecor, Arconic, Aldeko Panels Private Limited, 3A Composites, Jiangsu Yaret Technology Industrial Park Co., Ltd, EuramaxLab, Mitsubishi Chemical Group Corporation, Taizhou Kingertai Decoration Material Co., Ltd., ALUBOND U.S.A. |
The global aluminum composite panels market was valued at $6.9 billion in 2023, and is projected to reach $11.7 billion by 2033, growing at a CAGR of 5.5% from 2024 to 2033.
Asia-Pacific is the largest regional market for Aluminum Composite Panels.
Building and construction is the leading application of Aluminum Composite Panels Market.
Advancements in ACP technology and materials are the upcoming trends of Aluminum Composite Panels Market in the globe.
The major players operating in the aluminum composite panels market include Aludecor, Aldeko Panels Private Limited, 3A Composites, Mitsubishi Chemical Group Corporation, Arconic, Jyi Shyang Industrial Co., Ltd., ALUBOND U.S.A., EuramaxLab, Jiangsu Yaret Technology Industrial Park Co., Ltd, and Taizhou Kingertai Decoration Material Co., Ltd.
Loading Table Of Content...

