0
Upcoming Allied Market Research
2023
Aluminum Scrap Recycling Market

Aluminum Scrap Recycling Market: Global Opportunity Analysis and Industry Forecast, 2020 - 2027 Market

Report Code: A07387
Nov 2023 | Pages: NA
Tables: NA
Charts: NA
  • Formats*:

  • pdf

    Single User License, Five User
    License & Enterprise User License

  • xls

    Data Pack Excel License

  • ppt

    It comes with the additional cost
    of $2500.00 contact sales.


COVID-19

Pandemic disrupted the entire world and affected many industries.

Get detailed COVID-19 impact analysis on the Aluminum Scrap Recycling Market

Request Now !

Aluminum Scrap Recycling Market Analysis

Aluminum scrap recycling is the process of recycling scrap aluminum to reuse it in other potential applications. Recycling of aluminum scrap is done by the process of melting, sorting, purifying, and solidifying of aluminum scrap. Aluminum is the world’s second most available resource after silicon, and is being used commercially for over a century. It is light in weight and has other properties such as malleability and ductility. Moreover, it also provides high corrosion resistance property and is used as an essential element in almost all industries across the globe. Aluminum is widely used in applications, including railcars, marine vessels, airplanes, trucks, consumer durables, machinery, and packaging.

COVID–19 scenario analysis

The coronavirus pandemic has affected various industries such as food & beverages, construction, automotive, packing, consumer products, and others. The worldwide lockdown has reduced the overall demand for these industries as people have been quarantined. Governments have been forced to shut down operations in industries to prevent further spread of the virus. The lack of workers in industries has also troubled the production process. Similarly, supply chain disruptions across countries have further reduced the demand for various products. As aluminum is widely used across various industries, its demand is expected to reduce due to shut down and low demand from customers.

Market scenario analysis

Increased use of aluminum in the automobile industry and rise in adoption of aluminum recycling practices are the major factors that are expected to propel the market growth. The demolition of buildings is the main source of aluminum scraps for recycling companies. Rise in demand for steel coupled with urbanization & industrialization in emerging economies is also predicted to fuel the market growth over the forecast period. Moreover, rise in environmental concerns of depletion of natural resources at a faster rate has forced governments to encourage the aluminum recycling industry, thereby further boosting the aluminum recycling market. High cost and environmental impacts of mining aluminum have increased the use of recycled alumina in the building & construction industry. Therefore, fluctuation in steel prices may hinder the market growth. However, increase in demand for alumina to make commercial products and rise in industrialization are expected to boost the market growth over the forecast period.

Market trends

Technological advancement in the aluminum scrap recycling industry has introduced laser induced breakdown spectroscopy (LIBS) and solid-state recycling. This is the recent trend observed, which contributes to the growth of the aluminum scrap recycling market. LIBS consist of a high-powered laser, which can identify impurities regardless of their physical state. The solid-state recycling works by crushing recyclable aluminum parts and cleaning them to ease the aluminum recycling process.

Regional insights

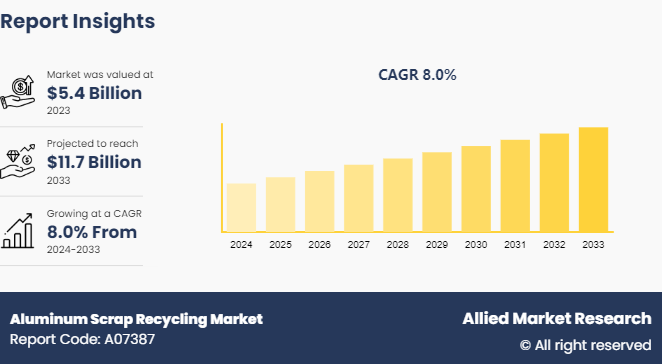
The global aluminum scrap recycling market is segmented into various regions such as North America, Latin America, Europe, the Middle East & Africa, and Asia-Pacific. Asia-Pacific is the market leader of the aluminum scrap recycling market. China and India are the fastest-growing consumer markets in this region, and are also the major contributors to the market growth in the region. The increase in consumption of consumer durables and development in the construction & building sector further boost the market growth in the region.

Key benefits of the report:

  • This study presents the analytical depiction of the aluminum scrap recycling market along with the current trends and future estimations to determine the imminent investment pockets.
  • The report presents information related to key drivers, restraints, and opportunities along with detailed analysis of the aluminum scrap recycling market share.
  • The current market is quantitatively analyzed to highlight the aluminum scrap recycling market growth scenario.
  • Porter’s five forces analysis illustrates the potency of buyers & suppliers in the market. 
  • The report provides a detailed analysis based on competitive intensity and how the competition will take shape in coming years. 

Questions answered in the aluminum scrap recycling market research report:

  • Which are the leading market players active in the market?
  • What are the current trends that will influence the market in the next few years?
  • What are the driving factors, restraints, and opportunities of the market?
  • What are the projections for the future that would help in taking further strategic steps?

Aluminum Scrap Recycling Market: Global Opportunity Analysis and Industry Forecast, 2020 - 2027 Report Highlights

Aspects Details
By Scrap Type
  • Old Scrap
  • New Scrap
By Product
  • Aluminum Foil Scrap
  • Aluminum Ingot Scrap
  • Others
By End-use Sector
  • Building & Construction
  • Automotive
  • Electronics
  • Machinery & Equipment Packaging
  • Consumer Appliances
  • Others (Home & Industrial Furniture, Aerospace, and Residential & Commercial Utensils & Containers)
By Region
  • North America  (US, Canada)
  • Europe  (Germany, UK, France, rest of Europe)
  • Asia-Pacific  (China, Japan, India, rest of Asia-Pacific)
  • Latin America  (Brazil, Mexico, rest of LATAM)
  • the Middle East 
  • Africa 
Key Market Players REAL ALLOY, Nucor Corporation, Sims Metal Management, ArcelorMittal S.A., European Metal Recycling, Norton Aluminium Ltd., Aurubis AG, DOWA HOLDINGS Co., Ltd., Kuusakoski Recycling, Novelis Inc., Tom Martin & Co. Ltd., Commercial Metals Company
 
  • CHAPTER 1: INTRODUCTION

    • 1.1. Report Description

    • 1.2. Key Market Segments

    • 1.3. Key Benefits

    • 1.4. Research Methodology

      • 1.4.1. Primary Research

      • 1.4.2. Secondary Research

      • 1.4.3. Analyst Tools and Models

  • CHAPTER 2: EXECUTIVE SUMMARY

    • 2.1. CXO Perspective

  • CHAPTER 3: MARKET LANDSCAPE

    • 3.1. Market Definition and Scope

    • 3.2. Key Findings

      • 3.2.1. Top Investment Pockets

      • 3.2.2. Top Winning Strategies

    • 3.3. Porter's Five Forces Analysis

      • 3.3.1. Bargaining Power of Suppliers

      • 3.3.2. Threat of New Entrants

      • 3.3.3. Threat of Substitutes

      • 3.3.4. Competitive Rivalry

      • 3.3.5. Bargaining Power among Buyers

    • 3.5. Market Dynamics

      • 3.5.1. Drivers

      • 3.5.2. Restraints

      • 3.5.3. Opportunities

    • 3.6. COVID-19 Impact Analysis

  • CHAPTER 4: ALUMINUM SCRAP RECYCLING MARKET, BY SCRAP TYPE

    • 4.1. Market Overview

      • 4.1.1 Market Size and Forecast, By Scrap Type

    • 4.2. Old Scrap

      • 4.2.1. Key Market Trends, Growth Factors and Opportunities

      • 4.2.2. Market Size and Forecast, By Region

      • 4.2.3. Market Share Analysis, By Country

    • 4.3. New Scrap

      • 4.3.1. Key Market Trends, Growth Factors and Opportunities

      • 4.3.2. Market Size and Forecast, By Region

      • 4.3.3. Market Share Analysis, By Country

  • CHAPTER 5: ALUMINUM SCRAP RECYCLING MARKET, BY PRODUCT

    • 5.1. Market Overview

      • 5.1.1 Market Size and Forecast, By Product

    • 5.2. Aluminum Foil Scrap

      • 5.2.1. Key Market Trends, Growth Factors and Opportunities

      • 5.2.2. Market Size and Forecast, By Region

      • 5.2.3. Market Share Analysis, By Country

    • 5.3. Aluminum Ingot Scrap

      • 5.3.1. Key Market Trends, Growth Factors and Opportunities

      • 5.3.2. Market Size and Forecast, By Region

      • 5.3.3. Market Share Analysis, By Country

    • 5.4. Others

      • 5.4.1. Key Market Trends, Growth Factors and Opportunities

      • 5.4.2. Market Size and Forecast, By Region

      • 5.4.3. Market Share Analysis, By Country

  • CHAPTER 6: ALUMINUM SCRAP RECYCLING MARKET, BY END-USE SECTOR

    • 6.1. Market Overview

      • 6.1.1 Market Size and Forecast, By End-use Sector

    • 6.2. Building Construction

      • 6.2.1. Key Market Trends, Growth Factors and Opportunities

      • 6.2.2. Market Size and Forecast, By Region

      • 6.2.3. Market Share Analysis, By Country

    • 6.3. Automotive

      • 6.3.1. Key Market Trends, Growth Factors and Opportunities

      • 6.3.2. Market Size and Forecast, By Region

      • 6.3.3. Market Share Analysis, By Country

    • 6.4. Electronics

      • 6.4.1. Key Market Trends, Growth Factors and Opportunities

      • 6.4.2. Market Size and Forecast, By Region

      • 6.4.3. Market Share Analysis, By Country

    • 6.5. Machinery Equipment Packaging

      • 6.5.1. Key Market Trends, Growth Factors and Opportunities

      • 6.5.2. Market Size and Forecast, By Region

      • 6.5.3. Market Share Analysis, By Country

    • 6.6. Consumer Appliances

      • 6.6.1. Key Market Trends, Growth Factors and Opportunities

      • 6.6.2. Market Size and Forecast, By Region

      • 6.6.3. Market Share Analysis, By Country

    • 6.7. Others (Home Industrial Furniture, Aerospace, And Residential Commercial Utensils Containers)

      • 6.7.1. Key Market Trends, Growth Factors and Opportunities

      • 6.7.2. Market Size and Forecast, By Region

      • 6.7.3. Market Share Analysis, By Country

  • CHAPTER 7: ALUMINUM SCRAP RECYCLING MARKET, BY REGION

    • 7.1. Market Overview

      • 7.1.1 Market Size and Forecast, By Region

    • 7.2. North America

      • 7.2.1. Key Market Trends and Opportunities

      • 7.2.2. Market Size and Forecast, By Scrap Type

      • 7.2.3. Market Size and Forecast, By Product

      • 7.2.4. Market Size and Forecast, By End-use Sector

      • 7.2.5. Market Size and Forecast, By Country

      • 7.2.6. U.S. Aluminum Scrap Recycling Market

        • 7.2.6.1. Market Size and Forecast, By Scrap Type
        • 7.2.6.2. Market Size and Forecast, By Product
        • 7.2.6.3. Market Size and Forecast, By End-use Sector
      • 7.2.7. Canada Aluminum Scrap Recycling Market

        • 7.2.7.1. Market Size and Forecast, By Scrap Type
        • 7.2.7.2. Market Size and Forecast, By Product
        • 7.2.7.3. Market Size and Forecast, By End-use Sector
      • 7.2.8. Mexico Aluminum Scrap Recycling Market

        • 7.2.8.1. Market Size and Forecast, By Scrap Type
        • 7.2.8.2. Market Size and Forecast, By Product
        • 7.2.8.3. Market Size and Forecast, By End-use Sector
    • 7.3. Europe

      • 7.3.1. Key Market Trends and Opportunities

      • 7.3.2. Market Size and Forecast, By Scrap Type

      • 7.3.3. Market Size and Forecast, By Product

      • 7.3.4. Market Size and Forecast, By End-use Sector

      • 7.3.5. Market Size and Forecast, By Country

      • 7.3.6. France Aluminum Scrap Recycling Market

        • 7.3.6.1. Market Size and Forecast, By Scrap Type
        • 7.3.6.2. Market Size and Forecast, By Product
        • 7.3.6.3. Market Size and Forecast, By End-use Sector
      • 7.3.7. Germany Aluminum Scrap Recycling Market

        • 7.3.7.1. Market Size and Forecast, By Scrap Type
        • 7.3.7.2. Market Size and Forecast, By Product
        • 7.3.7.3. Market Size and Forecast, By End-use Sector
      • 7.3.8. Italy Aluminum Scrap Recycling Market

        • 7.3.8.1. Market Size and Forecast, By Scrap Type
        • 7.3.8.2. Market Size and Forecast, By Product
        • 7.3.8.3. Market Size and Forecast, By End-use Sector
      • 7.3.9. Spain Aluminum Scrap Recycling Market

        • 7.3.9.1. Market Size and Forecast, By Scrap Type
        • 7.3.9.2. Market Size and Forecast, By Product
        • 7.3.9.3. Market Size and Forecast, By End-use Sector
      • 7.3.10. UK Aluminum Scrap Recycling Market

        • 7.3.10.1. Market Size and Forecast, By Scrap Type
        • 7.3.10.2. Market Size and Forecast, By Product
        • 7.3.10.3. Market Size and Forecast, By End-use Sector
      • 7.3.11. Russia Aluminum Scrap Recycling Market

        • 7.3.11.1. Market Size and Forecast, By Scrap Type
        • 7.3.11.2. Market Size and Forecast, By Product
        • 7.3.11.3. Market Size and Forecast, By End-use Sector
      • 7.3.12. Rest Of Europe Aluminum Scrap Recycling Market

        • 7.3.12.1. Market Size and Forecast, By Scrap Type
        • 7.3.12.2. Market Size and Forecast, By Product
        • 7.3.12.3. Market Size and Forecast, By End-use Sector
    • 7.4. Asia-Pacific

      • 7.4.1. Key Market Trends and Opportunities

      • 7.4.2. Market Size and Forecast, By Scrap Type

      • 7.4.3. Market Size and Forecast, By Product

      • 7.4.4. Market Size and Forecast, By End-use Sector

      • 7.4.5. Market Size and Forecast, By Country

      • 7.4.6. China Aluminum Scrap Recycling Market

        • 7.4.6.1. Market Size and Forecast, By Scrap Type
        • 7.4.6.2. Market Size and Forecast, By Product
        • 7.4.6.3. Market Size and Forecast, By End-use Sector
      • 7.4.7. Japan Aluminum Scrap Recycling Market

        • 7.4.7.1. Market Size and Forecast, By Scrap Type
        • 7.4.7.2. Market Size and Forecast, By Product
        • 7.4.7.3. Market Size and Forecast, By End-use Sector
      • 7.4.8. India Aluminum Scrap Recycling Market

        • 7.4.8.1. Market Size and Forecast, By Scrap Type
        • 7.4.8.2. Market Size and Forecast, By Product
        • 7.4.8.3. Market Size and Forecast, By End-use Sector
      • 7.4.9. South Korea Aluminum Scrap Recycling Market

        • 7.4.9.1. Market Size and Forecast, By Scrap Type
        • 7.4.9.2. Market Size and Forecast, By Product
        • 7.4.9.3. Market Size and Forecast, By End-use Sector
      • 7.4.10. Australia Aluminum Scrap Recycling Market

        • 7.4.10.1. Market Size and Forecast, By Scrap Type
        • 7.4.10.2. Market Size and Forecast, By Product
        • 7.4.10.3. Market Size and Forecast, By End-use Sector
      • 7.4.11. Thailand Aluminum Scrap Recycling Market

        • 7.4.11.1. Market Size and Forecast, By Scrap Type
        • 7.4.11.2. Market Size and Forecast, By Product
        • 7.4.11.3. Market Size and Forecast, By End-use Sector
      • 7.4.12. Malaysia Aluminum Scrap Recycling Market

        • 7.4.12.1. Market Size and Forecast, By Scrap Type
        • 7.4.12.2. Market Size and Forecast, By Product
        • 7.4.12.3. Market Size and Forecast, By End-use Sector
      • 7.4.13. Indonesia Aluminum Scrap Recycling Market

        • 7.4.13.1. Market Size and Forecast, By Scrap Type
        • 7.4.13.2. Market Size and Forecast, By Product
        • 7.4.13.3. Market Size and Forecast, By End-use Sector
      • 7.4.14. Rest of Asia Pacific Aluminum Scrap Recycling Market

        • 7.4.14.1. Market Size and Forecast, By Scrap Type
        • 7.4.14.2. Market Size and Forecast, By Product
        • 7.4.14.3. Market Size and Forecast, By End-use Sector
    • 7.5. LAMEA

      • 7.5.1. Key Market Trends and Opportunities

      • 7.5.2. Market Size and Forecast, By Scrap Type

      • 7.5.3. Market Size and Forecast, By Product

      • 7.5.4. Market Size and Forecast, By End-use Sector

      • 7.5.5. Market Size and Forecast, By Country

      • 7.5.6. Brazil Aluminum Scrap Recycling Market

        • 7.5.6.1. Market Size and Forecast, By Scrap Type
        • 7.5.6.2. Market Size and Forecast, By Product
        • 7.5.6.3. Market Size and Forecast, By End-use Sector
      • 7.5.7. South Africa Aluminum Scrap Recycling Market

        • 7.5.7.1. Market Size and Forecast, By Scrap Type
        • 7.5.7.2. Market Size and Forecast, By Product
        • 7.5.7.3. Market Size and Forecast, By End-use Sector
      • 7.5.8. Saudi Arabia Aluminum Scrap Recycling Market

        • 7.5.8.1. Market Size and Forecast, By Scrap Type
        • 7.5.8.2. Market Size and Forecast, By Product
        • 7.5.8.3. Market Size and Forecast, By End-use Sector
      • 7.5.9. UAE Aluminum Scrap Recycling Market

        • 7.5.9.1. Market Size and Forecast, By Scrap Type
        • 7.5.9.2. Market Size and Forecast, By Product
        • 7.5.9.3. Market Size and Forecast, By End-use Sector
      • 7.5.10. Argentina Aluminum Scrap Recycling Market

        • 7.5.10.1. Market Size and Forecast, By Scrap Type
        • 7.5.10.2. Market Size and Forecast, By Product
        • 7.5.10.3. Market Size and Forecast, By End-use Sector
      • 7.5.11. Rest of LAMEA Aluminum Scrap Recycling Market

        • 7.5.11.1. Market Size and Forecast, By Scrap Type
        • 7.5.11.2. Market Size and Forecast, By Product
        • 7.5.11.3. Market Size and Forecast, By End-use Sector
  • CHAPTER 8: COMPETITIVE LANDSCAPE

    • 8.1. Introduction

    • 8.2. Top Winning Strategies

    • 8.3. Product Mapping Of Top 10 Player

    • 8.4. Competitive Dashboard

    • 8.5. Competitive Heatmap

    • 8.6. Top Player Positioning,2022

  • CHAPTER 9: COMPANY PROFILES

    • 9.1. European Metal Recycling

      • 9.1.1. Company Overview

      • 9.1.2. Key Executives

      • 9.1.3. Company Snapshot

      • 9.1.4. Operating Business Segments

      • 9.1.5. Product Portfolio

      • 9.1.6. Business Performance

      • 9.1.7. Key Strategic Moves and Developments

    • 9.2. Novelis Inc.

      • 9.2.1. Company Overview

      • 9.2.2. Key Executives

      • 9.2.3. Company Snapshot

      • 9.2.4. Operating Business Segments

      • 9.2.5. Product Portfolio

      • 9.2.6. Business Performance

      • 9.2.7. Key Strategic Moves and Developments

    • 9.3. Nucor Corporation

      • 9.3.1. Company Overview

      • 9.3.2. Key Executives

      • 9.3.3. Company Snapshot

      • 9.3.4. Operating Business Segments

      • 9.3.5. Product Portfolio

      • 9.3.6. Business Performance

      • 9.3.7. Key Strategic Moves and Developments

    • 9.4. Tom Martin And Co. Ltd.

      • 9.4.1. Company Overview

      • 9.4.2. Key Executives

      • 9.4.3. Company Snapshot

      • 9.4.4. Operating Business Segments

      • 9.4.5. Product Portfolio

      • 9.4.6. Business Performance

      • 9.4.7. Key Strategic Moves and Developments

    • 9.5. Sims Metal Management

      • 9.5.1. Company Overview

      • 9.5.2. Key Executives

      • 9.5.3. Company Snapshot

      • 9.5.4. Operating Business Segments

      • 9.5.5. Product Portfolio

      • 9.5.6. Business Performance

      • 9.5.7. Key Strategic Moves and Developments

    • 9.6. Kuusakoski Recycling

      • 9.6.1. Company Overview

      • 9.6.2. Key Executives

      • 9.6.3. Company Snapshot

      • 9.6.4. Operating Business Segments

      • 9.6.5. Product Portfolio

      • 9.6.6. Business Performance

      • 9.6.7. Key Strategic Moves and Developments

    • 9.7. DOWA HOLDINGS Co., Ltd.

      • 9.7.1. Company Overview

      • 9.7.2. Key Executives

      • 9.7.3. Company Snapshot

      • 9.7.4. Operating Business Segments

      • 9.7.5. Product Portfolio

      • 9.7.6. Business Performance

      • 9.7.7. Key Strategic Moves and Developments

    • 9.8. ArcelorMittal S.A.

      • 9.8.1. Company Overview

      • 9.8.2. Key Executives

      • 9.8.3. Company Snapshot

      • 9.8.4. Operating Business Segments

      • 9.8.5. Product Portfolio

      • 9.8.6. Business Performance

      • 9.8.7. Key Strategic Moves and Developments

    • 9.9. REAL ALLOY

      • 9.9.1. Company Overview

      • 9.9.2. Key Executives

      • 9.9.3. Company Snapshot

      • 9.9.4. Operating Business Segments

      • 9.9.5. Product Portfolio

      • 9.9.6. Business Performance

      • 9.9.7. Key Strategic Moves and Developments

    • 9.10. Norton Aluminium Ltd.

      • 9.10.1. Company Overview

      • 9.10.2. Key Executives

      • 9.10.3. Company Snapshot

      • 9.10.4. Operating Business Segments

      • 9.10.5. Product Portfolio

      • 9.10.6. Business Performance

      • 9.10.7. Key Strategic Moves and Developments

    • 9.11. Commercial Metals Company

      • 9.11.1. Company Overview

      • 9.11.2. Key Executives

      • 9.11.3. Company Snapshot

      • 9.11.4. Operating Business Segments

      • 9.11.5. Product Portfolio

      • 9.11.6. Business Performance

      • 9.11.7. Key Strategic Moves and Developments

    • 9.12. Aurubis AG

      • 9.12.1. Company Overview

      • 9.12.2. Key Executives

      • 9.12.3. Company Snapshot

      • 9.12.4. Operating Business Segments

      • 9.12.5. Product Portfolio

      • 9.12.6. Business Performance

      • 9.12.7. Key Strategic Moves and Developments

  • LIST OF TABLES

  • TABLE 1. GLOBAL ALUMINUM SCRAP RECYCLING MARKET, BY SCRAP TYPE, 2022-2032 ($MILLION)
  • TABLE 2. GLOBAL ALUMINUM SCRAP RECYCLING MARKET FOR OLD SCRAP, BY REGION, 2022-2032 ($MILLION)
  • TABLE 3. GLOBAL ALUMINUM SCRAP RECYCLING MARKET FOR NEW SCRAP, BY REGION, 2022-2032 ($MILLION)
  • TABLE 4. GLOBAL ALUMINUM SCRAP RECYCLING MARKET, BY PRODUCT, 2022-2032 ($MILLION)
  • TABLE 5. GLOBAL ALUMINUM SCRAP RECYCLING MARKET FOR ALUMINUM FOIL SCRAP, BY REGION, 2022-2032 ($MILLION)
  • TABLE 6. GLOBAL ALUMINUM SCRAP RECYCLING MARKET FOR ALUMINUM INGOT SCRAP, BY REGION, 2022-2032 ($MILLION)
  • TABLE 7. GLOBAL ALUMINUM SCRAP RECYCLING MARKET FOR OTHERS, BY REGION, 2022-2032 ($MILLION)
  • TABLE 8. GLOBAL ALUMINUM SCRAP RECYCLING MARKET, BY END-USE SECTOR, 2022-2032 ($MILLION)
  • TABLE 9. GLOBAL ALUMINUM SCRAP RECYCLING MARKET FOR BUILDING CONSTRUCTION, BY REGION, 2022-2032 ($MILLION)
  • TABLE 10. GLOBAL ALUMINUM SCRAP RECYCLING MARKET FOR AUTOMOTIVE, BY REGION, 2022-2032 ($MILLION)
  • TABLE 11. GLOBAL ALUMINUM SCRAP RECYCLING MARKET FOR ELECTRONICS, BY REGION, 2022-2032 ($MILLION)
  • TABLE 12. GLOBAL ALUMINUM SCRAP RECYCLING MARKET FOR MACHINERY EQUIPMENT PACKAGING, BY REGION, 2022-2032 ($MILLION)
  • TABLE 13. GLOBAL ALUMINUM SCRAP RECYCLING MARKET FOR CONSUMER APPLIANCES, BY REGION, 2022-2032 ($MILLION)
  • TABLE 14. GLOBAL ALUMINUM SCRAP RECYCLING MARKET FOR OTHERS (HOME INDUSTRIAL FURNITURE, AEROSPACE, AND RESIDENTIAL COMMERCIAL UTENSILS CONTAINERS), BY REGION, 2022-2032 ($MILLION)
  • TABLE 15. GLOBAL ALUMINUM SCRAP RECYCLING MARKET, BY REGION, 2022-2032 ($MILLION)
  • TABLE 16. NORTH AMERICA ALUMINUM SCRAP RECYCLING, BY REGION, 2022-2032 ($MILLION)
  • TABLE 17. NORTH AMERICA ALUMINUM SCRAP RECYCLING, BY SCRAP TYPE, 2022-2032 ($MILLION)
  • TABLE 18. NORTH AMERICA ALUMINUM SCRAP RECYCLING, BY PRODUCT, 2022-2032 ($MILLION)
  • TABLE 19. NORTH AMERICA ALUMINUM SCRAP RECYCLING, BY END-USE SECTOR, 2022-2032 ($MILLION)
  • TABLE 20. U.S. ALUMINUM SCRAP RECYCLING, BY SCRAP TYPE, 2022-2032 ($MILLION)
  • TABLE 21. U.S. ALUMINUM SCRAP RECYCLING, BY PRODUCT, 2022-2032 ($MILLION)
  • TABLE 22. U.S. ALUMINUM SCRAP RECYCLING, BY END-USE SECTOR, 2022-2032 ($MILLION)
  • TABLE 23. CANADA ALUMINUM SCRAP RECYCLING, BY SCRAP TYPE, 2022-2032 ($MILLION)
  • TABLE 24. CANADA ALUMINUM SCRAP RECYCLING, BY PRODUCT, 2022-2032 ($MILLION)
  • TABLE 25. CANADA ALUMINUM SCRAP RECYCLING, BY END-USE SECTOR, 2022-2032 ($MILLION)
  • TABLE 26. MEXICO ALUMINUM SCRAP RECYCLING, BY SCRAP TYPE, 2022-2032 ($MILLION)
  • TABLE 27. MEXICO ALUMINUM SCRAP RECYCLING, BY PRODUCT, 2022-2032 ($MILLION)
  • TABLE 28. MEXICO ALUMINUM SCRAP RECYCLING, BY END-USE SECTOR, 2022-2032 ($MILLION)
  • TABLE 29. EUROPE ALUMINUM SCRAP RECYCLING, BY REGION, 2022-2032 ($MILLION)
  • TABLE 30. EUROPE ALUMINUM SCRAP RECYCLING, BY SCRAP TYPE, 2022-2032 ($MILLION)
  • TABLE 31. EUROPE ALUMINUM SCRAP RECYCLING, BY PRODUCT, 2022-2032 ($MILLION)
  • TABLE 32. EUROPE ALUMINUM SCRAP RECYCLING, BY END-USE SECTOR, 2022-2032 ($MILLION)
  • TABLE 33. FRANCE ALUMINUM SCRAP RECYCLING, BY SCRAP TYPE, 2022-2032 ($MILLION)
  • TABLE 34. FRANCE ALUMINUM SCRAP RECYCLING, BY PRODUCT, 2022-2032 ($MILLION)
  • TABLE 35. FRANCE ALUMINUM SCRAP RECYCLING, BY END-USE SECTOR, 2022-2032 ($MILLION)
  • TABLE 36. GERMANY ALUMINUM SCRAP RECYCLING, BY SCRAP TYPE, 2022-2032 ($MILLION)
  • TABLE 37. GERMANY ALUMINUM SCRAP RECYCLING, BY PRODUCT, 2022-2032 ($MILLION)
  • TABLE 38. GERMANY ALUMINUM SCRAP RECYCLING, BY END-USE SECTOR, 2022-2032 ($MILLION)
  • TABLE 39. ITALY ALUMINUM SCRAP RECYCLING, BY SCRAP TYPE, 2022-2032 ($MILLION)
  • TABLE 40. ITALY ALUMINUM SCRAP RECYCLING, BY PRODUCT, 2022-2032 ($MILLION)
  • TABLE 41. ITALY ALUMINUM SCRAP RECYCLING, BY END-USE SECTOR, 2022-2032 ($MILLION)
  • TABLE 42. SPAIN ALUMINUM SCRAP RECYCLING, BY SCRAP TYPE, 2022-2032 ($MILLION)
  • TABLE 43. SPAIN ALUMINUM SCRAP RECYCLING, BY PRODUCT, 2022-2032 ($MILLION)
  • TABLE 44. SPAIN ALUMINUM SCRAP RECYCLING, BY END-USE SECTOR, 2022-2032 ($MILLION)
  • TABLE 45. UK ALUMINUM SCRAP RECYCLING, BY SCRAP TYPE, 2022-2032 ($MILLION)
  • TABLE 46. UK ALUMINUM SCRAP RECYCLING, BY PRODUCT, 2022-2032 ($MILLION)
  • TABLE 47. UK ALUMINUM SCRAP RECYCLING, BY END-USE SECTOR, 2022-2032 ($MILLION)
  • TABLE 48. RUSSIA ALUMINUM SCRAP RECYCLING, BY SCRAP TYPE, 2022-2032 ($MILLION)
  • TABLE 49. RUSSIA ALUMINUM SCRAP RECYCLING, BY PRODUCT, 2022-2032 ($MILLION)
  • TABLE 50. RUSSIA ALUMINUM SCRAP RECYCLING, BY END-USE SECTOR, 2022-2032 ($MILLION)
  • TABLE 51. REST OF EUROPE ALUMINUM SCRAP RECYCLING, BY SCRAP TYPE, 2022-2032 ($MILLION)
  • TABLE 52. REST OF EUROPE ALUMINUM SCRAP RECYCLING, BY PRODUCT, 2022-2032 ($MILLION)
  • TABLE 53. REST OF EUROPE ALUMINUM SCRAP RECYCLING, BY END-USE SECTOR, 2022-2032 ($MILLION)
  • TABLE 54. ASIA-PACIFIC ALUMINUM SCRAP RECYCLING, BY REGION, 2022-2032 ($MILLION)
  • TABLE 55. ASIA-PACIFIC ALUMINUM SCRAP RECYCLING, BY SCRAP TYPE, 2022-2032 ($MILLION)
  • TABLE 56. ASIA-PACIFIC ALUMINUM SCRAP RECYCLING, BY PRODUCT, 2022-2032 ($MILLION)
  • TABLE 57. ASIA-PACIFIC ALUMINUM SCRAP RECYCLING, BY END-USE SECTOR, 2022-2032 ($MILLION)
  • TABLE 58. CHINA ALUMINUM SCRAP RECYCLING, BY SCRAP TYPE, 2022-2032 ($MILLION)
  • TABLE 59. CHINA ALUMINUM SCRAP RECYCLING, BY PRODUCT, 2022-2032 ($MILLION)
  • TABLE 60. CHINA ALUMINUM SCRAP RECYCLING, BY END-USE SECTOR, 2022-2032 ($MILLION)
  • TABLE 61. JAPAN ALUMINUM SCRAP RECYCLING, BY SCRAP TYPE, 2022-2032 ($MILLION)
  • TABLE 62. JAPAN ALUMINUM SCRAP RECYCLING, BY PRODUCT, 2022-2032 ($MILLION)
  • TABLE 63. JAPAN ALUMINUM SCRAP RECYCLING, BY END-USE SECTOR, 2022-2032 ($MILLION)
  • TABLE 64. INDIA ALUMINUM SCRAP RECYCLING, BY SCRAP TYPE, 2022-2032 ($MILLION)
  • TABLE 65. INDIA ALUMINUM SCRAP RECYCLING, BY PRODUCT, 2022-2032 ($MILLION)
  • TABLE 66. INDIA ALUMINUM SCRAP RECYCLING, BY END-USE SECTOR, 2022-2032 ($MILLION)
  • TABLE 67. SOUTH KOREA ALUMINUM SCRAP RECYCLING, BY SCRAP TYPE, 2022-2032 ($MILLION)
  • TABLE 68. SOUTH KOREA ALUMINUM SCRAP RECYCLING, BY PRODUCT, 2022-2032 ($MILLION)
  • TABLE 69. SOUTH KOREA ALUMINUM SCRAP RECYCLING, BY END-USE SECTOR, 2022-2032 ($MILLION)
  • TABLE 70. AUSTRALIA ALUMINUM SCRAP RECYCLING, BY SCRAP TYPE, 2022-2032 ($MILLION)
  • TABLE 71. AUSTRALIA ALUMINUM SCRAP RECYCLING, BY PRODUCT, 2022-2032 ($MILLION)
  • TABLE 72. AUSTRALIA ALUMINUM SCRAP RECYCLING, BY END-USE SECTOR, 2022-2032 ($MILLION)
  • TABLE 73. THAILAND ALUMINUM SCRAP RECYCLING, BY SCRAP TYPE, 2022-2032 ($MILLION)
  • TABLE 74. THAILAND ALUMINUM SCRAP RECYCLING, BY PRODUCT, 2022-2032 ($MILLION)
  • TABLE 75. THAILAND ALUMINUM SCRAP RECYCLING, BY END-USE SECTOR, 2022-2032 ($MILLION)
  • TABLE 76. MALAYSIA ALUMINUM SCRAP RECYCLING, BY SCRAP TYPE, 2022-2032 ($MILLION)
  • TABLE 77. MALAYSIA ALUMINUM SCRAP RECYCLING, BY PRODUCT, 2022-2032 ($MILLION)
  • TABLE 78. MALAYSIA ALUMINUM SCRAP RECYCLING, BY END-USE SECTOR, 2022-2032 ($MILLION)
  • TABLE 79. INDONESIA ALUMINUM SCRAP RECYCLING, BY SCRAP TYPE, 2022-2032 ($MILLION)
  • TABLE 80. INDONESIA ALUMINUM SCRAP RECYCLING, BY PRODUCT, 2022-2032 ($MILLION)
  • TABLE 81. INDONESIA ALUMINUM SCRAP RECYCLING, BY END-USE SECTOR, 2022-2032 ($MILLION)
  • TABLE 82. REST OF ASIA PACIFIC ALUMINUM SCRAP RECYCLING, BY SCRAP TYPE, 2022-2032 ($MILLION)
  • TABLE 83. REST OF ASIA PACIFIC ALUMINUM SCRAP RECYCLING, BY PRODUCT, 2022-2032 ($MILLION)
  • TABLE 84. REST OF ASIA PACIFIC ALUMINUM SCRAP RECYCLING, BY END-USE SECTOR, 2022-2032 ($MILLION)
  • TABLE 85. LAMEA ALUMINUM SCRAP RECYCLING, BY REGION, 2022-2032 ($MILLION)
  • TABLE 86. LAMEA ALUMINUM SCRAP RECYCLING, BY SCRAP TYPE, 2022-2032 ($MILLION)
  • TABLE 87. LAMEA ALUMINUM SCRAP RECYCLING, BY PRODUCT, 2022-2032 ($MILLION)
  • TABLE 88. LAMEA ALUMINUM SCRAP RECYCLING, BY END-USE SECTOR, 2022-2032 ($MILLION)
  • TABLE 89. BRAZIL ALUMINUM SCRAP RECYCLING, BY SCRAP TYPE, 2022-2032 ($MILLION)
  • TABLE 90. BRAZIL ALUMINUM SCRAP RECYCLING, BY PRODUCT, 2022-2032 ($MILLION)
  • TABLE 91. BRAZIL ALUMINUM SCRAP RECYCLING, BY END-USE SECTOR, 2022-2032 ($MILLION)
  • TABLE 92. SOUTH AFRICA ALUMINUM SCRAP RECYCLING, BY SCRAP TYPE, 2022-2032 ($MILLION)
  • TABLE 93. SOUTH AFRICA ALUMINUM SCRAP RECYCLING, BY PRODUCT, 2022-2032 ($MILLION)
  • TABLE 94. SOUTH AFRICA ALUMINUM SCRAP RECYCLING, BY END-USE SECTOR, 2022-2032 ($MILLION)
  • TABLE 95. SAUDI ARABIA ALUMINUM SCRAP RECYCLING, BY SCRAP TYPE, 2022-2032 ($MILLION)
  • TABLE 96. SAUDI ARABIA ALUMINUM SCRAP RECYCLING, BY PRODUCT, 2022-2032 ($MILLION)
  • TABLE 97. SAUDI ARABIA ALUMINUM SCRAP RECYCLING, BY END-USE SECTOR, 2022-2032 ($MILLION)
  • TABLE 98. UAE ALUMINUM SCRAP RECYCLING, BY SCRAP TYPE, 2022-2032 ($MILLION)
  • TABLE 99. UAE ALUMINUM SCRAP RECYCLING, BY PRODUCT, 2022-2032 ($MILLION)
  • TABLE 100. UAE ALUMINUM SCRAP RECYCLING, BY END-USE SECTOR, 2022-2032 ($MILLION)
  • TABLE 101. ARGENTINA ALUMINUM SCRAP RECYCLING, BY SCRAP TYPE, 2022-2032 ($MILLION)
  • TABLE 102. ARGENTINA ALUMINUM SCRAP RECYCLING, BY PRODUCT, 2022-2032 ($MILLION)
  • TABLE 103. ARGENTINA ALUMINUM SCRAP RECYCLING, BY END-USE SECTOR, 2022-2032 ($MILLION)
  • TABLE 104. REST OF LAMEA ALUMINUM SCRAP RECYCLING, BY SCRAP TYPE, 2022-2032 ($MILLION)
  • TABLE 105. REST OF LAMEA ALUMINUM SCRAP RECYCLING, BY PRODUCT, 2022-2032 ($MILLION)
  • TABLE 106. REST OF LAMEA ALUMINUM SCRAP RECYCLING, BY END-USE SECTOR, 2022-2032 ($MILLION)
  • TABLE 107. EUROPEAN METAL RECYCLING: KEY EXECUTIVES
  • TABLE 108. EUROPEAN METAL RECYCLING: COMPANY SNAPSHOT
  • TABLE 109. EUROPEAN METAL RECYCLING: OPERATING SEGMENTS
  • TABLE 110. EUROPEAN METAL RECYCLING: PRODUCT PORTFOLIO
  • TABLE 111. EUROPEAN METAL RECYCLING: KEY STRATEGIC MOVES AND DEVELOPMENTS
  • TABLE 112. NOVELIS INC.: KEY EXECUTIVES
  • TABLE 113. NOVELIS INC.: COMPANY SNAPSHOT
  • TABLE 114. NOVELIS INC.: OPERATING SEGMENTS
  • TABLE 115. NOVELIS INC.: PRODUCT PORTFOLIO
  • TABLE 116. NOVELIS INC.: KEY STRATEGIC MOVES AND DEVELOPMENTS
  • TABLE 117. NUCOR CORPORATION: KEY EXECUTIVES
  • TABLE 118. NUCOR CORPORATION: COMPANY SNAPSHOT
  • TABLE 119. NUCOR CORPORATION: OPERATING SEGMENTS
  • TABLE 120. NUCOR CORPORATION: PRODUCT PORTFOLIO
  • TABLE 121. NUCOR CORPORATION: KEY STRATEGIC MOVES AND DEVELOPMENTS
  • TABLE 122. TOM MARTIN AND CO. LTD.: KEY EXECUTIVES
  • TABLE 123. TOM MARTIN AND CO. LTD.: COMPANY SNAPSHOT
  • TABLE 124. TOM MARTIN AND CO. LTD.: OPERATING SEGMENTS
  • TABLE 125. TOM MARTIN AND CO. LTD.: PRODUCT PORTFOLIO
  • TABLE 126. TOM MARTIN AND CO. LTD.: KEY STRATEGIC MOVES AND DEVELOPMENTS
  • TABLE 127. SIMS METAL MANAGEMENT: KEY EXECUTIVES
  • TABLE 128. SIMS METAL MANAGEMENT: COMPANY SNAPSHOT
  • TABLE 129. SIMS METAL MANAGEMENT: OPERATING SEGMENTS
  • TABLE 130. SIMS METAL MANAGEMENT: PRODUCT PORTFOLIO
  • TABLE 131. SIMS METAL MANAGEMENT: KEY STRATEGIC MOVES AND DEVELOPMENTS
  • TABLE 132. KUUSAKOSKI RECYCLING: KEY EXECUTIVES
  • TABLE 133. KUUSAKOSKI RECYCLING: COMPANY SNAPSHOT
  • TABLE 134. KUUSAKOSKI RECYCLING: OPERATING SEGMENTS
  • TABLE 135. KUUSAKOSKI RECYCLING: PRODUCT PORTFOLIO
  • TABLE 136. KUUSAKOSKI RECYCLING: KEY STRATEGIC MOVES AND DEVELOPMENTS
  • TABLE 137. DOWA HOLDINGS CO., LTD.: KEY EXECUTIVES
  • TABLE 138. DOWA HOLDINGS CO., LTD.: COMPANY SNAPSHOT
  • TABLE 139. DOWA HOLDINGS CO., LTD.: OPERATING SEGMENTS
  • TABLE 140. DOWA HOLDINGS CO., LTD.: PRODUCT PORTFOLIO
  • TABLE 141. DOWA HOLDINGS CO., LTD.: KEY STRATEGIC MOVES AND DEVELOPMENTS
  • TABLE 142. ARCELORMITTAL S.A.: KEY EXECUTIVES
  • TABLE 143. ARCELORMITTAL S.A.: COMPANY SNAPSHOT
  • TABLE 144. ARCELORMITTAL S.A.: OPERATING SEGMENTS
  • TABLE 145. ARCELORMITTAL S.A.: PRODUCT PORTFOLIO
  • TABLE 146. ARCELORMITTAL S.A.: KEY STRATEGIC MOVES AND DEVELOPMENTS
  • TABLE 147. REAL ALLOY: KEY EXECUTIVES
  • TABLE 148. REAL ALLOY: COMPANY SNAPSHOT
  • TABLE 149. REAL ALLOY: OPERATING SEGMENTS
  • TABLE 150. REAL ALLOY: PRODUCT PORTFOLIO
  • TABLE 151. REAL ALLOY: KEY STRATEGIC MOVES AND DEVELOPMENTS
  • TABLE 152. NORTON ALUMINIUM LTD.: KEY EXECUTIVES
  • TABLE 153. NORTON ALUMINIUM LTD.: COMPANY SNAPSHOT
  • TABLE 154. NORTON ALUMINIUM LTD.: OPERATING SEGMENTS
  • TABLE 155. NORTON ALUMINIUM LTD.: PRODUCT PORTFOLIO
  • TABLE 156. NORTON ALUMINIUM LTD.: KEY STRATEGIC MOVES AND DEVELOPMENTS
  • TABLE 157. COMMERCIAL METALS COMPANY: KEY EXECUTIVES
  • TABLE 158. COMMERCIAL METALS COMPANY: COMPANY SNAPSHOT
  • TABLE 159. COMMERCIAL METALS COMPANY: OPERATING SEGMENTS
  • TABLE 160. COMMERCIAL METALS COMPANY: PRODUCT PORTFOLIO
  • TABLE 161. COMMERCIAL METALS COMPANY: KEY STRATEGIC MOVES AND DEVELOPMENTS
  • TABLE 162. AURUBIS AG: KEY EXECUTIVES
  • TABLE 163. AURUBIS AG: COMPANY SNAPSHOT
  • TABLE 164. AURUBIS AG: OPERATING SEGMENTS
  • TABLE 165. AURUBIS AG: PRODUCT PORTFOLIO
  • TABLE 166. AURUBIS AG: KEY STRATEGIC MOVES AND DEVELOPMENTS
  • LIST OF FIGURES

  • FIGURE 1. GLOBAL ALUMINUM SCRAP RECYCLING MARKET SEGMENTATION
  • FIGURE 2. GLOBAL ALUMINUM SCRAP RECYCLING MARKET
  • FIGURE 3. SEGMENTATION ALUMINUM SCRAP RECYCLING MARKET
  • FIGURE 4. TOP INVESTMENT POCKET IN ALUMINUM SCRAP RECYCLING MARKET
  • FIGURE 5. MODERATE BARGAINING POWER OF BUYERS
  • FIGURE 6. MODERATE BARGAINING POWER OF SUPPLIERS
  • FIGURE 7. MODERATE THREAT OF NEW ENTRANTS
  • FIGURE 8. LOW THREAT OF SUBSTITUTION
  • FIGURE 9. HIGH COMPETITIVE RIVALRY
  • FIGURE 10. OPPORTUNITIES, RESTRAINTS AND DRIVERS: GLOBALALUMINUM SCRAP RECYCLING MARKET
  • FIGURE 11. ALUMINUM SCRAP RECYCLING MARKET SEGMENTATION, BY BY SCRAP TYPE
  • FIGURE 12. ALUMINUM SCRAP RECYCLING MARKET FOR OLD SCRAP, BY COUNTRY, 2022-2032 ($MILLION)
  • FIGURE 13. ALUMINUM SCRAP RECYCLING MARKET FOR NEW SCRAP, BY COUNTRY, 2022-2032 ($MILLION)
  • FIGURE 14. ALUMINUM SCRAP RECYCLING MARKET SEGMENTATION, BY BY PRODUCT
  • FIGURE 15. ALUMINUM SCRAP RECYCLING MARKET FOR ALUMINUM FOIL SCRAP, BY COUNTRY, 2022-2032 ($MILLION)
  • FIGURE 16. ALUMINUM SCRAP RECYCLING MARKET FOR ALUMINUM INGOT SCRAP, BY COUNTRY, 2022-2032 ($MILLION)
  • FIGURE 17. ALUMINUM SCRAP RECYCLING MARKET FOR OTHERS, BY COUNTRY, 2022-2032 ($MILLION)
  • FIGURE 18. ALUMINUM SCRAP RECYCLING MARKET SEGMENTATION, BY BY END-USE SECTOR
  • FIGURE 19. ALUMINUM SCRAP RECYCLING MARKET FOR BUILDING CONSTRUCTION, BY COUNTRY, 2022-2032 ($MILLION)
  • FIGURE 20. ALUMINUM SCRAP RECYCLING MARKET FOR AUTOMOTIVE, BY COUNTRY, 2022-2032 ($MILLION)
  • FIGURE 21. ALUMINUM SCRAP RECYCLING MARKET FOR ELECTRONICS, BY COUNTRY, 2022-2032 ($MILLION)
  • FIGURE 22. ALUMINUM SCRAP RECYCLING MARKET FOR MACHINERY EQUIPMENT PACKAGING, BY COUNTRY, 2022-2032 ($MILLION)
  • FIGURE 23. ALUMINUM SCRAP RECYCLING MARKET FOR CONSUMER APPLIANCES, BY COUNTRY, 2022-2032 ($MILLION)
  • FIGURE 24. ALUMINUM SCRAP RECYCLING MARKET FOR OTHERS (HOME INDUSTRIAL FURNITURE, AEROSPACE, AND RESIDENTIAL COMMERCIAL UTENSILS CONTAINERS), BY COUNTRY, 2022-2032 ($MILLION)
  • FIGURE 25. TOP WINNING STRATEGIES, BY YEAR, 2020-2022*
  • FIGURE 26. TOP WINNING STRATEGIES, BY DEVELOPMENT, 2020-2022*
  • FIGURE 27. TOP WINNING STRATEGIES, BY COMPANY, 2020-2022*
  • FIGURE 28. PRODUCT MAPPING OF TOP 10 PLAYERS
  • FIGURE 29. COMPETITIVE DASHBOARD
  • FIGURE 30. COMPETITIVE HEATMAP: ALUMINUM SCRAP RECYCLING MARKET
  • FIGURE 31. Top player positioning, 2022
  • FIGURE 32. EUROPEAN METAL RECYCLING: NET SALES, 2020-2022 ($MILLION)
  • FIGURE 33. EUROPEAN METAL RECYCLING: REVENUE SHARE, BY SEGMENT, 2032 (%)
  • FIGURE 34. EUROPEAN METAL RECYCLING: REVENUE SHARE, BY REGION, 2032 (%)
  • FIGURE 35. NOVELIS INC.: NET SALES, 2020-2022 ($MILLION)
  • FIGURE 36. NOVELIS INC.: REVENUE SHARE, BY SEGMENT, 2032 (%)
  • FIGURE 37. NOVELIS INC.: REVENUE SHARE, BY REGION, 2032 (%)
  • FIGURE 38. NUCOR CORPORATION: NET SALES, 2020-2022 ($MILLION)
  • FIGURE 39. NUCOR CORPORATION: REVENUE SHARE, BY SEGMENT, 2032 (%)
  • FIGURE 40. NUCOR CORPORATION: REVENUE SHARE, BY REGION, 2032 (%)
  • FIGURE 41. TOM MARTIN AND CO. LTD.: NET SALES, 2020-2022 ($MILLION)
  • FIGURE 42. TOM MARTIN AND CO. LTD.: REVENUE SHARE, BY SEGMENT, 2032 (%)
  • FIGURE 43. TOM MARTIN AND CO. LTD.: REVENUE SHARE, BY REGION, 2032 (%)
  • FIGURE 44. SIMS METAL MANAGEMENT: NET SALES, 2020-2022 ($MILLION)
  • FIGURE 45. SIMS METAL MANAGEMENT: REVENUE SHARE, BY SEGMENT, 2032 (%)
  • FIGURE 46. SIMS METAL MANAGEMENT: REVENUE SHARE, BY REGION, 2032 (%)
  • FIGURE 47. KUUSAKOSKI RECYCLING: NET SALES, 2020-2022 ($MILLION)
  • FIGURE 48. KUUSAKOSKI RECYCLING: REVENUE SHARE, BY SEGMENT, 2032 (%)
  • FIGURE 49. KUUSAKOSKI RECYCLING: REVENUE SHARE, BY REGION, 2032 (%)
  • FIGURE 50. DOWA HOLDINGS CO., LTD.: NET SALES, 2020-2022 ($MILLION)
  • FIGURE 51. DOWA HOLDINGS CO., LTD.: REVENUE SHARE, BY SEGMENT, 2032 (%)
  • FIGURE 52. DOWA HOLDINGS CO., LTD.: REVENUE SHARE, BY REGION, 2032 (%)
  • FIGURE 53. ARCELORMITTAL S.A.: NET SALES, 2020-2022 ($MILLION)
  • FIGURE 54. ARCELORMITTAL S.A.: REVENUE SHARE, BY SEGMENT, 2032 (%)
  • FIGURE 55. ARCELORMITTAL S.A.: REVENUE SHARE, BY REGION, 2032 (%)
  • FIGURE 56. REAL ALLOY: NET SALES, 2020-2022 ($MILLION)
  • FIGURE 57. REAL ALLOY: REVENUE SHARE, BY SEGMENT, 2032 (%)
  • FIGURE 58. REAL ALLOY: REVENUE SHARE, BY REGION, 2032 (%)
  • FIGURE 59. NORTON ALUMINIUM LTD.: NET SALES, 2020-2022 ($MILLION)
  • FIGURE 60. NORTON ALUMINIUM LTD.: REVENUE SHARE, BY SEGMENT, 2032 (%)
  • FIGURE 61. NORTON ALUMINIUM LTD.: REVENUE SHARE, BY REGION, 2032 (%)
  • FIGURE 62. COMMERCIAL METALS COMPANY: NET SALES, 2020-2022 ($MILLION)
  • FIGURE 63. COMMERCIAL METALS COMPANY: REVENUE SHARE, BY SEGMENT, 2032 (%)
  • FIGURE 64. COMMERCIAL METALS COMPANY: REVENUE SHARE, BY REGION, 2032 (%)
  • FIGURE 65. AURUBIS AG: NET SALES, 2020-2022 ($MILLION)
  • FIGURE 66. AURUBIS AG: REVENUE SHARE, BY SEGMENT, 2032 (%)
  • FIGURE 67. AURUBIS AG: REVENUE SHARE, BY REGION, 2032 (%)


With collective industry experience of about 200 years of its analysts and experts, Allied Market Research (AMR) encompasses most infallible research methodology for its market intelligence and industry analysis. We do not only engrave the deepest levels of markets but also sneak through its slimmest details for the purpose of our market estimates and forecasts. Our approach helps in building greater market consensus view for size, shape and industry trends within each industry segment. We carefully factor in industry trends and real developments for identifying key growth factors and future course of the market. Our research proceeds are the resultant of high quality data, expert views and analysis and high value independent opinions. Our research process is designed to deliver balanced view of the global markets and allow stakeholders to make informed decisions.

We offer our clients exhaustive research and analysis based on wide variety of factual inputs, which largely include interviews with industry participants, reliable statistics and regional intelligence. Our in-house industry experts play instrumental role in designing analytic tools and models, tailored to the requirements of particular industry segment. These analytical tools and models sanitize the data & statistics and enhance the accuracy of our recommendations and advice. With AMR’s calibrated research process and 360` degree data-evaluation methodology, our clients are assured of receiving:

  • Consistent, valuable, robust and actionable data & analysis that can easily be referenced for strategic business planning
  • Technologically sophisticated and reliable insights through well audited and veracious research methodology
  • Sovereign research proceeds that present a tangible depiction of marketplace


With a strong methodology we are, therefore, confident that our research and analysis are most reliable and guarantees sound business planning.

Secondary research
We refer a broad array of industry sources for our secondary, which typically include; however, not limited to: Company SEC filings, annual reports, company websites, broker & financial reports and investor presentations for competitive scenario and shape of the industry

  • Patent and regulatory databases for understanding of technical & legal developments
  • Scientific and technical writings for product information and related preemptions
  • Regional government and statistical databases for macro analysis
  • Authentic new articles, web-casts and other related releases for market evaluation
  • Internal and external proprietary databases, key market indicators and relevant press releases for market estimates and forecast


Primary research
Our primary research efforts include reaching out participants through mail, tele-conversations, referrals, professional networks and face-to-face interactions. We are also in professional corporate relations with various companies that allow us greater flexibility for reaching out industry participants and commentators for interviews and discussions, fulfilling following functions:

  • Validates and improves the data quality and strengthens research proceeds
  • Further develops analyst team’s market understanding and expertise
  • Supplies authentic information about market size, share, growth and forecasts


Our primary research interview and discussion panels are typically composed of most experienced industry members. These participants include; however, not limited to:

  • Chief executives and VPs of leading corporations specific to industry
  • Product and sales managers or country heads; channel partners and top level distributors; banking, investments and valuation experts Key opinion leaders (KOLs)


Analyst tools and models
AMR has developed set of analyst tools and data models to supplement and expedite the analysis process. Corresponding to markets, where there is significant lack of information and estimates, AMR’s team of experts and analyst develop specific analyst tools and industry models to translate qualitative and quantitative industry indicators into exact industry estimates. These models also allow analysts to examine the prospects and opportunities prevailing in the market to accurately forecast the course of the market.

PURCHASE OPTIONS

Call or Email us

U.S.-Canada Toll-free: +1-800-792-5285
Int'l : +1-503-894-6022
Europe : +44-845-528-1300
Email : help@alliedmarketresearch.com

Looking for Customization?

 Customization Request

Have a Question?

 Speak with Analyst

Any Confusion?

 Inquire Before Buying

Have a glance of the Report

  Enquiry Now

Purchase Full Report of
Aluminum Scrap Recycling Market

Start reading.
This Report and over 66,805+ more Reports, Available with Avenue Library. T&C*.

  • Online Only
  • $3,690
  • Online cloud access only
  • Restricted print, copy, paste & download
  • Read only
  • Free industry update
    (Within 180 days)
  • Free report update in next update cycle
  • Data Pack
  • $3,840
  • Restricted to one authorized user
  • One print only
  • Available in
    Excel
  • Free industry update
    (Within 180 days)
  •   Free report update in next update cycle
  • Single User
  • $5,820
  • Restricted to one authorized user
  • One print only
  • Available in
    PDF
  • Free industry update
    (Within 180 days)
  •   Free report update in next update cycle
  • Five Users
  • $6,540
  • Limited to five authorized users
  • Print upto five copies
  • Available in
    PDF
  • Free industry update
    (Within 180 days)
  •   Free report update in next update cycle
  • Enterprise
    License/PDF

  • $9,870
  • Unlimited
    within
    company/enterprise
  • Available in Excel & PDF
  • Free industry update
    (Within 180 days)
  •   Free report update in next update cycle
  • Library
    Membership

  • $999 $ 1,175
    Per User/ Per month/ Billed annually
  • Published Content
    E-access
  • Company Profiles
    E-access
  • Newly Added Content Access
  • 10 PDF
    Downloads
  • 5 Excel Data
    Pack Downloads
  • 250 Company Profiles PDF Downloads
  • Buy Now

*Taxes/Fees, if applicable will be added during checkout. All prices in USD

RELATED REPORTS
 

Why Allied Market Research?


Infallible Methodology

To ensure high-level data integrity, accurate analysis, and impeccable forecasts

Analyst Support

For complete satisfaction

Customization

On-demand customization of scope of the report to exactly meet your needs

TARGETED MARKET VIEW

Targeted market view to provide pertinent information and save time of readers

Get fresh content delivered

Get insights on topics that are crucial for your business. Stay abreast of your interest areas.

Get Industry Data Alerts

Why Allied Market Research?

Infallible Methodology

To ensure high-level data integrity, accurate analysis, and impeccable forecasts

Analyst Support

For complete satisfaction

Customization

On-demand customization of scope of the report to exactly meet your needs

TARGETED MARKET VIEW

Targeted market view to provide pertinent information and save time of readers