
Aluminum Welding Market Research, 2030
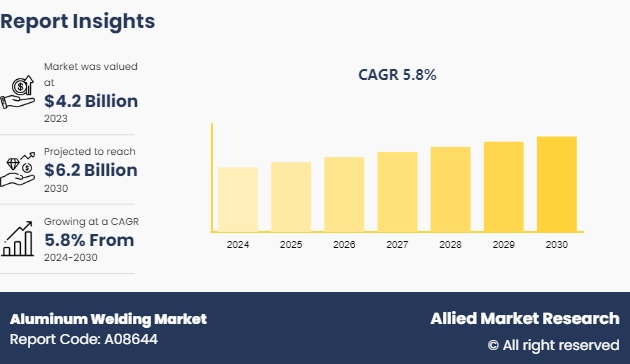
The global aluminum welding market was valued at $4.2 billion in 2023, and is projected to reach $6.2 Billion by 2030, growing at a CAGR of 5.8% from 2024 to 2030.
Introduction
Aluminum welding involves joining aluminum parts using various welding wires and techniques. The primary wire types include pure aluminum welding wire, aluminum-magnesium alloy welding wire, and aluminum-silicon alloy welding wire, each suitable for different aluminum compositions and applications.
Common welding techniques for aluminum include arc welding, gas metal-arc (MIG) welding, gas tungsten-arc (TIG) welding, torch welding, laser beam welding, electron beam welding, and resistance welding. MIG and TIG welding are the most frequently used methods due to their adaptability and precision, providing strong and clean welds. The technique has its own set of strengths, making it crucial to choose the appropriate method based on the specific requirements of the aluminum project, such as material thickness, joint type, and desired weld quality.
Key Takeaways
- The aluminum welding market study covers 20 countries. The research includes a segment analysis of each country in terms of value for the projected period.
- More than 1, 500 product literature, industry releases, annual reports, and other documents of major valine industry participants, authentic industry journals, trade associations' releases, and government websites have been reviewed for generating high-value industry insights.
- The study integrated high-quality data, professional opinions and analysis, and critical independent perspectives. The research approach is intended to provide a balanced view of global markets and to assist stakeholders in making educated decisions to achieve the most ambitious growth objectives.
Market Dynamics
Technological advancements in welding techniques are significantly driving the growth of the aluminum welding market. Innovations such as friction, inertia, and laser welding are enhancing precision, efficiency, and versatility in aluminum welding processes. These advancements allow for stronger, more reliable welds, which are essential in industries demanding high performance and safety standards, such as the aerospace and automotive sectors. Simultaneously, increase in demand for lightweight materials is another crucial driver. Industries such as automotive, aerospace, and construction are shifting towards lightweight materials to improve fuel efficiency, reduce emissions, and enhance performance. Aluminum, being a lightweight yet strong material, is at the forefront of this trend. The rising adoption of aluminum in manufacturing drives the demand for advanced welding solutions tailored to aluminum's properties, further propelling the growth of the aluminum welding market.
Aluminum is widely used in various industries for its lightweight and corrosion-resistant properties. The welding process demands specific materials tailored to its unique characteristics. However, availability of these materials can be limited compared to those used in traditional steel welding. This scarcity affects the accessibility of welding supplies and influences production timelines and costs. In addition, the lack of diverse material options constrains innovation in aluminum welding techniques, hindering the development of more efficient and cost-effective processes. As a result, the industry is expected to face challenges in meeting the growing demand and adapting to evolving market needs. Addressing this constraint through research and development efforts to expand the range of available welding materials is expected to unlock significant opportunities for growth and advancement in the aluminum welding market.
Furthermore, emerging economies across the globe are experiencing rapid urbanization and industrialization, and are driving the demand for aluminum welding solutions in sectors like construction, automotive, and aerospace. Moreover, the versatility and lightweight properties of aluminum make it increasingly attractive for diverse applications, ranging from renewable energy infrastructure to consumer electronics. As industries evolve and innovate, the demand for aluminum welding technologies rises to meet the challenges of joining aluminum alloys efficiently and effectively. This expansion presents an opportunity for aluminum welding manufacturers to develop advanced welding techniques, such as laser and friction stir welding to cater to emerging market needs and capitalize on the growing industrial applications of aluminum across various sectors.

The patent overview based on the abovementioned data in 2023 reveals a clear dominance of China in patent filings, accounting for 94.9% of the total with 2, 605 patents. Following China, Japan held a distant second place with 1.2% and 32 patents, trailed closely by the U.S. and the Patent Cooperation Treaty (PCT) with 1.1% each. The Russian Federation and the European Patent Office each held 0.5% of patents, while the Republic of Korea, India, UK, and Mexico contributed smaller percentages ranging from 0.3% to 0.1%. These statistics underscore China's significant presence in patent activity, reflecting its focus on innovation and technological advancement. Japan and the U.S. also maintain notable patent filings, showcasing their contributions to global innovation. The data indicates a diverse distribution of patent filings across countries, emphasizing the importance of intellectual property protection in the global innovation landscape.
Segment Overview
The aluminum welding market is segmented into wire type, technique, end-use, and region. By type, the market is classified into pure aluminum welding wire, aluminum magnesium alloy welding wire, and Al-Si alloy welding wire. On the basis of technique, the market is segregated into arc welding, gas metal-arc (MIG) welding, gas tungsten-arc (TIG) welding, torch welding, laser beam welding, electron beam welding, resistance welding, and others. As per end-use, the market is categorized into automotive, aerospace, marine, construction, and others. Region-wise the market is analyzed across North America, Europe, Asia-Pacific, and LAMEA.
Competitive Analysis
Key market players in the aluminum welding market include The Lincoln Electric Company, ESAB, Hilarius Haarlem Holland B.V., EWM AG, Hermann Fliess and Co. GmbH, Drahtwerk ELISENTAL W. Erdmann GmbH & Co., Safra Spa, Mech Static Hydraulics, Atlantic China Welding Consumables, and Anand Arc Ltd. In addition, other key market players in the market include CTP - Gruppo Petitto, Tianjin Bridge Welding Materials Group Co., Ltd., Aerospace Engineering Equipment (Suzhou) Co., Ltd., Welding Alloys Group, Air Liquide, Jinglei Welding, Sural, C.A., Sumitomo Electric Industries, Ltd., NOVAMETAL SA, TWI Ltd., and Bohler.
Industry Trends
- In the automotive industry, the trend of welding aluminum parts is on rise due to rise in demand for lightweight and high-strength materials, which improves fuel efficiency and performance. Aluminum alloy components, such as those made from 6082, are increasingly used in vehicle construction for their ability to reduce weight while maintaining structural integrity. For instance, according to IEA Global Outlook 2023, “battery electric cars, which accounted for 70% of the electric car stock in 2023, require efficient and durable manufacturing techniques to ensure structural integrity and safety. The dominance of key markets such as China, Europe, and the U.S., which accounted for 95% of global electric car sales, further drives the demand for advanced aluminum welding technologies”.
- In the aerospace industry, aluminum welding is critical due to aluminum's favorable properties, including its lightweight, corrosion resistance, and high strength-to-weight ratio. These characteristics make aluminum ideal for constructing aircraft frames, fuselages, and other critical components, helping to improve fuel efficiency and payload capacity. Increase in the utilization of airways for transportation in developed and developing countries across the globe is expected to have a significant impact on the demand for the aluminum welding market.
- The marine industry uses aluminum welding extensively for building large structures such as hulls and superstructures. Aluminum’s resistance to corrosion in seawater, combined with its lightweight nature, makes it ideal for enhancing the longevity and performance of marine vessels, reducing maintenance costs, and improving fuel efficiency. For instance, according to UNCTAD, the global marine vessel market is projected to grow to $189 billion by 2028, at a CAGR of 1.43%. Rise in demand for lightweight materials such as aluminum drives the demand for aluminum welding techniques to enhance the structural integrity and performance of marine vessels.
- In the construction industry, aluminum welding is employed for building frameworks, façades, and other structural components. The material’s corrosion resistance and lightweight properties contribute to the durability and ease of installation in construction projects, making it a preferred choice for modern architectural designs. For instance, aluminum is used in the construction of prefab houses. It is revered as the “green metal, ” and is enabling a significant shift in building practices. Aluminum stands out for its exceptional strength-to-weight ratio, a property that has become increasingly valuable in modern architecture. Its resistance to corrosion and superior thermal properties make it an ideal choice for building exteriors and climate control systems. Furthermore, aluminum’s malleability lends itself to creative architectural expressions, allowing designers to push the boundaries of conventional construction.
Key Regulations Analysis
- EN ISO 25239-3:2020: This international standard outlines the criteria for qualifying welding operators engaged in friction stir welding of aluminum. By establishing guidelines for operator qualification, it ensures that individuals possess the necessary expertise to consistently produce high-quality welds in compliance with set standards and requirements.
- ISO 15612:2018: Serving as a comprehensive framework, this standard delineates the specifications and qualifications essential for welding procedures involving metallic materials. It offers guidance on adhering to a standard welding procedure specification (SWPS) derived from welding procedure qualification tests conducted by external entities, enabling users to execute welding processes reliably and effectively.
- EN ISO 6847:2020: This standard sets forth the prescribed procedure for depositing a welded metal pad for subsequent chemical analysis. Applicable to various welding techniques such as gas-shielded metal arc welding and gas tungsten arc welding, it details the methodology for creating a weld metal pad to facilitate accurate chemical analysis and quality control in welding operations.
- AWS D1.2/D1.2M:2014: Developed by the American Welding Society, this standard serves as a vital regulatory framework for the welding of structural aluminum in fabrication, erection, and manufacturing industries. It encompasses specific welding requirements for structures constructed from aluminum structural alloys, excluding aluminum pressure vessels and pressure piping, ensuring adherence to established guidelines for structural integrity and safety.
Key Sources Referred
- International Aluminum
- Mining.com
- Aluminium.org.au
- IEA
- American Doughlas Metal (ADM)
Key Benefits For Stakeholders
- This report provides a quantitative analysis of the market segments, current trends, estimations, and dynamics of the aluminum welding market analysis from 2024 to 2030 to identify the prevailing aluminum welding market opportunities.
- The market research is offered along with information related to key drivers, restraints, and opportunities.
- Porter's five forces analysis highlights the potency of buyers and suppliers to enable stakeholders make profit-oriented business decisions and strengthen their supplier-buyer network.
- In-depth analysis of the aluminum welding market segmentation assists to determine the prevailing market opportunities.
- Major countries in each region are mapped according to their revenue contribution to the global market.
- Market player positioning facilitates benchmarking and provides a clear understanding of the present position of the market players.
- The report includes the analysis of the regional as well as global aluminum welding market trends, key players, market segments, application areas, and market growth strategies.
Aluminum Welding Market Report Highlights
| Aspects | Details |
| Market Size By 2030 | USD 6.2 Billion |
| Growth Rate | CAGR of 5.8% |
| Forecast period | 2024 - 2030 |
| Report Pages | 330 |
| By Wire Type |
|
| By Technique |
|
| By End-Use |
|
| By Region |
|
| Key Market Players | Drahtwerk ELISENTAL W. Erdmann GmbH & Co., Safra Spa, Atlantic China Welding Consumables, EWM, ESAB, Mech Static Hydraulics, Anand Arc Ltd., The Lincoln Electric Company, Hermann Fliess and Co. GmbH, Hilarius Haarlem Holland B.V. |
Loading Table Of Content...

