
America Golf Cart Market Outlook - 2026
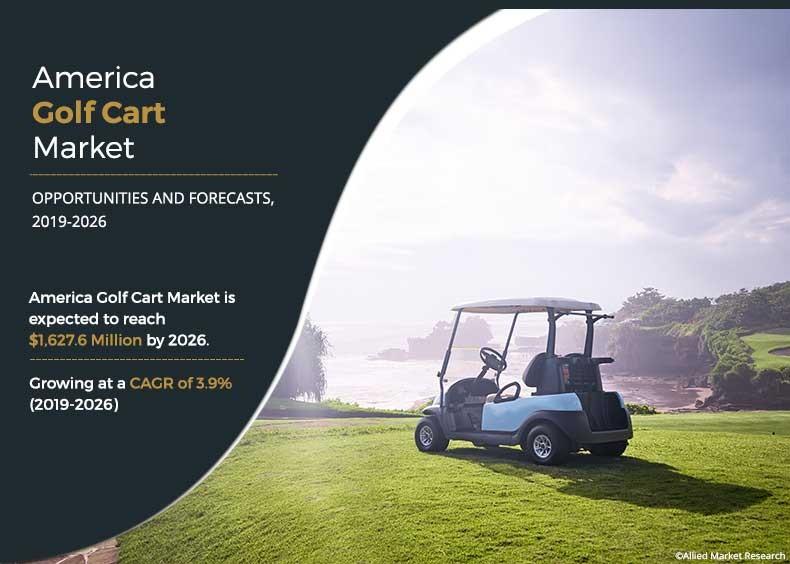
The America golf cart market size was valued at $1,191.2 million in 2018, and is projected to reach at $1,627.6 million by 2026, growing at a CAGR of 3.9% from 2019 to 2026.
Golf cart is a type of low speed vehicle driven by electric motors, which is gas-powered or is specifically envisioned for utilization in golf courses for transportation of golfers and the equipment within the course premises. It is also known as non-highway or off-road vehicle with an average speed between 25 and 50 kmph.
The major companies profiled in the America golf cart market share Club Car (Ingersoll-Rand plc.), Garia, Hitachi Chemical Co., Ltd., Star EV (JH Global Services, Inc.), Columbia Vehicle Group Inc., Evolution Electric Vehicle (HDK electric vehicles), GEM (Polaris Industries Inc.), EZ- GO (Textron Inc.), ICON Electric Vehicles, Yamaha Golf-Car Company, Smart Cart Electric Vehicles, and Bintelli Electric Vehicles.
The America golf cart industry is segmented based on passenger capacity, type, fuel type, application, capacity, and region. Passenger capacity segment includes two passengers, four passengers, six passengers, and eight and more passengers. Based on type, it is bifurcated into open and enclosed. Based on fuel type, the America golf cart market is segmented into gasoline and electric. Based on application, it is categorized into golf course, personal service, and commercial services. Moreover, the commercial services segment is further segmented in to applications such as resorts, rental shuttle or taxi, universities, airports, hospitals, entertainment amusement parks, convention centers, sports stadiums, and zoos. Based on region, the America golf cart market share is analyzed across America.
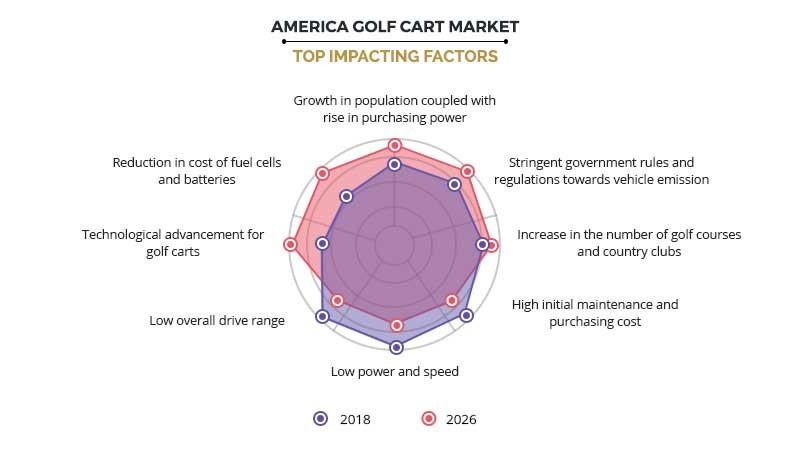
TOP IMPACTING FACTORS
The significant impacting factors in the growth of the America golf cart market include increase in population coupled with rise in purchasing power, stringent government rules and regulations toward vehicle emission, and surge in the number of golf courses and country clubs. In addition, the America golf cart market analysis is influenced by high initial maintenance and purchasing cost, low power and speed, low overall drive range, technological advancement for golf carts, and reduction in cost of fuel cells and batteries. Each of these factors is anticipated to have a definite impact on the America golf cart market during the forecast period.
Growth in population coupled with rise in purchasing power
There has been an increase in the global population; and today, the global population in 2018 has crossed 7.6 billion. Every year, the world population grows approximately by 43 million. This boom in population has created many opportunities for many businesses and this is also true for the America golf cart market. This is owing to the demand for compact and maneuverable vehicles that occupy small parking space. Globalization on the other hand helps organizations develop international influence and this influence has helped change the outlook of different countries and region. Globalization has helped people to vouch for a different and better lifestyle; it has encouraged the people to spend more and get the best service possible. This drives the growth of the America golf cart market.
Stringent government rules and regulations towards vehicle emission
The government all around the world has become very strict regarding the problem of vehicle emission due to its impact on the environment. The U.S., Germany, France, and China have implemented government laws and regulations for vehicular emission and has made it mandatory for the automobile manufacturers to use advanced technologies to combat high emission levels in vehicles. The Program launched by California Air Resources Board (CARB), also includes guidelines for manufacturers to produce and deliver zero-emission vehicles (ZEVs). The ZEV mandate substantially boosts the adoption of electric vehicles. The golf carts are available in two variants, one being gasoline powered and other that runs on electricity. Thus, stringent government rules and regulations towards vehicle emission are driving the growth of the America golf cart market.
Increase in the number of golf courses and country clubs
In America, the U.S. has the maximum number of golf courses which counts around 15,332 followed by other countries such as Canada with 2,363 golf courses, Mexico with around 200, Brazil with 75, and Argentina with 319. The golf industry across the U.S. includes nearly 2 million jobs and the golf game also contributes more to charity than any other major sports industry. More than one-third that is 36% of the U.S. population, is over 107 million people in total who have either played, watched, or read about golf last year in 2018.
A record-tying 2.6 million golfers played for the first time in 2018, matching the all-time high set in 2017, which was the fourth consecutive year that number increased. Increase in the number of golf courses is supported by the rise in number of people, who are have inclined interest toward the golf sport. This directly boosts the growth in demand for golf carts. In addition, there is an increase, though at a slower rate of around 15, in the number of country clubs and golf courses in the U.S. Further, increase in disposable income leads to the rise in expenditure of recreational time and discretionary income of the population. All these factors collectively contribute to the America golf cart market growth.
Key Benefits for America Golf Cart Market:
- This study comprises analytical depiction of the America golf cart market trends with current trends and future estimations to depict the imminent investment pockets.
- The overall potential is determined to understand the profitable trends to gain a stronger foothold.
- The America golf cart market analysis report presents information related to key drivers, restraints, and opportunities with a detailed impact analysis.
- The current growth and forecast is quantitatively analyzed from 2018 to 2026 to benchmark the financial competency.
- Porter’s five forces analysis illustrates the potency of the buyers and suppliers in the industry.
- The study also comprises the America golf cart market opportunity which will help key players in decision making.
- America golf cart market forecast report highlights the potential opportunities for the market expansion.
America Golf Cart Market Report Highlights
| Aspects | Details |
| By Passenger Capacity |
|
| By Capacity |
|
| By Fuel Type |
|
| By Application |
|
| By Region |
|
| Key Market Players | GEM (POLARIS INDUSTRIES INC.), HITACHI CHEMICAL CO., LTD., YAMAHA GOLF-CAR COMPANY, STAR EV (JH GLOBAL SERVICES, INC.), ICON ELECTRIC VEHICLES, SMART CART ELECTRIC VEHICLES, BINTELLI ELECTRIC VEHICLES, GARIA, CLUB CAR (INGERSOLL-RAND PLC,), EZ- GO(TEXTRON INC.), EVOLUTION ELECTRIC VEHICLE ( HDK ELECTRIC VEHICLES) |
Analyst Review
In accordance with the insights by the CXOs of leading companies, the America golf cart market is projected to witness considerable growth, especially in Latin America, owing to growth in population along with increase in globalization and rise in purchasing power. Companies in this industry are adopting various innovative techniques to provide customers with advanced and innovative feature offerings.
Factors such as growth in population coupled with rise in purchasing power, stringent government rules and regulations toward vehicle emission, and increase in number of golf courses and country clubs drive the growth of the market. However, high initial maintenance and purchasing cost, low power & speed, and low overall drive range are expected to hamper the growth of the market. Further, technological advancements for golf carts and reduction in cost of fuel cells as well as batteries are expected to create numerous opportunities for market expansion.
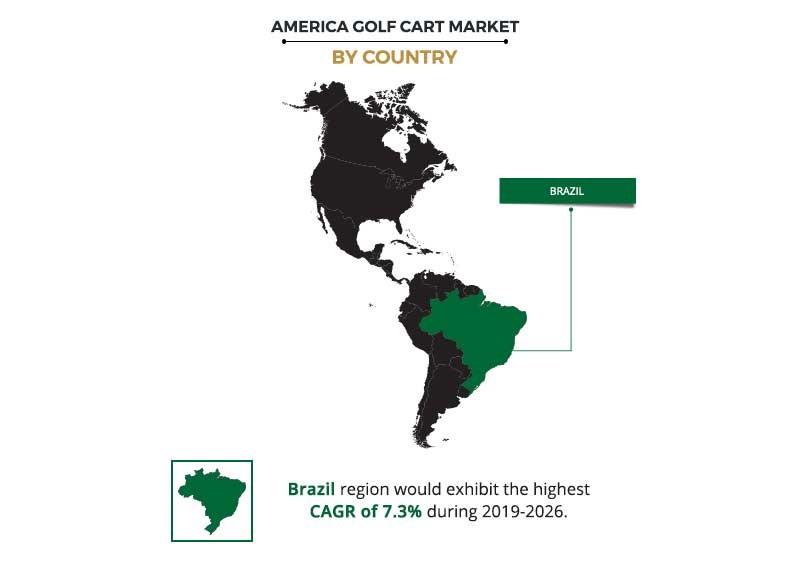
Among the analyzed countries, the U.S. is expected to account for the highest revenue in the market throughout the forecast period (2019-2026) followed by Canada, Mexico, Argentina, Brazil, and others. However, Brazil is expected to experience growth at a higher rate, predicting lucrative opportunities for the key players operating in the America golf cart market
Club Car (Ingersoll-Rand plc,), Garia, Hitachi Chemical Co., Ltd., Star EV (JH Global Services, Inc.), Columbia Vehicle Group Inc., Evolution Electric Vehicle (HDK electric vehicles), GEM (Polaris Industries Inc.), EZ-GO (Textron Inc.), ICON Electric Vehicles, Yamaha Golf-Car Company, Smart Cart Electric Vehicles, and Bintelli Electric Vehicles are the key market players that occupy a significant revenue share in the America golf cart market.
Loading Table Of Content...

