0
Upcoming Allied Market Research
2023
Amphoteric Surfactant Market

Amphoteric Surfactant Market

by Material (Glass, Metal, Plastic, Paper, Others) and by Alcohol (Beer, Wine, Spirits, Others): Global Opportunity Analysis and Industry Forecast, 2023-2032

Report Code: A04738
Nov 2023 | Pages: NA
Tables: NA
Charts: NA
  • Formats*:

  • pdf

    Single User License, Five User
    License & Enterprise User License

  • xls

    Data Pack Excel License

  • ppt

    It comes with the additional cost
    of $2500.00 contact sales.


COVID-19

Pandemic disrupted the entire world and affected many industries.

Get detailed COVID-19 impact analysis on the Amphoteric Surfactant Market

Request Now !

Amphoteric Surfactant Market Overview:

Amphoteric surfactant is a surfactant that simultaneously carries the anionic and cationic hydrophilic group and has the ability to change the charge from cation to anion due to pH change.

The growth of the global amphoteric surfactant market is driven by its increasing demand from end-use industries, such as agrochemicals and personal care. As amphoteric surfactant is one of the main ingredients needed for hair care, skin care, and other personal products, the surge in the personal care industry is anticipated to boost the growth of the global amphoteric surfactant market. Rise in awareness regarding hygiene and skin care, growing urbanization, change in lifestyle, and increase in demand for personal care products are the major factors that driver the growth of the amphoteric surfactant market. However, stringent government regulations toward amphoteric surfactants are expected to restrain the growth of the global market. Increasing demand from niche application such as personal care is expected to provide lucrative opportunities for the growth of the global market.

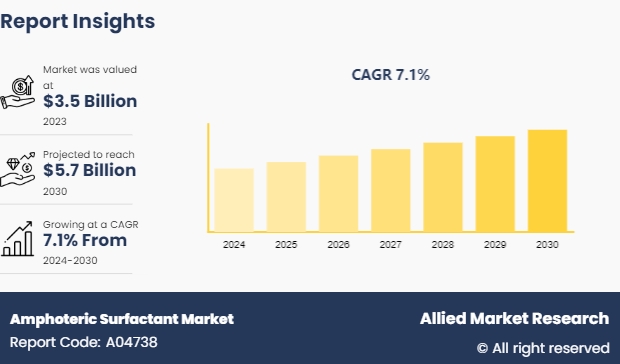
The global amphoteric surfactant market is segmented based on type, application, and region. On the basis of type, it is bifurcated into type betaine, amine oxide, amphoacetates, amphopropionates, and sultaines. By application, the market is divided into personal care, home care and industrial & institutional cleaning, oil field chemicals, agrochemicals, and others. Region wise, the market is analyzed across North America, Europe, Asia-Pacific, and LAMEA.

The key players operating in the market include AkzoNobel N.V., BASF SE, Clariant AG, Croda International plc, Evonik Industries AG, Lonza Group, The Lubrizol Corporation, Oxiteno SA, Solvay, and Stepan Company (US). The other players in the value chain analysis (and not included in the report) include Huntsman Corporation, Oxiteno S.A., AirProducts & Chemicals, Inc., and Pilot Chemical Company.

Key Benefits for Amphoteric Surfactant Market:

  • Porters five forces analysis helps analyze the potential of buyers and suppliers and the competitive scenario of the industry for strategy building.

  • The report outlines the current trends and future scenario of the amphoteric surfactant market to understand the prevailing opportunities and potential investment pockets.

  • An in-depth analysis of the current R&D within the market is provided along with the key dynamic factors.

  • The key drivers, restrains, and opportunities and their detailed impact analysis are elucidated in the study.

  • The profiles of the key players along with their key strategic developments are enlisted in the report.

Amphoteric Surfactant Market Report Highlights

Aspects Details
By Material
  • Glass
  • Metal
  • Plastic
  • Paper
  • Others
By Alcohol
  • Beer
  • Wine
  • Spirits
  • Others
By Region
  • North America  (U.S., Canada, Mexico)
  • Europe  (France, Germany, Italy, Spain, UK, Russia, Rest of Europe)
  • Asia-Pacific  (China, Japan, India, South Korea, Australia, Thailand, Malaysia, Indonesia, Rest of Asia-Pacific)
  • LAMEA  (Brazil, South Africa, Saudi Arabia, UAE, Argentina, Rest of LAMEA)
Key Market Players DS Smith, Owens Illinois, Brick Packaging, LLC., Beatson Clark, Mondi Group, Berry Global Inc., Amcol Plc, Ball Corporation, Crown Holdings, Inc., Gerresheimer AG
 
  • CHAPTER 1: INTRODUCTION

    • 1.1. Report Description

    • 1.2. Key Market Segments

    • 1.3. Key Benefits

    • 1.4. Research Methodology

      • 1.4.1. Primary Research

      • 1.4.2. Secondary Research

      • 1.4.3. Analyst Tools and Models

  • CHAPTER 2: EXECUTIVE SUMMARY

    • 2.1. CXO Perspective

  • CHAPTER 3: MARKET LANDSCAPE

    • 3.1. Market Definition and Scope

    • 3.2. Key Findings

      • 3.2.1. Top Investment Pockets

      • 3.2.2. Top Winning Strategies

    • 3.3. Porter's Five Forces Analysis

      • 3.3.1. Bargaining Power of Suppliers

      • 3.3.2. Threat of New Entrants

      • 3.3.3. Threat of Substitutes

      • 3.3.4. Competitive Rivalry

      • 3.3.5. Bargaining Power among Buyers

    • 3.5. Market Dynamics

      • 3.5.1. Drivers

      • 3.5.2. Restraints

      • 3.5.3. Opportunities

    • 3.6. COVID-19 Impact Analysis

  • CHAPTER 4: AMPHOTERIC SURFACTANT MARKET, BY MATERIAL

    • 4.1. Market Overview

      • 4.1.1 Market Size and Forecast, By Material

    • 4.2. Glass

      • 4.2.1. Key Market Trends, Growth Factors and Opportunities

      • 4.2.2. Market Size and Forecast, By Region

      • 4.2.3. Market Share Analysis, By Country

    • 4.3. Metal

      • 4.3.1. Key Market Trends, Growth Factors and Opportunities

      • 4.3.2. Market Size and Forecast, By Region

      • 4.3.3. Market Share Analysis, By Country

    • 4.4. Plastic

      • 4.4.1. Key Market Trends, Growth Factors and Opportunities

      • 4.4.2. Market Size and Forecast, By Region

      • 4.4.3. Market Share Analysis, By Country

    • 4.5. Paper

      • 4.5.1. Key Market Trends, Growth Factors and Opportunities

      • 4.5.2. Market Size and Forecast, By Region

      • 4.5.3. Market Share Analysis, By Country

    • 4.6. Others

      • 4.6.1. Key Market Trends, Growth Factors and Opportunities

      • 4.6.2. Market Size and Forecast, By Region

      • 4.6.3. Market Share Analysis, By Country

  • CHAPTER 5: AMPHOTERIC SURFACTANT MARKET, BY ALCOHOL

    • 5.1. Market Overview

      • 5.1.1 Market Size and Forecast, By Alcohol

    • 5.2. Beer

      • 5.2.1. Key Market Trends, Growth Factors and Opportunities

      • 5.2.2. Market Size and Forecast, By Region

      • 5.2.3. Market Share Analysis, By Country

    • 5.3. Wine

      • 5.3.1. Key Market Trends, Growth Factors and Opportunities

      • 5.3.2. Market Size and Forecast, By Region

      • 5.3.3. Market Share Analysis, By Country

    • 5.4. Spirits

      • 5.4.1. Key Market Trends, Growth Factors and Opportunities

      • 5.4.2. Market Size and Forecast, By Region

      • 5.4.3. Market Share Analysis, By Country

    • 5.5. Others

      • 5.5.1. Key Market Trends, Growth Factors and Opportunities

      • 5.5.2. Market Size and Forecast, By Region

      • 5.5.3. Market Share Analysis, By Country

  • CHAPTER 6: AMPHOTERIC SURFACTANT MARKET, BY REGION

    • 6.1. Market Overview

      • 6.1.1 Market Size and Forecast, By Region

    • 6.2. North America

      • 6.2.1. Key Market Trends and Opportunities

      • 6.2.2. Market Size and Forecast, By Material

      • 6.2.3. Market Size and Forecast, By Alcohol

      • 6.2.4. Market Size and Forecast, By Country

      • 6.2.5. U.S. Amphoteric Surfactant Market

        • 6.2.5.1. Market Size and Forecast, By Material
        • 6.2.5.2. Market Size and Forecast, By Alcohol
      • 6.2.6. Canada Amphoteric Surfactant Market

        • 6.2.6.1. Market Size and Forecast, By Material
        • 6.2.6.2. Market Size and Forecast, By Alcohol
      • 6.2.7. Mexico Amphoteric Surfactant Market

        • 6.2.7.1. Market Size and Forecast, By Material
        • 6.2.7.2. Market Size and Forecast, By Alcohol
    • 6.3. Europe

      • 6.3.1. Key Market Trends and Opportunities

      • 6.3.2. Market Size and Forecast, By Material

      • 6.3.3. Market Size and Forecast, By Alcohol

      • 6.3.4. Market Size and Forecast, By Country

      • 6.3.5. France Amphoteric Surfactant Market

        • 6.3.5.1. Market Size and Forecast, By Material
        • 6.3.5.2. Market Size and Forecast, By Alcohol
      • 6.3.6. Germany Amphoteric Surfactant Market

        • 6.3.6.1. Market Size and Forecast, By Material
        • 6.3.6.2. Market Size and Forecast, By Alcohol
      • 6.3.7. Italy Amphoteric Surfactant Market

        • 6.3.7.1. Market Size and Forecast, By Material
        • 6.3.7.2. Market Size and Forecast, By Alcohol
      • 6.3.8. Spain Amphoteric Surfactant Market

        • 6.3.8.1. Market Size and Forecast, By Material
        • 6.3.8.2. Market Size and Forecast, By Alcohol
      • 6.3.9. UK Amphoteric Surfactant Market

        • 6.3.9.1. Market Size and Forecast, By Material
        • 6.3.9.2. Market Size and Forecast, By Alcohol
      • 6.3.10. Russia Amphoteric Surfactant Market

        • 6.3.10.1. Market Size and Forecast, By Material
        • 6.3.10.2. Market Size and Forecast, By Alcohol
      • 6.3.11. Rest Of Europe Amphoteric Surfactant Market

        • 6.3.11.1. Market Size and Forecast, By Material
        • 6.3.11.2. Market Size and Forecast, By Alcohol
    • 6.4. Asia-Pacific

      • 6.4.1. Key Market Trends and Opportunities

      • 6.4.2. Market Size and Forecast, By Material

      • 6.4.3. Market Size and Forecast, By Alcohol

      • 6.4.4. Market Size and Forecast, By Country

      • 6.4.5. China Amphoteric Surfactant Market

        • 6.4.5.1. Market Size and Forecast, By Material
        • 6.4.5.2. Market Size and Forecast, By Alcohol
      • 6.4.6. Japan Amphoteric Surfactant Market

        • 6.4.6.1. Market Size and Forecast, By Material
        • 6.4.6.2. Market Size and Forecast, By Alcohol
      • 6.4.7. India Amphoteric Surfactant Market

        • 6.4.7.1. Market Size and Forecast, By Material
        • 6.4.7.2. Market Size and Forecast, By Alcohol
      • 6.4.8. South Korea Amphoteric Surfactant Market

        • 6.4.8.1. Market Size and Forecast, By Material
        • 6.4.8.2. Market Size and Forecast, By Alcohol
      • 6.4.9. Australia Amphoteric Surfactant Market

        • 6.4.9.1. Market Size and Forecast, By Material
        • 6.4.9.2. Market Size and Forecast, By Alcohol
      • 6.4.10. Thailand Amphoteric Surfactant Market

        • 6.4.10.1. Market Size and Forecast, By Material
        • 6.4.10.2. Market Size and Forecast, By Alcohol
      • 6.4.11. Malaysia Amphoteric Surfactant Market

        • 6.4.11.1. Market Size and Forecast, By Material
        • 6.4.11.2. Market Size and Forecast, By Alcohol
      • 6.4.12. Indonesia Amphoteric Surfactant Market

        • 6.4.12.1. Market Size and Forecast, By Material
        • 6.4.12.2. Market Size and Forecast, By Alcohol
      • 6.4.13. Rest of Asia Pacific Amphoteric Surfactant Market

        • 6.4.13.1. Market Size and Forecast, By Material
        • 6.4.13.2. Market Size and Forecast, By Alcohol
    • 6.5. LAMEA

      • 6.5.1. Key Market Trends and Opportunities

      • 6.5.2. Market Size and Forecast, By Material

      • 6.5.3. Market Size and Forecast, By Alcohol

      • 6.5.4. Market Size and Forecast, By Country

      • 6.5.5. Brazil Amphoteric Surfactant Market

        • 6.5.5.1. Market Size and Forecast, By Material
        • 6.5.5.2. Market Size and Forecast, By Alcohol
      • 6.5.6. South Africa Amphoteric Surfactant Market

        • 6.5.6.1. Market Size and Forecast, By Material
        • 6.5.6.2. Market Size and Forecast, By Alcohol
      • 6.5.7. Saudi Arabia Amphoteric Surfactant Market

        • 6.5.7.1. Market Size and Forecast, By Material
        • 6.5.7.2. Market Size and Forecast, By Alcohol
      • 6.5.8. UAE Amphoteric Surfactant Market

        • 6.5.8.1. Market Size and Forecast, By Material
        • 6.5.8.2. Market Size and Forecast, By Alcohol
      • 6.5.9. Argentina Amphoteric Surfactant Market

        • 6.5.9.1. Market Size and Forecast, By Material
        • 6.5.9.2. Market Size and Forecast, By Alcohol
      • 6.5.10. Rest of LAMEA Amphoteric Surfactant Market

        • 6.5.10.1. Market Size and Forecast, By Material
        • 6.5.10.2. Market Size and Forecast, By Alcohol
  • CHAPTER 7: COMPETITIVE LANDSCAPE

    • 7.1. Introduction

    • 7.2. Top Winning Strategies

    • 7.3. Product Mapping Of Top 10 Player

    • 7.4. Competitive Dashboard

    • 7.5. Competitive Heatmap

    • 7.6. Top Player Positioning,2022

  • CHAPTER 8: COMPANY PROFILES

    • 8.1. Amcol Plc

      • 8.1.1. Company Overview

      • 8.1.2. Key Executives

      • 8.1.3. Company Snapshot

      • 8.1.4. Operating Business Segments

      • 8.1.5. Product Portfolio

      • 8.1.6. Business Performance

      • 8.1.7. Key Strategic Moves and Developments

    • 8.2. Ball Corporation

      • 8.2.1. Company Overview

      • 8.2.2. Key Executives

      • 8.2.3. Company Snapshot

      • 8.2.4. Operating Business Segments

      • 8.2.5. Product Portfolio

      • 8.2.6. Business Performance

      • 8.2.7. Key Strategic Moves and Developments

    • 8.3. Beatson Clark

      • 8.3.1. Company Overview

      • 8.3.2. Key Executives

      • 8.3.3. Company Snapshot

      • 8.3.4. Operating Business Segments

      • 8.3.5. Product Portfolio

      • 8.3.6. Business Performance

      • 8.3.7. Key Strategic Moves and Developments

    • 8.4. Berry Global Inc.

      • 8.4.1. Company Overview

      • 8.4.2. Key Executives

      • 8.4.3. Company Snapshot

      • 8.4.4. Operating Business Segments

      • 8.4.5. Product Portfolio

      • 8.4.6. Business Performance

      • 8.4.7. Key Strategic Moves and Developments

    • 8.5. Brick Packaging, LLC.

      • 8.5.1. Company Overview

      • 8.5.2. Key Executives

      • 8.5.3. Company Snapshot

      • 8.5.4. Operating Business Segments

      • 8.5.5. Product Portfolio

      • 8.5.6. Business Performance

      • 8.5.7. Key Strategic Moves and Developments

    • 8.6. Crown Holdings, Inc.

      • 8.6.1. Company Overview

      • 8.6.2. Key Executives

      • 8.6.3. Company Snapshot

      • 8.6.4. Operating Business Segments

      • 8.6.5. Product Portfolio

      • 8.6.6. Business Performance

      • 8.6.7. Key Strategic Moves and Developments

    • 8.7. DS Smith

      • 8.7.1. Company Overview

      • 8.7.2. Key Executives

      • 8.7.3. Company Snapshot

      • 8.7.4. Operating Business Segments

      • 8.7.5. Product Portfolio

      • 8.7.6. Business Performance

      • 8.7.7. Key Strategic Moves and Developments

    • 8.8. Gerresheimer AG

      • 8.8.1. Company Overview

      • 8.8.2. Key Executives

      • 8.8.3. Company Snapshot

      • 8.8.4. Operating Business Segments

      • 8.8.5. Product Portfolio

      • 8.8.6. Business Performance

      • 8.8.7. Key Strategic Moves and Developments

    • 8.9. Mondi Group

      • 8.9.1. Company Overview

      • 8.9.2. Key Executives

      • 8.9.3. Company Snapshot

      • 8.9.4. Operating Business Segments

      • 8.9.5. Product Portfolio

      • 8.9.6. Business Performance

      • 8.9.7. Key Strategic Moves and Developments

    • 8.10. Owens Illinois

      • 8.10.1. Company Overview

      • 8.10.2. Key Executives

      • 8.10.3. Company Snapshot

      • 8.10.4. Operating Business Segments

      • 8.10.5. Product Portfolio

      • 8.10.6. Business Performance

      • 8.10.7. Key Strategic Moves and Developments

  • LIST OF TABLES

  • TABLE 1. GLOBAL AMPHOTERIC SURFACTANT MARKET, BY MATERIAL, 2022-2032 ($MILLION)
  • TABLE 2. GLOBAL AMPHOTERIC SURFACTANT MARKET FOR GLASS, BY REGION, 2022-2032 ($MILLION)
  • TABLE 3. GLOBAL AMPHOTERIC SURFACTANT MARKET FOR METAL, BY REGION, 2022-2032 ($MILLION)
  • TABLE 4. GLOBAL AMPHOTERIC SURFACTANT MARKET FOR PLASTIC, BY REGION, 2022-2032 ($MILLION)
  • TABLE 5. GLOBAL AMPHOTERIC SURFACTANT MARKET FOR PAPER, BY REGION, 2022-2032 ($MILLION)
  • TABLE 6. GLOBAL AMPHOTERIC SURFACTANT MARKET FOR OTHERS, BY REGION, 2022-2032 ($MILLION)
  • TABLE 7. GLOBAL AMPHOTERIC SURFACTANT MARKET, BY ALCOHOL, 2022-2032 ($MILLION)
  • TABLE 8. GLOBAL AMPHOTERIC SURFACTANT MARKET FOR BEER, BY REGION, 2022-2032 ($MILLION)
  • TABLE 9. GLOBAL AMPHOTERIC SURFACTANT MARKET FOR WINE, BY REGION, 2022-2032 ($MILLION)
  • TABLE 10. GLOBAL AMPHOTERIC SURFACTANT MARKET FOR SPIRITS, BY REGION, 2022-2032 ($MILLION)
  • TABLE 11. GLOBAL AMPHOTERIC SURFACTANT MARKET FOR OTHERS, BY REGION, 2022-2032 ($MILLION)
  • TABLE 12. GLOBAL AMPHOTERIC SURFACTANT MARKET, BY REGION, 2022-2032 ($MILLION)
  • TABLE 13. NORTH AMERICA AMPHOTERIC SURFACTANT, BY REGION, 2022-2032 ($MILLION)
  • TABLE 14. NORTH AMERICA AMPHOTERIC SURFACTANT, BY MATERIAL, 2022-2032 ($MILLION)
  • TABLE 15. NORTH AMERICA AMPHOTERIC SURFACTANT, BY ALCOHOL, 2022-2032 ($MILLION)
  • TABLE 16. U.S. AMPHOTERIC SURFACTANT, BY MATERIAL, 2022-2032 ($MILLION)
  • TABLE 17. U.S. AMPHOTERIC SURFACTANT, BY ALCOHOL, 2022-2032 ($MILLION)
  • TABLE 18. CANADA AMPHOTERIC SURFACTANT, BY MATERIAL, 2022-2032 ($MILLION)
  • TABLE 19. CANADA AMPHOTERIC SURFACTANT, BY ALCOHOL, 2022-2032 ($MILLION)
  • TABLE 20. MEXICO AMPHOTERIC SURFACTANT, BY MATERIAL, 2022-2032 ($MILLION)
  • TABLE 21. MEXICO AMPHOTERIC SURFACTANT, BY ALCOHOL, 2022-2032 ($MILLION)
  • TABLE 22. EUROPE AMPHOTERIC SURFACTANT, BY REGION, 2022-2032 ($MILLION)
  • TABLE 23. EUROPE AMPHOTERIC SURFACTANT, BY MATERIAL, 2022-2032 ($MILLION)
  • TABLE 24. EUROPE AMPHOTERIC SURFACTANT, BY ALCOHOL, 2022-2032 ($MILLION)
  • TABLE 25. FRANCE AMPHOTERIC SURFACTANT, BY MATERIAL, 2022-2032 ($MILLION)
  • TABLE 26. FRANCE AMPHOTERIC SURFACTANT, BY ALCOHOL, 2022-2032 ($MILLION)
  • TABLE 27. GERMANY AMPHOTERIC SURFACTANT, BY MATERIAL, 2022-2032 ($MILLION)
  • TABLE 28. GERMANY AMPHOTERIC SURFACTANT, BY ALCOHOL, 2022-2032 ($MILLION)
  • TABLE 29. ITALY AMPHOTERIC SURFACTANT, BY MATERIAL, 2022-2032 ($MILLION)
  • TABLE 30. ITALY AMPHOTERIC SURFACTANT, BY ALCOHOL, 2022-2032 ($MILLION)
  • TABLE 31. SPAIN AMPHOTERIC SURFACTANT, BY MATERIAL, 2022-2032 ($MILLION)
  • TABLE 32. SPAIN AMPHOTERIC SURFACTANT, BY ALCOHOL, 2022-2032 ($MILLION)
  • TABLE 33. UK AMPHOTERIC SURFACTANT, BY MATERIAL, 2022-2032 ($MILLION)
  • TABLE 34. UK AMPHOTERIC SURFACTANT, BY ALCOHOL, 2022-2032 ($MILLION)
  • TABLE 35. RUSSIA AMPHOTERIC SURFACTANT, BY MATERIAL, 2022-2032 ($MILLION)
  • TABLE 36. RUSSIA AMPHOTERIC SURFACTANT, BY ALCOHOL, 2022-2032 ($MILLION)
  • TABLE 37. REST OF EUROPE AMPHOTERIC SURFACTANT, BY MATERIAL, 2022-2032 ($MILLION)
  • TABLE 38. REST OF EUROPE AMPHOTERIC SURFACTANT, BY ALCOHOL, 2022-2032 ($MILLION)
  • TABLE 39. ASIA-PACIFIC AMPHOTERIC SURFACTANT, BY REGION, 2022-2032 ($MILLION)
  • TABLE 40. ASIA-PACIFIC AMPHOTERIC SURFACTANT, BY MATERIAL, 2022-2032 ($MILLION)
  • TABLE 41. ASIA-PACIFIC AMPHOTERIC SURFACTANT, BY ALCOHOL, 2022-2032 ($MILLION)
  • TABLE 42. CHINA AMPHOTERIC SURFACTANT, BY MATERIAL, 2022-2032 ($MILLION)
  • TABLE 43. CHINA AMPHOTERIC SURFACTANT, BY ALCOHOL, 2022-2032 ($MILLION)
  • TABLE 44. JAPAN AMPHOTERIC SURFACTANT, BY MATERIAL, 2022-2032 ($MILLION)
  • TABLE 45. JAPAN AMPHOTERIC SURFACTANT, BY ALCOHOL, 2022-2032 ($MILLION)
  • TABLE 46. INDIA AMPHOTERIC SURFACTANT, BY MATERIAL, 2022-2032 ($MILLION)
  • TABLE 47. INDIA AMPHOTERIC SURFACTANT, BY ALCOHOL, 2022-2032 ($MILLION)
  • TABLE 48. SOUTH KOREA AMPHOTERIC SURFACTANT, BY MATERIAL, 2022-2032 ($MILLION)
  • TABLE 49. SOUTH KOREA AMPHOTERIC SURFACTANT, BY ALCOHOL, 2022-2032 ($MILLION)
  • TABLE 50. AUSTRALIA AMPHOTERIC SURFACTANT, BY MATERIAL, 2022-2032 ($MILLION)
  • TABLE 51. AUSTRALIA AMPHOTERIC SURFACTANT, BY ALCOHOL, 2022-2032 ($MILLION)
  • TABLE 52. THAILAND AMPHOTERIC SURFACTANT, BY MATERIAL, 2022-2032 ($MILLION)
  • TABLE 53. THAILAND AMPHOTERIC SURFACTANT, BY ALCOHOL, 2022-2032 ($MILLION)
  • TABLE 54. MALAYSIA AMPHOTERIC SURFACTANT, BY MATERIAL, 2022-2032 ($MILLION)
  • TABLE 55. MALAYSIA AMPHOTERIC SURFACTANT, BY ALCOHOL, 2022-2032 ($MILLION)
  • TABLE 56. INDONESIA AMPHOTERIC SURFACTANT, BY MATERIAL, 2022-2032 ($MILLION)
  • TABLE 57. INDONESIA AMPHOTERIC SURFACTANT, BY ALCOHOL, 2022-2032 ($MILLION)
  • TABLE 58. REST OF ASIA PACIFIC AMPHOTERIC SURFACTANT, BY MATERIAL, 2022-2032 ($MILLION)
  • TABLE 59. REST OF ASIA PACIFIC AMPHOTERIC SURFACTANT, BY ALCOHOL, 2022-2032 ($MILLION)
  • TABLE 60. LAMEA AMPHOTERIC SURFACTANT, BY REGION, 2022-2032 ($MILLION)
  • TABLE 61. LAMEA AMPHOTERIC SURFACTANT, BY MATERIAL, 2022-2032 ($MILLION)
  • TABLE 62. LAMEA AMPHOTERIC SURFACTANT, BY ALCOHOL, 2022-2032 ($MILLION)
  • TABLE 63. BRAZIL AMPHOTERIC SURFACTANT, BY MATERIAL, 2022-2032 ($MILLION)
  • TABLE 64. BRAZIL AMPHOTERIC SURFACTANT, BY ALCOHOL, 2022-2032 ($MILLION)
  • TABLE 65. SOUTH AFRICA AMPHOTERIC SURFACTANT, BY MATERIAL, 2022-2032 ($MILLION)
  • TABLE 66. SOUTH AFRICA AMPHOTERIC SURFACTANT, BY ALCOHOL, 2022-2032 ($MILLION)
  • TABLE 67. SAUDI ARABIA AMPHOTERIC SURFACTANT, BY MATERIAL, 2022-2032 ($MILLION)
  • TABLE 68. SAUDI ARABIA AMPHOTERIC SURFACTANT, BY ALCOHOL, 2022-2032 ($MILLION)
  • TABLE 69. UAE AMPHOTERIC SURFACTANT, BY MATERIAL, 2022-2032 ($MILLION)
  • TABLE 70. UAE AMPHOTERIC SURFACTANT, BY ALCOHOL, 2022-2032 ($MILLION)
  • TABLE 71. ARGENTINA AMPHOTERIC SURFACTANT, BY MATERIAL, 2022-2032 ($MILLION)
  • TABLE 72. ARGENTINA AMPHOTERIC SURFACTANT, BY ALCOHOL, 2022-2032 ($MILLION)
  • TABLE 73. REST OF LAMEA AMPHOTERIC SURFACTANT, BY MATERIAL, 2022-2032 ($MILLION)
  • TABLE 74. REST OF LAMEA AMPHOTERIC SURFACTANT, BY ALCOHOL, 2022-2032 ($MILLION)
  • TABLE 75. AMCOL PLC: KEY EXECUTIVES
  • TABLE 76. AMCOL PLC: COMPANY SNAPSHOT
  • TABLE 77. AMCOL PLC: OPERATING SEGMENTS
  • TABLE 78. AMCOL PLC: PRODUCT PORTFOLIO
  • TABLE 79. AMCOL PLC: KEY STRATEGIC MOVES AND DEVELOPMENTS
  • TABLE 80. BALL CORPORATION: KEY EXECUTIVES
  • TABLE 81. BALL CORPORATION: COMPANY SNAPSHOT
  • TABLE 82. BALL CORPORATION: OPERATING SEGMENTS
  • TABLE 83. BALL CORPORATION: PRODUCT PORTFOLIO
  • TABLE 84. BALL CORPORATION: KEY STRATEGIC MOVES AND DEVELOPMENTS
  • TABLE 85. BEATSON CLARK: KEY EXECUTIVES
  • TABLE 86. BEATSON CLARK: COMPANY SNAPSHOT
  • TABLE 87. BEATSON CLARK: OPERATING SEGMENTS
  • TABLE 88. BEATSON CLARK: PRODUCT PORTFOLIO
  • TABLE 89. BEATSON CLARK: KEY STRATEGIC MOVES AND DEVELOPMENTS
  • TABLE 90. BERRY GLOBAL INC.: KEY EXECUTIVES
  • TABLE 91. BERRY GLOBAL INC.: COMPANY SNAPSHOT
  • TABLE 92. BERRY GLOBAL INC.: OPERATING SEGMENTS
  • TABLE 93. BERRY GLOBAL INC.: PRODUCT PORTFOLIO
  • TABLE 94. BERRY GLOBAL INC.: KEY STRATEGIC MOVES AND DEVELOPMENTS
  • TABLE 95. BRICK PACKAGING, LLC.: KEY EXECUTIVES
  • TABLE 96. BRICK PACKAGING, LLC.: COMPANY SNAPSHOT
  • TABLE 97. BRICK PACKAGING, LLC.: OPERATING SEGMENTS
  • TABLE 98. BRICK PACKAGING, LLC.: PRODUCT PORTFOLIO
  • TABLE 99. BRICK PACKAGING, LLC.: KEY STRATEGIC MOVES AND DEVELOPMENTS
  • TABLE 100. CROWN HOLDINGS, INC.: KEY EXECUTIVES
  • TABLE 101. CROWN HOLDINGS, INC.: COMPANY SNAPSHOT
  • TABLE 102. CROWN HOLDINGS, INC.: OPERATING SEGMENTS
  • TABLE 103. CROWN HOLDINGS, INC.: PRODUCT PORTFOLIO
  • TABLE 104. CROWN HOLDINGS, INC.: KEY STRATEGIC MOVES AND DEVELOPMENTS
  • TABLE 105. DS SMITH: KEY EXECUTIVES
  • TABLE 106. DS SMITH: COMPANY SNAPSHOT
  • TABLE 107. DS SMITH: OPERATING SEGMENTS
  • TABLE 108. DS SMITH: PRODUCT PORTFOLIO
  • TABLE 109. DS SMITH: KEY STRATEGIC MOVES AND DEVELOPMENTS
  • TABLE 110. GERRESHEIMER AG: KEY EXECUTIVES
  • TABLE 111. GERRESHEIMER AG: COMPANY SNAPSHOT
  • TABLE 112. GERRESHEIMER AG: OPERATING SEGMENTS
  • TABLE 113. GERRESHEIMER AG: PRODUCT PORTFOLIO
  • TABLE 114. GERRESHEIMER AG: KEY STRATEGIC MOVES AND DEVELOPMENTS
  • TABLE 115. MONDI GROUP: KEY EXECUTIVES
  • TABLE 116. MONDI GROUP: COMPANY SNAPSHOT
  • TABLE 117. MONDI GROUP: OPERATING SEGMENTS
  • TABLE 118. MONDI GROUP: PRODUCT PORTFOLIO
  • TABLE 119. MONDI GROUP: KEY STRATEGIC MOVES AND DEVELOPMENTS
  • TABLE 120. OWENS ILLINOIS: KEY EXECUTIVES
  • TABLE 121. OWENS ILLINOIS: COMPANY SNAPSHOT
  • TABLE 122. OWENS ILLINOIS: OPERATING SEGMENTS
  • TABLE 123. OWENS ILLINOIS: PRODUCT PORTFOLIO
  • TABLE 124. OWENS ILLINOIS: KEY STRATEGIC MOVES AND DEVELOPMENTS
  • LIST OF FIGURES

  • FIGURE 1. GLOBAL AMPHOTERIC SURFACTANT MARKET SEGMENTATION
  • FIGURE 2. GLOBAL AMPHOTERIC SURFACTANT MARKET
  • FIGURE 3. SEGMENTATION AMPHOTERIC SURFACTANT MARKET
  • FIGURE 4. TOP INVESTMENT POCKET IN AMPHOTERIC SURFACTANT MARKET
  • FIGURE 5. MODERATE BARGAINING POWER OF BUYERS
  • FIGURE 6. MODERATE BARGAINING POWER OF SUPPLIERS
  • FIGURE 7. MODERATE THREAT OF NEW ENTRANTS
  • FIGURE 8. LOW THREAT OF SUBSTITUTION
  • FIGURE 9. HIGH COMPETITIVE RIVALRY
  • FIGURE 10. OPPORTUNITIES, RESTRAINTS AND DRIVERS: GLOBALAMPHOTERIC SURFACTANT MARKET
  • FIGURE 11. AMPHOTERIC SURFACTANT MARKET SEGMENTATION, BY BY MATERIAL
  • FIGURE 12. AMPHOTERIC SURFACTANT MARKET FOR GLASS, BY COUNTRY, 2022-2032 ($MILLION)
  • FIGURE 13. AMPHOTERIC SURFACTANT MARKET FOR METAL, BY COUNTRY, 2022-2032 ($MILLION)
  • FIGURE 14. AMPHOTERIC SURFACTANT MARKET FOR PLASTIC, BY COUNTRY, 2022-2032 ($MILLION)
  • FIGURE 15. AMPHOTERIC SURFACTANT MARKET FOR PAPER, BY COUNTRY, 2022-2032 ($MILLION)
  • FIGURE 16. AMPHOTERIC SURFACTANT MARKET FOR OTHERS, BY COUNTRY, 2022-2032 ($MILLION)
  • FIGURE 17. AMPHOTERIC SURFACTANT MARKET SEGMENTATION, BY BY ALCOHOL
  • FIGURE 18. AMPHOTERIC SURFACTANT MARKET FOR BEER, BY COUNTRY, 2022-2032 ($MILLION)
  • FIGURE 19. AMPHOTERIC SURFACTANT MARKET FOR WINE, BY COUNTRY, 2022-2032 ($MILLION)
  • FIGURE 20. AMPHOTERIC SURFACTANT MARKET FOR SPIRITS, BY COUNTRY, 2022-2032 ($MILLION)
  • FIGURE 21. AMPHOTERIC SURFACTANT MARKET FOR OTHERS, BY COUNTRY, 2022-2032 ($MILLION)
  • FIGURE 22. TOP WINNING STRATEGIES, BY YEAR, 2020-2022*
  • FIGURE 23. TOP WINNING STRATEGIES, BY DEVELOPMENT, 2020-2022*
  • FIGURE 24. TOP WINNING STRATEGIES, BY COMPANY, 2020-2022*
  • FIGURE 25. PRODUCT MAPPING OF TOP 10 PLAYERS
  • FIGURE 26. COMPETITIVE DASHBOARD
  • FIGURE 27. COMPETITIVE HEATMAP: AMPHOTERIC SURFACTANT MARKET
  • FIGURE 28. Top player positioning, 2022
  • FIGURE 29. AMCOL PLC: NET SALES, 2020-2022 ($MILLION)
  • FIGURE 30. AMCOL PLC: REVENUE SHARE, BY SEGMENT, 2032 (%)
  • FIGURE 31. AMCOL PLC: REVENUE SHARE, BY REGION, 2032 (%)
  • FIGURE 32. BALL CORPORATION: NET SALES, 2020-2022 ($MILLION)
  • FIGURE 33. BALL CORPORATION: REVENUE SHARE, BY SEGMENT, 2032 (%)
  • FIGURE 34. BALL CORPORATION: REVENUE SHARE, BY REGION, 2032 (%)
  • FIGURE 35. BEATSON CLARK: NET SALES, 2020-2022 ($MILLION)
  • FIGURE 36. BEATSON CLARK: REVENUE SHARE, BY SEGMENT, 2032 (%)
  • FIGURE 37. BEATSON CLARK: REVENUE SHARE, BY REGION, 2032 (%)
  • FIGURE 38. BERRY GLOBAL INC.: NET SALES, 2020-2022 ($MILLION)
  • FIGURE 39. BERRY GLOBAL INC.: REVENUE SHARE, BY SEGMENT, 2032 (%)
  • FIGURE 40. BERRY GLOBAL INC.: REVENUE SHARE, BY REGION, 2032 (%)
  • FIGURE 41. BRICK PACKAGING, LLC.: NET SALES, 2020-2022 ($MILLION)
  • FIGURE 42. BRICK PACKAGING, LLC.: REVENUE SHARE, BY SEGMENT, 2032 (%)
  • FIGURE 43. BRICK PACKAGING, LLC.: REVENUE SHARE, BY REGION, 2032 (%)
  • FIGURE 44. CROWN HOLDINGS, INC.: NET SALES, 2020-2022 ($MILLION)
  • FIGURE 45. CROWN HOLDINGS, INC.: REVENUE SHARE, BY SEGMENT, 2032 (%)
  • FIGURE 46. CROWN HOLDINGS, INC.: REVENUE SHARE, BY REGION, 2032 (%)
  • FIGURE 47. DS SMITH: NET SALES, 2020-2022 ($MILLION)
  • FIGURE 48. DS SMITH: REVENUE SHARE, BY SEGMENT, 2032 (%)
  • FIGURE 49. DS SMITH: REVENUE SHARE, BY REGION, 2032 (%)
  • FIGURE 50. GERRESHEIMER AG: NET SALES, 2020-2022 ($MILLION)
  • FIGURE 51. GERRESHEIMER AG: REVENUE SHARE, BY SEGMENT, 2032 (%)
  • FIGURE 52. GERRESHEIMER AG: REVENUE SHARE, BY REGION, 2032 (%)
  • FIGURE 53. MONDI GROUP: NET SALES, 2020-2022 ($MILLION)
  • FIGURE 54. MONDI GROUP: REVENUE SHARE, BY SEGMENT, 2032 (%)
  • FIGURE 55. MONDI GROUP: REVENUE SHARE, BY REGION, 2032 (%)
  • FIGURE 56. OWENS ILLINOIS: NET SALES, 2020-2022 ($MILLION)
  • FIGURE 57. OWENS ILLINOIS: REVENUE SHARE, BY SEGMENT, 2032 (%)
  • FIGURE 58. OWENS ILLINOIS: REVENUE SHARE, BY REGION, 2032 (%)


With collective industry experience of about 200 years of its analysts and experts, Allied Market Research (AMR) encompasses most infallible research methodology for its market intelligence and industry analysis. We do not only engrave the deepest levels of markets but also sneak through its slimmest details for the purpose of our market estimates and forecasts. Our approach helps in building greater market consensus view for size, shape and industry trends within each industry segment. We carefully factor in industry trends and real developments for identifying key growth factors and future course of the market. Our research proceeds are the resultant of high quality data, expert views and analysis and high value independent opinions. Our research process is designed to deliver balanced view of the global markets and allow stakeholders to make informed decisions.

We offer our clients exhaustive research and analysis based on wide variety of factual inputs, which largely include interviews with industry participants, reliable statistics and regional intelligence. Our in-house industry experts play instrumental role in designing analytic tools and models, tailored to the requirements of particular industry segment. These analytical tools and models sanitize the data & statistics and enhance the accuracy of our recommendations and advice. With AMR’s calibrated research process and 360` degree data-evaluation methodology, our clients are assured of receiving:

  • Consistent, valuable, robust and actionable data & analysis that can easily be referenced for strategic business planning
  • Technologically sophisticated and reliable insights through well audited and veracious research methodology
  • Sovereign research proceeds that present a tangible depiction of marketplace


With a strong methodology we are, therefore, confident that our research and analysis are most reliable and guarantees sound business planning.

Secondary research
We refer a broad array of industry sources for our secondary, which typically include; however, not limited to: Company SEC filings, annual reports, company websites, broker & financial reports and investor presentations for competitive scenario and shape of the industry

  • Patent and regulatory databases for understanding of technical & legal developments
  • Scientific and technical writings for product information and related preemptions
  • Regional government and statistical databases for macro analysis
  • Authentic new articles, web-casts and other related releases for market evaluation
  • Internal and external proprietary databases, key market indicators and relevant press releases for market estimates and forecast


Primary research
Our primary research efforts include reaching out participants through mail, tele-conversations, referrals, professional networks and face-to-face interactions. We are also in professional corporate relations with various companies that allow us greater flexibility for reaching out industry participants and commentators for interviews and discussions, fulfilling following functions:

  • Validates and improves the data quality and strengthens research proceeds
  • Further develops analyst team’s market understanding and expertise
  • Supplies authentic information about market size, share, growth and forecasts


Our primary research interview and discussion panels are typically composed of most experienced industry members. These participants include; however, not limited to:

  • Chief executives and VPs of leading corporations specific to industry
  • Product and sales managers or country heads; channel partners and top level distributors; banking, investments and valuation experts Key opinion leaders (KOLs)


Analyst tools and models
AMR has developed set of analyst tools and data models to supplement and expedite the analysis process. Corresponding to markets, where there is significant lack of information and estimates, AMR’s team of experts and analyst develop specific analyst tools and industry models to translate qualitative and quantitative industry indicators into exact industry estimates. These models also allow analysts to examine the prospects and opportunities prevailing in the market to accurately forecast the course of the market.

PURCHASE OPTIONS

Call or Email us

U.S.-Canada Toll-free: +1-800-792-5285
Int'l : +1-503-894-6022
Europe : +44-845-528-1300
Email : help@alliedmarketresearch.com

Looking for Customization?

 Customization Request

Have a Question?

 Speak with Analyst

Any Confusion?

 Inquire Before Buying

Have a glance of the Report

  Enquiry Now

Purchase Full Report of
Amphoteric Surfactant Market

Start reading.
This Report and over 67,071+ more Reports, Available with Avenue Library. T&C*.

  • Online Only
  • $3,690
  • Online cloud access only
  • Restricted print, copy, paste & download
  • Read only
  • Free industry update
    (Within 180 days)
  • Free report update in next update cycle
  • Data Pack
  • $3,840
  • Restricted to one authorized user
  • One print only
  • Available in
    Excel
  • Free industry update
    (Within 180 days)
  •   Free report update in next update cycle
  • Single User
  • $5,820
  • Restricted to one authorized user
  • One print only
  • Available in
    PDF
  • Free industry update
    (Within 180 days)
  •   Free report update in next update cycle
  • Five Users
  • $6,540
  • Limited to five authorized users
  • Print upto five copies
  • Available in
    PDF
  • Free industry update
    (Within 180 days)
  •   Free report update in next update cycle
  • Enterprise
    License/PDF

  • $9,870
  • Unlimited
    within
    company/enterprise
  • Available in Excel & PDF
  • Free industry update
    (Within 180 days)
  •   Free report update in next update cycle
  • Library
    Membership

  • $999 $ 1,175
    Per User/ Per month/ Billed annually
  • Published Content
    E-access
  • Company Profiles
    E-access
  • Newly Added Content Access
  • 10 PDF
    Downloads
  • 5 Excel Data
    Pack Downloads
  • 250 Company Profiles PDF Downloads
  • Buy Now

*Taxes/Fees, if applicable will be added during checkout. All prices in USD

RELATED REPORTS
 

Why Allied Market Research?


Infallible Methodology

To ensure high-level data integrity, accurate analysis, and impeccable forecasts

Analyst Support

For complete satisfaction

Customization

On-demand customization of scope of the report to exactly meet your needs

TARGETED MARKET VIEW

Targeted market view to provide pertinent information and save time of readers

Get fresh content delivered

Get insights on topics that are crucial for your business. Stay abreast of your interest areas.

Get Industry Data Alerts

Why Allied Market Research?

Infallible Methodology

To ensure high-level data integrity, accurate analysis, and impeccable forecasts

Analyst Support

For complete satisfaction

Customization

On-demand customization of scope of the report to exactly meet your needs

TARGETED MARKET VIEW

Targeted market view to provide pertinent information and save time of readers