
Amusement Parks Market Research, 2034
Market Introduction and Definition
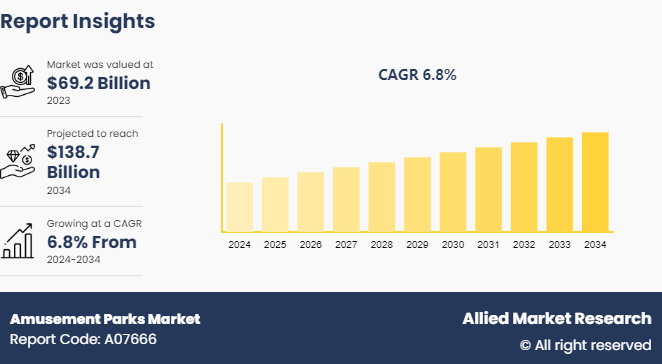
The global Amusement Parks Market Size was valued at $69.2 billion in 2023, and is projected to reach $138.7 billion by 2034, growing at a CAGR of 6.8% from 2024 to 2034. Amusement parks are recreational facilities that offer a variety of entertainment options, including rides, games, shows, and themed attractions. These parks are designed to provide fun and excitement for visitors of all ages through a combination of mechanical rides, such as roller coasters and Ferris wheels, and interactive experiences, such as live performances and themed environments. Amusement parks often feature a range of dining options, shops, and special events, aiming to create a memorable and immersive experience. They are typically organized into distinct areas or zones, each with its own theme or attraction, that caters to diverse interests and preferences. Amusement parks can be standalone entities or part of larger entertainment complexes, integrating various attractions to offer a comprehensive leisure experience.
Key Takeaways
The amusement parks market study covers 20 countries. The research includes a segment analysis of each country in terms of value ($Billion) for the projected period 2024-2034.
More than 1, 500 product literatures, industry releases, annual reports, and other such documents of amusement parks industry participants along with authentic industry journals, trade associations' releases, and government websites have been reviewed for generating high-value industry insights.
The study integrated high-quality data, professional opinions and analysis, and critical independent perspectives. The research approach is intended to provide a balanced view of global markets and to assist stakeholders in making educated decisions in order to achieve their most ambitious growth objectives.
Key Market Dynamics
The growth of franchise-based attractions has significantly boosted market demand in the amusement parks sector by drawing large crowds attracted to beloved characters and stories. Popular franchises like Harry Potter, Star Wars, and Marvel have become major selling points, driving higher visitor numbers. These themed attractions offer immersive experiences that resonate with fans, creating a strong pull for repeat visits and extended stays. Moreover, franchise-based attractions enhance profitability through merchandise sales and exclusive experiences tied to the franchise, increasing per capita spending within the parks. As parks continue to integrate these well-known brands, they tap into a broader audience, including international visitors, expanding their market reach. Thus, the Amusement Parks Market Trends has boosted the overall park attendance. As a result, this trend has strengthened the financial sustainability of the Amusement Parks Market Share.
However, the rise in competition from alternative entertainment options has restrained market demand in the amusement parks sector by offering consumers more diverse and often more accessible leisure activities. Streaming services, video games, and immersive digital experiences provide convenient and cost-effective entertainment, which in turn reduces the frequency of visits to amusement parks, thus having an impact on Amusement Parks Market Growth. These alternatives appeal to a wide audience, particularly younger generations who may prefer digital entertainment over traditional theme park experiences. In addition, the growth of attractions such as indoor entertainment centers, virtual reality arcades, and interactive museums has provided more localized and year-round options. These alternatives can be less expensive and require less time commitment, making them attractive choices for families and individuals.
As a result, the increased competition has put pressure on amusement parks to continuously innovate and justify the higher costs and time investment associated with a park visit, which may lead to slower growth in the amusement market as parks struggle to maintain visitor numbers and profitability. The need for constant innovation can increase operational costs, while the challenge of competing with more accessible entertainment options could limit the appeal of traditional amusement park experiences, thus reducing the Amusement Parks Market Demand.
Furthermore, expansion into untapped regions such as Africa and South America created significant Amusement Parks Market Opportunities by opening new opportunities for growth and diversification. As these regions experience economic development and rising middle-class populations, there is an increase in demand for recreational and leisure activities. Investing in amusement parks in these emerging markets allows companies to capture new customer bases and establish brand presence where few competitors currently operate. Moreover, these regions offer the potential for high returns on investment due to relatively lower establishment costs compared to mature markets. By developing attractions tailored to local preferences and cultural themes, amusement parks can attract both local residents and international tourists, thereby expanding the reach and enhancing overall profitability during the Amusement Parks Market Forecast.
Value Chain Analysis of Global Amusement parks Market

The value chain of an amusement park includes a series of activities that collectively create a seamless entertainment experience for visitors. It starts with design and development, where attractions and themed areas are planned and conceptualized. This is followed by construction and maintenance, involving the building and upkeep of park infrastructure. Operations management ensures the smooth functioning of rides and services. Marketing and sales drive visitor engagement through promotions and ticket sales, while guest services focus on customer support and satisfaction. In addition, food and beverage services provide dining options, and retail operations offer merchandise and souvenirs. Each element in the value chain contributes to delivering a comprehensive and enjoyable park experience, enhancing overall visitor satisfaction and profitability.
Market Segmentation
The global Amusement Parks Market Analysis is done on the basis of type, ride, revenue source, and region. On the basis of type, the market is categorized into theme parks, water parks, adventure parks, and zoo parks. As per ride, the market is classified into mechanical ride, water ride, and others. According to revenue source, it is fragmented into tickets, food & beverage, merchandise, hotel & resorts, and others. Region wise, the hair amusement parks market is analyzed across North America, Europe, Asia-Pacific, and LAMEA.
Regional/Country Market Outlook
The Asia-Pacific region accounted for 45% of global amusement park revenue in 2023, driven by rapid expansion in China and India. The amusement park attendance in China grew by 20% from 2022 to 2023, with new parks such as Universal Beijing Resort attracting over 10 million visitors in 2022.
The Middle East saw significant developments, with projects such as Saudi Arabia's Qiddiya entertainment city attracting an estimated 17 million annual visitors upon completion. Moreover, Dubai Parks and Resorts reported a 25% increase in attendance in 2023, driven by the introduction of new attractions and expanded entertainment offerings.
Industry Trends:
Virtual and augmented reality became increasingly popular in amusement parks, with over 35% of major global parks incorporating VR/AR attractions by 2023. Six Flags, for example, reported a 20% increase in visitor engagement at parks featuring VR-enhanced rides compared to traditional rides. Moreover, by 2024, 75% of leading amusement parks had developed mobile apps that allowed visitors to plan their day, navigate the park, and access personalized content. Disney’s Genie+ app, launched in 2023, was downloaded by 60% of park visitors, with over 50% using it for ride reservations.
Amusement parks increasingly focused on creating immersive environments, with 30% of new park developments in 2023 centered around storytelling and themed experiences. For instance, Disney’s Star Wars: Galaxy’s Edge attracted over 14 million visitors in its first year, highlighting the appeal of immersive, story-driven attractions. In addition, 50% of new attractions in global amusement parks were based on popular movie and game franchises in 2023. Furthermore, Universal Studios reported that their Harry Potter-themed attractions generated 40% higher revenue per visitor compared to non-franchise attractions.
Competitive Landscape
The major players operating in the amusement parks market include Ardent Leisure Group Limited (Coast Entertainment Holdings Limited) , Aspro Parks Inc., Cedar Fair Entertainment Company, Comcast Corporation, Fantawild Holdings Inc., Merlin Entertainments Group, Overseas Chinese Town Limited, SeaWorld Parks & Entertainment (United Parks & Resorts Inc.) , Six Flags Group, and Walt Disney Parks and Resorts Worldwide.
Recent Key Strategies and Developments
In June 2024, Disney introduced a new ticketing system for its amusement parks, allowing visitors to purchase date-specific tickets with dynamic pricing based on demand. The system aimed to better manage crowds and enhance the visitor experience. This move responded to ongoing concerns about overcrowding and long wait times.
In May 2024, Six Flags introduced its latest roller coaster Twisted Mind, at its Texas park, which featured a 360-degree spinning motion and multiple inversions and was designed to provide a unique thrill experience. This new attraction followed the company's strategy of introducing high-adrenaline rides to attract younger audiences.
In April 2024, Universal Studios announced an expansion of its popular Super Nintendo World, adding new attractions based on iconic Nintendo franchises to capitalize on the growing popularity of video game-based attractions. The expansion included a new Donkey Kong-themed area and additional interactive experiences.
In November 2023, Merlin Entertainments opened a new LEGOLAND theme park in Shenzhen, China to expand its foothold is Asia-Pacific market. The park featured themed attractions, rides, and interactive experiences aimed at families with young children.
Key Benefits For Stakeholders
- This report provides a quantitative analysis of the market segments, current trends, estimations, and dynamics of the amusement parks market analysis from 2024 to 2034 to identify the prevailing amusement parks market opportunities.
- The market research is offered along with information related to key drivers, restraints, and opportunities.
- Porter's five forces analysis highlights the potency of buyers and suppliers to enable stakeholders make profit-oriented business decisions and strengthen their supplier-buyer network.
- In-depth analysis of the amusement parks market segmentation assists to determine the prevailing market opportunities.
- Major countries in each region are mapped according to their revenue contribution to the global market.
- Market player positioning facilitates benchmarking and provides a clear understanding of the present position of the market players.
- The report includes the analysis of the regional as well as global amusement parks market trends, key players, market segments, application areas, and market growth strategies.
Amusement Parks Market, by Type Report Highlights
| Aspects | Details |
| Market Size By 2034 | USD 138.7 Billion |
| Growth Rate | CAGR of 6.8% |
| Forecast period | 2024 - 2034 |
| Report Pages | 245 |
| By Type |
|
| By Ride |
|
| By Revenue Source |
|
| By Region |
|
| Key Market Players | Aspro Parks Inc., Overseas Chinese Town Limited, SeaWorld Parks & Entertainment (United Parks & Resorts Inc.), Ardent Leisure Group Limited, Six Flags Group, Fantawild Holdings Inc., Cedar Fair Entertainment Company, Merlin Entertainments Group, Walt Disney Parks and Resorts Worldwide, Comcast Corporation |
Upcoming trends in the global amusement parks market include immersive experiences, virtual reality, sustainable operations, and increased digital engagement.
The leading application of the amusement parks market is entertainment, providing immersive attractions, rides, and experiences for visitors of all ages.
Based on region, North America held the highest market share in terms of revenue in 2023.
The global amusement parks market was valued at $69.2 billion in 2023.
The major players operating in the amusement parks market include Ardent Leisure Group Limited (Coast Entertainment Holdings Limited), Aspro Parks Inc., Cedar Fair Entertainment Company, Comcast Corporation, Fantawild Holdings Inc., Merlin Entertainments Group, Overseas Chinese Town Limited, SeaWorld Parks & Entertainment (United Parks & Resorts Inc.), Six Flags Group, and Walt Disney Parks and Resorts Worldwide.
Loading Table Of Content...

