0
New
New
2023
Animal Model Market

Animal Model Market

by Animal Type (Rat, Mice, Guinea pigs, Rabbits, Others), by Application (Drug discovery and development, Basic research, Others), by End User (Pharma and biotech companies, Academic research institutes, Others): Global Opportunity Analysis and Industry Forecast, 2023-2032

Report Code: A07946
Aug 2023 | Pages: 295
Tables: 135
Charts: 58
  • Formats*:

  • pdf

    Single User License, Five User
    License & Enterprise User License

  • xls

    Data Pack Excel License

  • ppt

    It comes with the additional cost
    of $2500.00 contact sales.


Animal Model Market Research, 2032

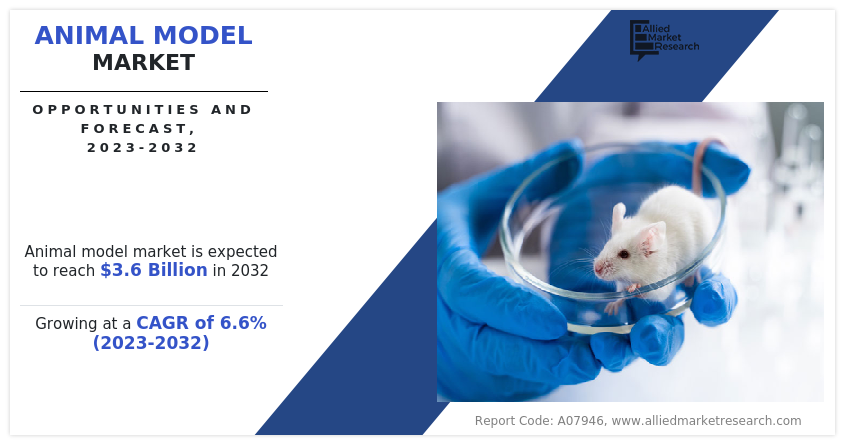
The global animal model market size was valued at $1.9 billion in 2022 and is projected to reach $3.6 billion by 2032, growing at a CAGR of 6.6% from 2023 to 2032. Animal models refer to non-human organism, typically animal, that is used in scientific research to study biological processes, investigate disease mechanisms, develop new treatments, and gain insights into human health and physiology. Animal models play a crucial role in various fields such as medicine, pharmacology, genetics, and toxicology. They provide researchers with a way to understand complex biological systems, test hypotheses, and make predictions before moving on to human studies. 
The 2023 recession has posed significant economic challenges on animal model market. The pharmaceutical and biotechnology industries are major consumers of animal models. During a recession, these industries may face financial pressures, such as reduced investment in new drug development or postponed clinical trials. As a result, the demand for animal models used in preclinical testing declined.

Animal Model Market

Market Dynamics 

The animal model market size is expected to grow significantly, owing to a surge in the usage of animal models in virology and infectious diseases, the physiological similarity of humans and animals for drug testing, an increase in the adoption of CRISPR (clustered regularly interspaced short palindromic repeats) technology. 

Animal models, such as mice, rats, guinea pigs, and non-human primates, play a crucial role in studying the pathogenesis, transmission, and potential treatments for various viral infections and infectious diseases. These models provide researchers with a valuable platform to understand the complex mechanisms of viral replication, host immune responses, and disease progression. 

Animal models have proven to be indispensable tools in virology research, allowing scientists to mimic human infections and assess the efficacy of antiviral drugs and vaccines. For instance, in the case of the COVID-19 pandemic, animal models played a pivotal role in understanding the SARS-CoV-2 virus and evaluating potential therapeutic interventions. Researchers used animal models to study viral entry, replication, and transmission, as well as to assess vaccine candidates and antiviral drugs. These sudies provided critical insights into the virus's behavior and facilitated the development of effective preventive and therapeutic strategies.

Moreover, animal models have been instrumental in investigating other infectious diseases, including influenza, HIV/AIDS, Zika virus, Ebola virus, and hepatitis. For instance, according to a 2022 report by the National Library of Medicines, several small animal models, including mice, Syrian hamsters, guinea pigs, and ferrets are used to study the pathogenicity, transmissibility, and antigenicity of seasonal and pandemic influenza viruses. Mice and ferrets are frequently used for influenza virus research, but Syrian hamsters and guinea pigs are also well-established as small animal models. By escaping the existing immunity in humans, seasonal influenza viruses cause annual epidemics with increases in morbidity and mortality. Suitable animal models are essential to characterize the pathogenicity, transmission, and antigenicity of these viruses and to test novel vaccine preparations and vaccination approaches. Thus, the rise in the prevalence of infectious viral diseases results in a surge in demand for animal models for drug and vaccine development which drive the animal model market growth. 

The physiological similarities between humans and animals have long been recognized as a major driving force behind the use of animal models in drug testing. Animals, particularly mammals, share many fundamental biological systems and processes with humans, making them valuable tools for studying the efficacy and safety of potential pharmaceutical interventions. One of the key physiological similarities between humans and animals is the overall organization and functioning of the major organ systems.

Animals possess cardiovascular, respiratory, digestive, nervous, and endocrine systems that are structurally and functionally similar to those found in humans. This similarity allows researchers to assess the effects of drugs on these systems in animals, providing insights into potential human responses. For instance, according to the Institute of Cancer Research UK, in 2022, 22,991 mice and 98 rats were used in cancer research. Animals are used in cancer research to help understand the mechanisms that underpin cancer, such as the growth and spread of tumors, and to develop new ways of diagnosing, treating, and preventing the disease. Institute of Cancer Research UK majorly uses mice, which can grow tumors that mimic those of human cancer patients. Thus, physiological similarities between humans and animals are a vital factor driving the use of animal models in drug testing and boosting animal model market size. 

In addition, the adoption of CRISPR (clustered regularly interspaced short palindromic repeats) technology has emerged as a significant driver of the animal model market. CRISPR enables researchers to edit specific genes in animals with unprecedented precision, leading to the development of more accurate disease models. By introducing specific mutations associated with human diseases into animal genomes, scientists can mimic the genetic conditions seen in patients, thus enabling a better understanding of disease mechanisms and the evaluation of potential therapeutic interventions.

For instance, according to a 2022 report by the National Library of Medicine, CRISPR has been applied to study cancer because the method allows for many new ways to model the disease. This includes the development of pre-clinical models of cancer, where CRISPR is used to generate mutations that are found in human cancer. Therefore, unique mutations can be studied in a physiologically relevant setting, and CRISPR technology has accelerated the engineering of these models. The developer of CRISPR technology, Emmanuelle Charpentier and Jennifer Doudna was awarded the Nobel Prize in 2020. 

However, the availability of alternative testing methods is expected to act as a significant restraint during the animal model market forecast. Moreover, high growth potential in emerging markets is anticipated to present significant opportunities for market growth during the forecast period.  

The 2023 recession had negative impacts on the animal model industry. Pharmaceutical companies and research institutions are looking for ways to optimize their costs during a recession, which could include consolidating animal model suppliers or reducing the number of animals used in experiments. This led to increased competition among animal model suppliers and potential pricing pressures.

Furthermore, recessionary periods often result in reduced funding for R&D across various sectors. Government agencies, academic institutions, and private companies may face budget cuts, impacting their ability to invest in animal models for research purposes. This reduction in funding could lead to a decline in demand for animal models. However, it is important to note that the animal model market has historically demonstrated resilience, as biomedical research remains a crucial component of scientific advancements. While a recession may temporarily impact the market, the long-term demand for animal models is likely to continue as researchers strive to understand diseases, develop new therapies, and improve human health. 

Segmental Overview 

The global animal model industry is segmented into animal type, application, end-user, and region. On the basis of animal type, the market is categorized into rats, mice, guinea pigs, rabbits, and others. The other segment includes zebrafish, amphibians & reptiles, hamsters, chinchillas, gerbils, and armadillos. By application, the market is divided into drug discovery & development, basic research, and others. The others segment includes medical device development, and production & quality control. Depending on the end-user, the market is segregated into pharma & biotech companies, academic research institutes, and others. Region-wise, the market is analyzed across North America, Europe, Asia-Pacific, and LAMEA. 

By Animal Type  

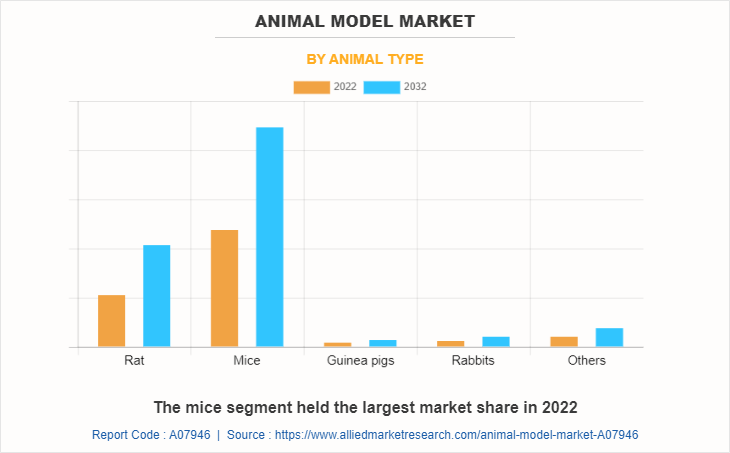
The animal model market is categorized into rat, mice, guinea pigs, rabbits, and others.  The mice segment was the largest revenue contributor to the market in 2022, owing to their amenability to genetic manipulation. However, the rat segment is expected to register the fastest growth, owing to significant genetic similarities between rats and humans, making them suitable for studying various physiological, anatomical, and behavioral aspects. 
Animal Model Market

By Application 

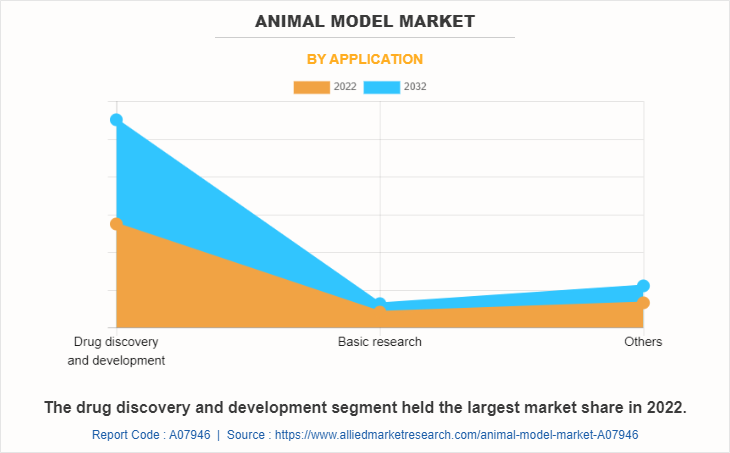
By application, the market is divided into drug discovery & development, basic research, and others. The drug discovery & development segment dominated the global animal model market share in 2022 and is anticipated to continue this trend during the forecast period owing to the high use of animal models during the drug discovery & development process. 
Animal Model Market

By End User 

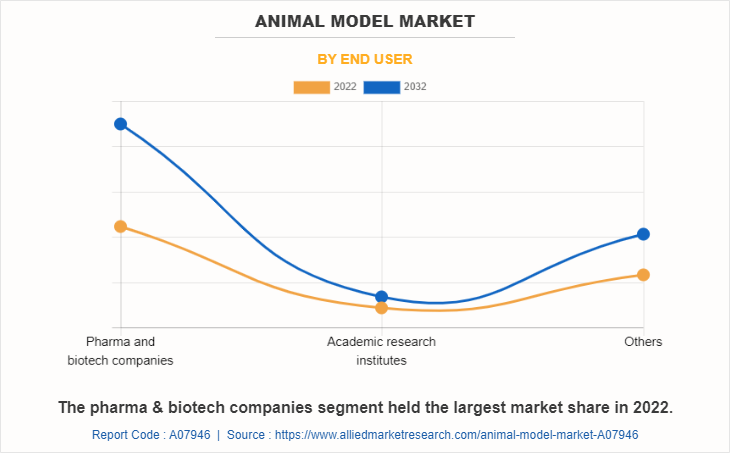
On the basis of end-user, the market is classified into pharma & biotech companies, academic research institutes, and others. The pharma & biotech companies segment dominated the market in 2022 and is expected to remain dominant throughout the forecast period. This is attributed to an increase in the production of novel products, which boosts the need for animal models for clinical trial procedures by pharmaceuticals & biotechnology companies.  
Animal Model Market

By Region 

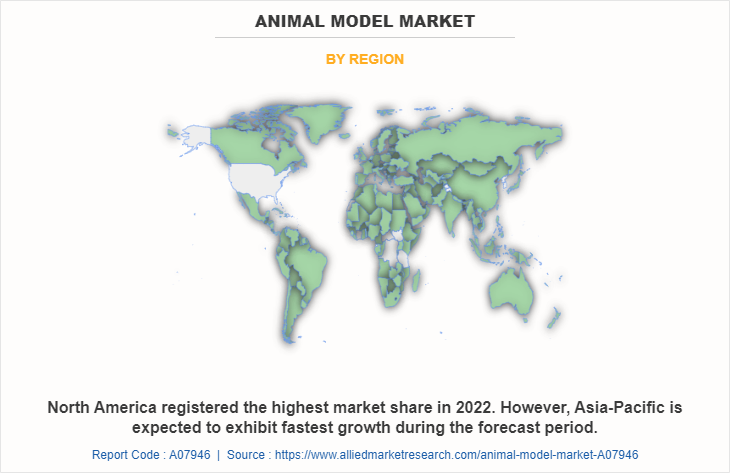
On the basis of region, the animal model market is analyzed across North America, Europe, Asia-Pacific, and LAMEA. On the basis of region, North America has the highest animal model market share in 2022. This is attributed to the high increase in research and development activities by pharma and biotech companies and the strong presence of key market players to provide animal models to meet the demand. However, Asia-Pacific is expected to register a noteworthy CAGR during the forecast period, owing to high research in the field of vaccines. 
Animal Model Market

Competition Analysis 

Competitive analysis and profiles of the major players in the animal model market such as The Jackson Laboratory, Janvier Labs, LLC, Genoway S.A., Hera Biolabs, Crown Bioscience Inc, Ozgene Pty Ltd., Taconic Biosciences, Trans Genic Inc., Inotiv, Inc., and Charles River Laboratories have been provided in the report. Major players have adopted agreements, partnerships, strategic alliances, and product launches as key developmental strategies to improve the product portfolio and gain a strong foothold in the animal model market. 

Recent Agreements in the Animal Model Market 

  • In November 2022, Charles River Laboratories announced that it has signed an agreement to breed, distribute, market, and sell Hera BioLabs' SRG rat to the global preclinical research community. 
  • In June 2021, Genoway S.A. announced that it has entered a non-exclusive license agreement with ERS Genomics Limited. The agreement grants GenOway past and future access to ERS Genomics’ CRISPR/Cas9 patent portfolio 

Recent Partnership in the Animal Model Market  

  • In December 2020, Genoway S.A. announced that it entered into a strategic partnership with Cyagen to commercialize high-standard preclinical humanized immune checkpoint and immunodeficient BRGSF mouse models to nonprofit and for-profit organizations in Asia-Pacific from 2020. 

Recent Strategic Alliance in the Animal Model Market  

  • In September 2022, Genoway S.A. and Sigma-Aldrich Co LLC announced a new structure to their 2018 strategic alliance in the CRISPR/Cas9 field. GenOway will continue leading the commercialization of the Sigma-Aldrich CRISPR patent portfolio in the field of rodent animals. 

Recent Product Launch in the Animal Model Market 

  • In January 2023, Charles River Laboratories announced that it has expanded its triple-immunodeficient mouse model portfolio by introducing two new NCG mouse strains best suited for studies in oncology, immunology, and infectious diseases. 

Key Benefits For Stakeholders

  • This report provides a quantitative analysis of the market segments, current trends, estimations, and dynamics of the animal model market analysis from 2022 to 2032 to identify the prevailing animal model market opportunity.
  • Market research is offered along with information related to key drivers, restraints, and opportunities.
  • Porter's five forces analysis highlights the potency of buyers and suppliers to enable stakeholders to make profit-oriented business decisions and strengthen their supplier-buyer network.
  • An in-depth analysis of the animal model market segmentation assists to determine the prevailing market opportunities.
  • Major countries in each region are mapped according to their revenue contribution to the global market.
  • Market player positioning facilitates benchmarking and provides a clear understanding of the present position of the market players.
  • The report includes an analysis of the regional as well as global animal model market trends, key players, market segments, application areas, and market growth strategies.

Animal Model Market Report Highlights

Aspects Details
Market Size By 2032 USD 3.6 billion
Growth Rate CAGR of 6.6%
Forecast period 2022 - 2032
Report Pages 295
By Animal Type
  • Rat
  • Mice
  • Guinea pigs
  • Rabbits
  • Others
By Application
  • Drug discovery and development
  • Basic research
  • Others
By End User
  • Others
  • Pharma and biotech companies
  • Academic research institutes
By Region
  • North America  (U.S., Canada, Mexico)
  • Europe  (Germany, France, UK, Italy, Spain, Rest of Europe)
  • Asia-Pacific  (Japan, China, Australia, India, South Korea, Rest of Asia-Pacific)
  • LAMEA  (Brazil, Saudi Arabia, South Africa, Rest of LAMEA)
Key Market Players Charles River Laboratories, Ozgene Pty Ltd., Inotiv, Inc., Crown Bioscience Inc., Genoway S.A., The Jackson Laboratory., Hera Biolabs, Taconic Biosciences, Trans Genic Inc., Janvier Labs, LLC
 
  • CHAPTER 1: INTRODUCTION

    • 1.1. Report description

    • 1.2. Key market segments

    • 1.3. Key benefits to the stakeholders

    • 1.4. Research Methodology

      • 1.4.1. Primary research

      • 1.4.2. Secondary research

      • 1.4.3. Analyst tools and models

  • CHAPTER 2: EXECUTIVE SUMMARY

    • 2.1. CXO Perspective

  • CHAPTER 3: MARKET OVERVIEW

    • 3.1. Market definition and scope

    • 3.2. Key findings

      • 3.2.1. Top impacting factors

      • 3.2.2. Top investment pockets

    • 3.3. Porter’s five forces analysis

      • 3.3.1. Low bargaining power of suppliers

      • 3.3.2. Low threat of new entrants

      • 3.3.3. Low threat of substitutes

      • 3.3.4. Low intensity of rivalry

      • 3.3.5. Low bargaining power of buyers

    • 3.4. Market dynamics

      • 3.4.1. Drivers

        • 3.4.1.1. Rise in usage of animal models in virology and infectious diseases
        • 3.4.1.2. Physiological similarity of humans and animals for drug testing
        • 3.4.1.3. Increase in adoption of CRISPR technology
      • 3.4.2. Restraints

        • 3.4.2.1. Availability of alternative testing methods
      • 3.4.3. Opportunities

        • 3.4.3.1. Growth opportunities in emerging markets
  • CHAPTER 4: ANIMAL MODEL MARKET, BY ANIMAL TYPE

    • 4.1. Overview

      • 4.1.1. Market size and forecast

    • 4.2. Rat

      • 4.2.1. Key market trends, growth factors and opportunities

      • 4.2.2. Market size and forecast, by region

      • 4.2.3. Market share analysis by country

    • 4.3. Mice

      • 4.3.1. Key market trends, growth factors and opportunities

      • 4.3.2. Market size and forecast, by region

      • 4.3.3. Market share analysis by country

    • 4.4. Guinea pigs

      • 4.4.1. Key market trends, growth factors and opportunities

      • 4.4.2. Market size and forecast, by region

      • 4.4.3. Market share analysis by country

    • 4.5. Rabbits

      • 4.5.1. Key market trends, growth factors and opportunities

      • 4.5.2. Market size and forecast, by region

      • 4.5.3. Market share analysis by country

    • 4.6. Others

      • 4.6.1. Key market trends, growth factors and opportunities

      • 4.6.2. Market size and forecast, by region

      • 4.6.3. Market share analysis by country

  • CHAPTER 5: ANIMAL MODEL MARKET, BY APPLICATION

    • 5.1. Overview

      • 5.1.1. Market size and forecast

    • 5.2. Drug discovery and development

      • 5.2.1. Key market trends, growth factors and opportunities

      • 5.2.2. Market size and forecast, by region

      • 5.2.3. Market share analysis by country

    • 5.3. Basic research

      • 5.3.1. Key market trends, growth factors and opportunities

      • 5.3.2. Market size and forecast, by region

      • 5.3.3. Market share analysis by country

    • 5.4. Others

      • 5.4.1. Key market trends, growth factors and opportunities

      • 5.4.2. Market size and forecast, by region

      • 5.4.3. Market share analysis by country

  • CHAPTER 6: ANIMAL MODEL MARKET, BY END USER

    • 6.1. Overview

      • 6.1.1. Market size and forecast

    • 6.2. Pharma and biotech companies

      • 6.2.1. Key market trends, growth factors and opportunities

      • 6.2.2. Market size and forecast, by region

      • 6.2.3. Market share analysis by country

    • 6.3. Academic research institutes

      • 6.3.1. Key market trends, growth factors and opportunities

      • 6.3.2. Market size and forecast, by region

      • 6.3.3. Market share analysis by country

    • 6.4. Others

      • 6.4.1. Key market trends, growth factors and opportunities

      • 6.4.2. Market size and forecast, by region

      • 6.4.3. Market share analysis by country

  • CHAPTER 7: ANIMAL MODEL MARKET, BY REGION

    • 7.1. Overview

      • 7.1.1. Market size and forecast By Region

    • 7.2. North America

      • 7.2.1. Key market trends, growth factors and opportunities

      • 7.2.2. Market size and forecast, by Animal Type

      • 7.2.3. Market size and forecast, by Application

      • 7.2.4. Market size and forecast, by End User

      • 7.2.5. Market size and forecast, by country

        • 7.2.5.1. U.S.
          • 7.2.5.1.1. Market size and forecast, by Animal Type
          • 7.2.5.1.2. Market size and forecast, by Application
          • 7.2.5.1.3. Market size and forecast, by End User
        • 7.2.5.2. Canada
          • 7.2.5.2.1. Market size and forecast, by Animal Type
          • 7.2.5.2.2. Market size and forecast, by Application
          • 7.2.5.2.3. Market size and forecast, by End User
        • 7.2.5.3. Mexico
          • 7.2.5.3.1. Market size and forecast, by Animal Type
          • 7.2.5.3.2. Market size and forecast, by Application
          • 7.2.5.3.3. Market size and forecast, by End User
    • 7.3. Europe

      • 7.3.1. Key market trends, growth factors and opportunities

      • 7.3.2. Market size and forecast, by Animal Type

      • 7.3.3. Market size and forecast, by Application

      • 7.3.4. Market size and forecast, by End User

      • 7.3.5. Market size and forecast, by country

        • 7.3.5.1. Germany
          • 7.3.5.1.1. Market size and forecast, by Animal Type
          • 7.3.5.1.2. Market size and forecast, by Application
          • 7.3.5.1.3. Market size and forecast, by End User
        • 7.3.5.2. France
          • 7.3.5.2.1. Market size and forecast, by Animal Type
          • 7.3.5.2.2. Market size and forecast, by Application
          • 7.3.5.2.3. Market size and forecast, by End User
        • 7.3.5.3. UK
          • 7.3.5.3.1. Market size and forecast, by Animal Type
          • 7.3.5.3.2. Market size and forecast, by Application
          • 7.3.5.3.3. Market size and forecast, by End User
        • 7.3.5.4. Italy
          • 7.3.5.4.1. Market size and forecast, by Animal Type
          • 7.3.5.4.2. Market size and forecast, by Application
          • 7.3.5.4.3. Market size and forecast, by End User
        • 7.3.5.5. Spain
          • 7.3.5.5.1. Market size and forecast, by Animal Type
          • 7.3.5.5.2. Market size and forecast, by Application
          • 7.3.5.5.3. Market size and forecast, by End User
        • 7.3.5.6. Rest of Europe
          • 7.3.5.6.1. Market size and forecast, by Animal Type
          • 7.3.5.6.2. Market size and forecast, by Application
          • 7.3.5.6.3. Market size and forecast, by End User
    • 7.4. Asia-Pacific

      • 7.4.1. Key market trends, growth factors and opportunities

      • 7.4.2. Market size and forecast, by Animal Type

      • 7.4.3. Market size and forecast, by Application

      • 7.4.4. Market size and forecast, by End User

      • 7.4.5. Market size and forecast, by country

        • 7.4.5.1. Japan
          • 7.4.5.1.1. Market size and forecast, by Animal Type
          • 7.4.5.1.2. Market size and forecast, by Application
          • 7.4.5.1.3. Market size and forecast, by End User
        • 7.4.5.2. China
          • 7.4.5.2.1. Market size and forecast, by Animal Type
          • 7.4.5.2.2. Market size and forecast, by Application
          • 7.4.5.2.3. Market size and forecast, by End User
        • 7.4.5.3. Australia
          • 7.4.5.3.1. Market size and forecast, by Animal Type
          • 7.4.5.3.2. Market size and forecast, by Application
          • 7.4.5.3.3. Market size and forecast, by End User
        • 7.4.5.4. India
          • 7.4.5.4.1. Market size and forecast, by Animal Type
          • 7.4.5.4.2. Market size and forecast, by Application
          • 7.4.5.4.3. Market size and forecast, by End User
        • 7.4.5.5. South Korea
          • 7.4.5.5.1. Market size and forecast, by Animal Type
          • 7.4.5.5.2. Market size and forecast, by Application
          • 7.4.5.5.3. Market size and forecast, by End User
        • 7.4.5.6. Rest of Asia-Pacific
          • 7.4.5.6.1. Market size and forecast, by Animal Type
          • 7.4.5.6.2. Market size and forecast, by Application
          • 7.4.5.6.3. Market size and forecast, by End User
    • 7.5. LAMEA

      • 7.5.1. Key market trends, growth factors and opportunities

      • 7.5.2. Market size and forecast, by Animal Type

      • 7.5.3. Market size and forecast, by Application

      • 7.5.4. Market size and forecast, by End User

      • 7.5.5. Market size and forecast, by country

        • 7.5.5.1. Brazil
          • 7.5.5.1.1. Market size and forecast, by Animal Type
          • 7.5.5.1.2. Market size and forecast, by Application
          • 7.5.5.1.3. Market size and forecast, by End User
        • 7.5.5.2. Saudi Arabia
          • 7.5.5.2.1. Market size and forecast, by Animal Type
          • 7.5.5.2.2. Market size and forecast, by Application
          • 7.5.5.2.3. Market size and forecast, by End User
        • 7.5.5.3. South Africa
          • 7.5.5.3.1. Market size and forecast, by Animal Type
          • 7.5.5.3.2. Market size and forecast, by Application
          • 7.5.5.3.3. Market size and forecast, by End User
        • 7.5.5.4. Rest of LAMEA
          • 7.5.5.4.1. Market size and forecast, by Animal Type
          • 7.5.5.4.2. Market size and forecast, by Application
          • 7.5.5.4.3. Market size and forecast, by End User
  • CHAPTER 8: COMPETITIVE LANDSCAPE

    • 8.1. Introduction

    • 8.2. Top winning strategies

    • 8.3. Product Mapping of Top 10 Player

    • 8.4. Competitive Dashboard

    • 8.5. Competitive Heatmap

    • 8.6. Top player positioning, 2022

  • CHAPTER 9: COMPANY PROFILES

    • 9.1. Charles River Laboratories

      • 9.1.1. Company overview

      • 9.1.2. Key Executives

      • 9.1.3. Company snapshot

      • 9.1.4. Operating business segments

      • 9.1.5. Product portfolio

      • 9.1.6. Business performance

      • 9.1.7. Key strategic moves and developments

    • 9.2. Inotiv, Inc.

      • 9.2.1. Company overview

      • 9.2.2. Key Executives

      • 9.2.3. Company snapshot

      • 9.2.4. Operating business segments

      • 9.2.5. Product portfolio

      • 9.2.6. Business performance

    • 9.3. Genoway S.A.

      • 9.3.1. Company overview

      • 9.3.2. Key Executives

      • 9.3.3. Company snapshot

      • 9.3.4. Operating business segments

      • 9.3.5. Product portfolio

      • 9.3.6. Key strategic moves and developments

    • 9.4. Hera Biolabs

      • 9.4.1. Company overview

      • 9.4.2. Key Executives

      • 9.4.3. Company snapshot

      • 9.4.4. Operating business segments

      • 9.4.5. Product portfolio

    • 9.5. Crown Bioscience Inc.

      • 9.5.1. Company overview

      • 9.5.2. Key Executives

      • 9.5.3. Company snapshot

      • 9.5.4. Operating business segments

      • 9.5.5. Product portfolio

    • 9.6. Ozgene Pty Ltd.

      • 9.6.1. Company overview

      • 9.6.2. Key Executives

      • 9.6.3. Company snapshot

      • 9.6.4. Operating business segments

      • 9.6.5. Product portfolio

    • 9.7. Taconic Biosciences

      • 9.7.1. Company overview

      • 9.7.2. Key Executives

      • 9.7.3. Company snapshot

      • 9.7.4. Operating business segments

      • 9.7.5. Product portfolio

      • 9.7.6. Key strategic moves and developments

    • 9.8. The Jackson Laboratory.

      • 9.8.1. Company overview

      • 9.8.2. Key Executives

      • 9.8.3. Company snapshot

      • 9.8.4. Operating business segments

      • 9.8.5. Product portfolio

    • 9.9. Trans Genic Inc.

      • 9.9.1. Company overview

      • 9.9.2. Key Executives

      • 9.9.3. Company snapshot

      • 9.9.4. Operating business segments

      • 9.9.5. Product portfolio

      • 9.9.6. Business performance

    • 9.10. Janvier Labs, LLC

      • 9.10.1. Company overview

      • 9.10.2. Key Executives

      • 9.10.3. Company snapshot

      • 9.10.4. Operating business segments

      • 9.10.5. Product portfolio

  • LIST OF TABLES

  • TABLE 01. GLOBAL ANIMAL MODEL MARKET, BY ANIMAL TYPE, 2022-2032 ($MILLION)
    TABLE 02. ANIMAL MODEL MARKET FOR RAT, BY REGION, 2022-2032 ($MILLION)
    TABLE 03. ANIMAL MODEL MARKET FOR MICE, BY REGION, 2022-2032 ($MILLION)
    TABLE 04. ANIMAL MODEL MARKET FOR GUINEA PIGS, BY REGION, 2022-2032 ($MILLION)
    TABLE 05. ANIMAL MODEL MARKET FOR RABBITS, BY REGION, 2022-2032 ($MILLION)
    TABLE 06. ANIMAL MODEL MARKET FOR OTHERS, BY REGION, 2022-2032 ($MILLION)
    TABLE 07. GLOBAL ANIMAL MODEL MARKET, BY APPLICATION, 2022-2032 ($MILLION)
    TABLE 08. ANIMAL MODEL MARKET FOR DRUG DISCOVERY AND DEVELOPMENT, BY REGION, 2022-2032 ($MILLION)
    TABLE 09. ANIMAL MODEL MARKET FOR BASIC RESEARCH, BY REGION, 2022-2032 ($MILLION)
    TABLE 10. ANIMAL MODEL MARKET FOR OTHERS, BY REGION, 2022-2032 ($MILLION)
    TABLE 11. GLOBAL ANIMAL MODEL MARKET, BY END USER, 2022-2032 ($MILLION)
    TABLE 12. ANIMAL MODEL MARKET FOR PHARMA AND BIOTECH COMPANIES, BY REGION, 2022-2032 ($MILLION)
    TABLE 13. ANIMAL MODEL MARKET FOR ACADEMIC RESEARCH INSTITUTES, BY REGION, 2022-2032 ($MILLION)
    TABLE 14. ANIMAL MODEL MARKET FOR OTHERS, BY REGION, 2022-2032 ($MILLION)
    TABLE 15. ANIMAL MODEL MARKET, BY REGION, 2022-2032 ($MILLION)
    TABLE 16. NORTH AMERICA ANIMAL MODEL MARKET, BY ANIMAL TYPE, 2022-2032 ($MILLION)
    TABLE 17. NORTH AMERICA ANIMAL MODEL MARKET, BY APPLICATION, 2022-2032 ($MILLION)
    TABLE 18. NORTH AMERICA ANIMAL MODEL MARKET, BY END USER, 2022-2032 ($MILLION)
    TABLE 19. NORTH AMERICA ANIMAL MODEL MARKET, BY COUNTRY, 2022-2032 ($MILLION)
    TABLE 20. U.S. ANIMAL MODEL MARKET, BY ANIMAL TYPE, 2022-2032 ($MILLION)
    TABLE 21. U.S. ANIMAL MODEL MARKET, BY APPLICATION, 2022-2032 ($MILLION)
    TABLE 22. U.S. ANIMAL MODEL MARKET, BY END USER, 2022-2032 ($MILLION)
    TABLE 23. CANADA ANIMAL MODEL MARKET, BY ANIMAL TYPE, 2022-2032 ($MILLION)
    TABLE 24. CANADA ANIMAL MODEL MARKET, BY APPLICATION, 2022-2032 ($MILLION)
    TABLE 25. CANADA ANIMAL MODEL MARKET, BY END USER, 2022-2032 ($MILLION)
    TABLE 26. MEXICO ANIMAL MODEL MARKET, BY ANIMAL TYPE, 2022-2032 ($MILLION)
    TABLE 27. MEXICO ANIMAL MODEL MARKET, BY APPLICATION, 2022-2032 ($MILLION)
    TABLE 28. MEXICO ANIMAL MODEL MARKET, BY END USER, 2022-2032 ($MILLION)
    TABLE 29. EUROPE ANIMAL MODEL MARKET, BY ANIMAL TYPE, 2022-2032 ($MILLION)
    TABLE 30. EUROPE ANIMAL MODEL MARKET, BY APPLICATION, 2022-2032 ($MILLION)
    TABLE 31. EUROPE ANIMAL MODEL MARKET, BY END USER, 2022-2032 ($MILLION)
    TABLE 32. EUROPE ANIMAL MODEL MARKET, BY COUNTRY, 2022-2032 ($MILLION)
    TABLE 33. GERMANY ANIMAL MODEL MARKET, BY ANIMAL TYPE, 2022-2032 ($MILLION)
    TABLE 34. GERMANY ANIMAL MODEL MARKET, BY APPLICATION, 2022-2032 ($MILLION)
    TABLE 35. GERMANY ANIMAL MODEL MARKET, BY END USER, 2022-2032 ($MILLION)
    TABLE 36. FRANCE ANIMAL MODEL MARKET, BY ANIMAL TYPE, 2022-2032 ($MILLION)
    TABLE 37. FRANCE ANIMAL MODEL MARKET, BY APPLICATION, 2022-2032 ($MILLION)
    TABLE 38. FRANCE ANIMAL MODEL MARKET, BY END USER, 2022-2032 ($MILLION)
    TABLE 39. UK ANIMAL MODEL MARKET, BY ANIMAL TYPE, 2022-2032 ($MILLION)
    TABLE 40. UK ANIMAL MODEL MARKET, BY APPLICATION, 2022-2032 ($MILLION)
    TABLE 41. UK ANIMAL MODEL MARKET, BY END USER, 2022-2032 ($MILLION)
    TABLE 42. ITALY ANIMAL MODEL MARKET, BY ANIMAL TYPE, 2022-2032 ($MILLION)
    TABLE 43. ITALY ANIMAL MODEL MARKET, BY APPLICATION, 2022-2032 ($MILLION)
    TABLE 44. ITALY ANIMAL MODEL MARKET, BY END USER, 2022-2032 ($MILLION)
    TABLE 45. SPAIN ANIMAL MODEL MARKET, BY ANIMAL TYPE, 2022-2032 ($MILLION)
    TABLE 46. SPAIN ANIMAL MODEL MARKET, BY APPLICATION, 2022-2032 ($MILLION)
    TABLE 47. SPAIN ANIMAL MODEL MARKET, BY END USER, 2022-2032 ($MILLION)
    TABLE 48. REST OF EUROPE ANIMAL MODEL MARKET, BY ANIMAL TYPE, 2022-2032 ($MILLION)
    TABLE 49. REST OF EUROPE ANIMAL MODEL MARKET, BY APPLICATION, 2022-2032 ($MILLION)
    TABLE 50. REST OF EUROPE ANIMAL MODEL MARKET, BY END USER, 2022-2032 ($MILLION)
    TABLE 51. ASIA-PACIFIC ANIMAL MODEL MARKET, BY ANIMAL TYPE, 2022-2032 ($MILLION)
    TABLE 52. ASIA-PACIFIC ANIMAL MODEL MARKET, BY APPLICATION, 2022-2032 ($MILLION)
    TABLE 53. ASIA-PACIFIC ANIMAL MODEL MARKET, BY END USER, 2022-2032 ($MILLION)
    TABLE 54. ASIA-PACIFIC ANIMAL MODEL MARKET, BY COUNTRY, 2022-2032 ($MILLION)
    TABLE 55. JAPAN ANIMAL MODEL MARKET, BY ANIMAL TYPE, 2022-2032 ($MILLION)
    TABLE 56. JAPAN ANIMAL MODEL MARKET, BY APPLICATION, 2022-2032 ($MILLION)
    TABLE 57. JAPAN ANIMAL MODEL MARKET, BY END USER, 2022-2032 ($MILLION)
    TABLE 58. CHINA ANIMAL MODEL MARKET, BY ANIMAL TYPE, 2022-2032 ($MILLION)
    TABLE 59. CHINA ANIMAL MODEL MARKET, BY APPLICATION, 2022-2032 ($MILLION)
    TABLE 60. CHINA ANIMAL MODEL MARKET, BY END USER, 2022-2032 ($MILLION)
    TABLE 61. AUSTRALIA ANIMAL MODEL MARKET, BY ANIMAL TYPE, 2022-2032 ($MILLION)
    TABLE 62. AUSTRALIA ANIMAL MODEL MARKET, BY APPLICATION, 2022-2032 ($MILLION)
    TABLE 63. AUSTRALIA ANIMAL MODEL MARKET, BY END USER, 2022-2032 ($MILLION)
    TABLE 64. INDIA ANIMAL MODEL MARKET, BY ANIMAL TYPE, 2022-2032 ($MILLION)
    TABLE 65. INDIA ANIMAL MODEL MARKET, BY APPLICATION, 2022-2032 ($MILLION)
    TABLE 66. INDIA ANIMAL MODEL MARKET, BY END USER, 2022-2032 ($MILLION)
    TABLE 67. SOUTH KOREA ANIMAL MODEL MARKET, BY ANIMAL TYPE, 2022-2032 ($MILLION)
    TABLE 68. SOUTH KOREA ANIMAL MODEL MARKET, BY APPLICATION, 2022-2032 ($MILLION)
    TABLE 69. SOUTH KOREA ANIMAL MODEL MARKET, BY END USER, 2022-2032 ($MILLION)
    TABLE 70. REST OF ASIA-PACIFIC ANIMAL MODEL MARKET, BY ANIMAL TYPE, 2022-2032 ($MILLION)
    TABLE 71. REST OF ASIA-PACIFIC ANIMAL MODEL MARKET, BY APPLICATION, 2022-2032 ($MILLION)
    TABLE 72. REST OF ASIA-PACIFIC ANIMAL MODEL MARKET, BY END USER, 2022-2032 ($MILLION)
    TABLE 73. LAMEA ANIMAL MODEL MARKET, BY ANIMAL TYPE, 2022-2032 ($MILLION)
    TABLE 74. LAMEA ANIMAL MODEL MARKET, BY APPLICATION, 2022-2032 ($MILLION)
    TABLE 75. LAMEA ANIMAL MODEL MARKET, BY END USER, 2022-2032 ($MILLION)
    TABLE 76. LAMEA ANIMAL MODEL MARKET, BY COUNTRY, 2022-2032 ($MILLION)
    TABLE 77. BRAZIL ANIMAL MODEL MARKET, BY ANIMAL TYPE, 2022-2032 ($MILLION)
    TABLE 78. BRAZIL ANIMAL MODEL MARKET, BY APPLICATION, 2022-2032 ($MILLION)
    TABLE 79. BRAZIL ANIMAL MODEL MARKET, BY END USER, 2022-2032 ($MILLION)
    TABLE 80. SAUDI ARABIA ANIMAL MODEL MARKET, BY ANIMAL TYPE, 2022-2032 ($MILLION)
    TABLE 81. SAUDI ARABIA ANIMAL MODEL MARKET, BY APPLICATION, 2022-2032 ($MILLION)
    TABLE 82. SAUDI ARABIA ANIMAL MODEL MARKET, BY END USER, 2022-2032 ($MILLION)
    TABLE 83. SOUTH AFRICA ANIMAL MODEL MARKET, BY ANIMAL TYPE, 2022-2032 ($MILLION)
    TABLE 84. SOUTH AFRICA ANIMAL MODEL MARKET, BY APPLICATION, 2022-2032 ($MILLION)
    TABLE 85. SOUTH AFRICA ANIMAL MODEL MARKET, BY END USER, 2022-2032 ($MILLION)
    TABLE 86. REST OF LAMEA ANIMAL MODEL MARKET, BY ANIMAL TYPE, 2022-2032 ($MILLION)
    TABLE 87. REST OF LAMEA ANIMAL MODEL MARKET, BY APPLICATION, 2022-2032 ($MILLION)
    TABLE 88. REST OF LAMEA ANIMAL MODEL MARKET, BY END USER, 2022-2032 ($MILLION)
    TABLE 89. CHARLES RIVER LABORATORIES: KEY EXECUTIVES
    TABLE 90. CHARLES RIVER LABORATORIES: COMPANY SNAPSHOT
    TABLE 91. CHARLES RIVER LABORATORIES: PRODUCT SEGMENTS
    TABLE 92. CHARLES RIVER LABORATORIES: SERVICE SEGMENTS
    TABLE 93. CHARLES RIVER LABORATORIES: PRODUCT PORTFOLIO
    TABLE 94. CHARLES RIVER LABORATORIES: KEY STRATERGIES
    TABLE 95. INOTIV, INC.: KEY EXECUTIVES
    TABLE 96. INOTIV, INC.: COMPANY SNAPSHOT
    TABLE 97. INOTIV, INC.: PRODUCT SEGMENTS
    TABLE 98. INOTIV, INC.: PRODUCT PORTFOLIO
    TABLE 99. GENOWAY S.A.: KEY EXECUTIVES
    TABLE 100. GENOWAY S.A.: COMPANY SNAPSHOT
    TABLE 101. GENOWAY S.A.: PRODUCT SEGMENTS
    TABLE 102. GENOWAY S.A.: PRODUCT PORTFOLIO
    TABLE 103. GENOWAY S.A.: KEY STRATERGIES
    TABLE 104. HERA BIOLABS: KEY EXECUTIVES
    TABLE 105. HERA BIOLABS: COMPANY SNAPSHOT
    TABLE 106. HERA BIOLABS: PRODUCT SEGMENTS
    TABLE 107. HERA BIOLABS: SERVICE SEGMENTS
    TABLE 108. HERA BIOLABS: PRODUCT PORTFOLIO
    TABLE 109. CROWN BIOSCIENCE INC.: KEY EXECUTIVES
    TABLE 110. CROWN BIOSCIENCE INC.: COMPANY SNAPSHOT
    TABLE 111. CROWN BIOSCIENCE INC.: PRODUCT SEGMENTS
    TABLE 112. CROWN BIOSCIENCE INC.: SERVICE SEGMENTS
    TABLE 113. CROWN BIOSCIENCE INC.: PRODUCT PORTFOLIO
    TABLE 114. OZGENE PTY LTD.: KEY EXECUTIVES
    TABLE 115. OZGENE PTY LTD.: COMPANY SNAPSHOT
    TABLE 116. OZGENE PTY LTD.: PRODUCT SEGMENTS
    TABLE 117. OZGENE PTY LTD.: SERVICE SEGMENTS
    TABLE 118. OZGENE PTY LTD.: PRODUCT PORTFOLIO
    TABLE 119. TACONIC BIOSCIENCES: KEY EXECUTIVES
    TABLE 120. TACONIC BIOSCIENCES: COMPANY SNAPSHOT
    TABLE 121. TACONIC BIOSCIENCES: PRODUCT SEGMENTS
    TABLE 122. TACONIC BIOSCIENCES: PRODUCT PORTFOLIO
    TABLE 123. TACONIC BIOSCIENCES: KEY STRATERGIES
    TABLE 124. THE JACKSON LABORATORY.: KEY EXECUTIVES
    TABLE 125. THE JACKSON LABORATORY.: COMPANY SNAPSHOT
    TABLE 126. THE JACKSON LABORATORY.: PRODUCT SEGMENTS
    TABLE 127. THE JACKSON LABORATORY.: PRODUCT PORTFOLIO
    TABLE 128. TRANS GENIC INC.: KEY EXECUTIVES
    TABLE 129. TRANS GENIC INC.: COMPANY SNAPSHOT
    TABLE 130. TRANS GENIC INC.: PRODUCT SEGMENTS
    TABLE 131. TRANS GENIC INC.: PRODUCT PORTFOLIO
    TABLE 132. JANVIER LABS, LLC: KEY EXECUTIVES
    TABLE 133. JANVIER LABS, LLC: COMPANY SNAPSHOT
    TABLE 134. JANVIER LABS, LLC: PRODUCT SEGMENTS
    TABLE 135. JANVIER LABS, LLC: PRODUCT PORTFOLIO
  • LIST OF FIGURES

  • FIGURE 01. ANIMAL MODEL MARKET, 2022-2032
    FIGURE 02. SEGMENTATION OF ANIMAL MODEL MARKET, 2022-2032
    FIGURE 03. ANIMAL MODEL MARKET,2022-2032
    FIGURE 04. TOP INVESTMENT POCKETS IN ANIMAL MODEL MARKET (2023-2032)
    FIGURE 05. LOW BARGAINING POWER OF SUPPLIERS
    FIGURE 06. LOW THREAT OF NEW ENTRANTS
    FIGURE 07. LOW THREAT OF SUBSTITUTES
    FIGURE 08. LOW INTENSITY OF RIVALRY
    FIGURE 09. LOW BARGAINING POWER OF BUYERS
    FIGURE 10. GLOBAL ANIMAL MODEL MARKET:DRIVERS, RESTRAINTS AND OPPORTUNITIES
    FIGURE 11. ANIMAL MODEL MARKET, BY ANIMAL TYPE, 2022(%)
    FIGURE 12. COMPARATIVE SHARE ANALYSIS OF ANIMAL MODEL MARKET FOR RAT, BY COUNTRY 2022-2032(%)
    FIGURE 13. COMPARATIVE SHARE ANALYSIS OF ANIMAL MODEL MARKET FOR MICE, BY COUNTRY 2022-2032(%)
    FIGURE 14. COMPARATIVE SHARE ANALYSIS OF ANIMAL MODEL MARKET FOR GUINEA PIGS, BY COUNTRY 2022-2032(%)
    FIGURE 15. COMPARATIVE SHARE ANALYSIS OF ANIMAL MODEL MARKET FOR RABBITS, BY COUNTRY 2022-2032(%)
    FIGURE 16. COMPARATIVE SHARE ANALYSIS OF ANIMAL MODEL MARKET FOR OTHERS, BY COUNTRY 2022-2032(%)
    FIGURE 17. ANIMAL MODEL MARKET, BY APPLICATION, 2022(%)
    FIGURE 18. COMPARATIVE SHARE ANALYSIS OF ANIMAL MODEL MARKET FOR DRUG DISCOVERY AND DEVELOPMENT, BY COUNTRY 2022-2032(%)
    FIGURE 19. COMPARATIVE SHARE ANALYSIS OF ANIMAL MODEL MARKET FOR BASIC RESEARCH, BY COUNTRY 2022-2032(%)
    FIGURE 20. COMPARATIVE SHARE ANALYSIS OF ANIMAL MODEL MARKET FOR OTHERS, BY COUNTRY 2022-2032(%)
    FIGURE 21. ANIMAL MODEL MARKET, BY END USER, 2022(%)
    FIGURE 22. COMPARATIVE SHARE ANALYSIS OF ANIMAL MODEL MARKET FOR PHARMA AND BIOTECH COMPANIES, BY COUNTRY 2022-2032(%)
    FIGURE 23. COMPARATIVE SHARE ANALYSIS OF ANIMAL MODEL MARKET FOR ACADEMIC RESEARCH INSTITUTES, BY COUNTRY 2022-2032(%)
    FIGURE 24. COMPARATIVE SHARE ANALYSIS OF ANIMAL MODEL MARKET FOR OTHERS, BY COUNTRY 2022-2032(%)
    FIGURE 25. ANIMAL MODEL MARKET BY REGION, 2022
    FIGURE 26. U.S. ANIMAL MODEL MARKET, 2022-2032 ($MILLION)
    FIGURE 27. CANADA ANIMAL MODEL MARKET, 2022-2032 ($MILLION)
    FIGURE 28. MEXICO ANIMAL MODEL MARKET, 2022-2032 ($MILLION)
    FIGURE 29. GERMANY ANIMAL MODEL MARKET, 2022-2032 ($MILLION)
    FIGURE 30. FRANCE ANIMAL MODEL MARKET, 2022-2032 ($MILLION)
    FIGURE 31. UK ANIMAL MODEL MARKET, 2022-2032 ($MILLION)
    FIGURE 32. ITALY ANIMAL MODEL MARKET, 2022-2032 ($MILLION)
    FIGURE 33. SPAIN ANIMAL MODEL MARKET, 2022-2032 ($MILLION)
    FIGURE 34. REST OF EUROPE ANIMAL MODEL MARKET, 2022-2032 ($MILLION)
    FIGURE 35. JAPAN ANIMAL MODEL MARKET, 2022-2032 ($MILLION)
    FIGURE 36. CHINA ANIMAL MODEL MARKET, 2022-2032 ($MILLION)
    FIGURE 37. AUSTRALIA ANIMAL MODEL MARKET, 2022-2032 ($MILLION)
    FIGURE 38. INDIA ANIMAL MODEL MARKET, 2022-2032 ($MILLION)
    FIGURE 39. SOUTH KOREA ANIMAL MODEL MARKET, 2022-2032 ($MILLION)
    FIGURE 40. REST OF ASIA-PACIFIC ANIMAL MODEL MARKET, 2022-2032 ($MILLION)
    FIGURE 41. BRAZIL ANIMAL MODEL MARKET, 2022-2032 ($MILLION)
    FIGURE 42. SAUDI ARABIA ANIMAL MODEL MARKET, 2022-2032 ($MILLION)
    FIGURE 43. SOUTH AFRICA ANIMAL MODEL MARKET, 2022-2032 ($MILLION)
    FIGURE 44. REST OF LAMEA ANIMAL MODEL MARKET, 2022-2032 ($MILLION)
    FIGURE 45. TOP WINNING STRATEGIES, BY YEAR
    FIGURE 46. TOP WINNING STRATEGIES, BY DEVELOPMENT
    FIGURE 47. TOP WINNING STRATEGIES, BY COMPANY
    FIGURE 48. PRODUCT MAPPING OF TOP 10 PLAYERS
    FIGURE 49. COMPETITIVE DASHBOARD
    FIGURE 50. COMPETITIVE HEATMAP: ANIMAL MODEL MARKET
    FIGURE 51. TOP PLAYER POSITIONING, 2022
    FIGURE 52. CHARLES RIVER LABORATORIES: NET REVENUE, 2020-2022 ($MILLION)
    FIGURE 53. CHARLES RIVER LABORATORIES: REVENUE SHARE BY SEGMENT, 2022 (%)
    FIGURE 54. CHARLES RIVER LABORATORIES: REVENUE SHARE BY REGION, 2022 (%)
    FIGURE 55. INOTIV, INC.: NET REVENUE, 2020-2022 ($MILLION)
    FIGURE 56. INOTIV, INC.: REVENUE SHARE BY SEGMENT, 2022 (%)
    FIGURE 57. INOTIV, INC.: REVENUE SHARE BY REGION, 2022 (%)
    FIGURE 58. TRANS GENIC INC.: NET REVENUE, 2020-2022 ($MILLION)


PURCHASE OPTIONS

Call or Email us

U.S.-Canada Toll-free: +1-800-792-5285
Int'l : +1-503-894-6022
Europe : +44-845-528-1300
Email : help@alliedmarketresearch.com
 
FREQUENTLY ASKED QUESTIONS?

A. Top companies such as Charles River Laboratories International, Inc., The Jackson Laboratory, Inotiv, Inc, Taconic Biosciences, Inc., and Genoway S.A held high market share in 2022.

A. An animal model refers to the use of animals, typically non-human species, in scientific research to study various biological and physiological processes, diseases, and test potential treatments or interventions.

A. The mice segment is the most influencing segment owing to high adoption of mice towards the genetic mutaion.

A. Surge in use of animal models in virology and infectious diseases, increase in adoption of CRISPR technology, and rise in number of R&D activities are driving the growth of animal model market

A. North America is the largest regional market for animal model owing to rise in the research and development in the field of pharmaceuticals which requires animal model for drug discovery and development process and the strong presence of major key player in this region.

A. Animal models are primarily used by pharma and biotech companies for drug discovery and development procedures.

A. The forcast period for animal model market is 2023 to 2032

A. Asia-Pacific is expected to experience the growth rate of 8.0% during the forecast period, owing to high research in the field of vaccines in this region.

A. The estimated industry size of animal model in 2032 is $3617.92 million.

A. The base year is 2022 in animal model market.

Looking for Customization?

 Customization Request

Have a Question?

 Speak with Analyst

Any Confusion?

 Inquire Before Buying

Have a glance of the Report

  Request Sample
RELATED TAGS

Purchase Full Report of
Animal Model Market

Start reading instantly.
This Report and over 68,113+ more Reports, Available with Avenue Library. T&C*.

  • Online Only
  • $3,570
  • Online cloud access only
  • Restricted print, copy, paste & download
  • Read only
  • Free industry update
    (Within 180 days)
  • Free report update in next update cycle
    (Aug 2024 - Aug 2025)
  • Data Pack
  • $3,840
  • Restricted to one authorized user
  • One print only
  • Available in
    Excel
  • Free industry update
    (Within 180 days)
  •   Free report update in next update cycle
    (Aug 2024 - Aug 2025)
  • Single User
  • $5,730
  • Restricted to one authorized user
  • One print only
  • Available in
    PDF
  • Free industry update
    (Within 180 days)
  •   Free report update in next update cycle
    (Aug 2024 - Aug 2025)
  • Five Users
  • $6,450
  • Limited to five authorized users
  • Print upto five copies
  • Available in
    PDF
  • Free industry update
    (Within 180 days)
  •   Free report update in next update cycle
    (Aug 2024 - Aug 2025)
  • Enterprise
    License/PDF

  • $9,600
  • Unlimited
    within
    company/enterprise
  • Available in Excel & PDF
  • Free industry update
    (Within 180 days)
  •   Free report update in next update cycle
    (Aug 2024 - Aug 2025)
  • Library
    Membership

  • $999 $ 1,175
    Per User/ Per month/ Billed annually
  • Published Content
    E-access
  • Company Profiles
    E-access
  • Newly Added Content Access
  • 10 PDF
    Downloads
  • 5 Excel Data
    Pack Downloads
  • 250 Company Profiles PDF Downloads
  • Buy Now

*Taxes/Fees, if applicable will be added during checkout. All prices in USD

RELATED REPORTS
 

Why Allied Market Research?


Infallible Methodology

To ensure high-level data integrity, accurate analysis, and impeccable forecasts

Analyst Support

For complete satisfaction

Customization

On-demand customization of scope of the report to exactly meet your needs

TARGETED MARKET VIEW

Targeted market view to provide pertinent information and save time of readers

Get fresh content delivered

Get insights on topics that are crucial for your business. Stay abreast of your interest areas.

Get Industry Data Alerts

Why Allied Market Research?

Infallible Methodology

To ensure high-level data integrity, accurate analysis, and impeccable forecasts

Analyst Support

For complete satisfaction

Customization

On-demand customization of scope of the report to exactly meet your needs

TARGETED MARKET VIEW

Targeted market view to provide pertinent information and save time of readers