A10266 | Pages: 220 | Jan 2022 | 1175 Views | | |
Author(s) : Smita Nerkar, Prathmesh Bhasme , Onkar Sumant | Tables: 89 | Charts: 43 |
|
Pandemic disrupted the entire world and affected many industries.
Get detailed COVID-19 impact analysis on the Ankylosing Spondylitis Market
Request Now !
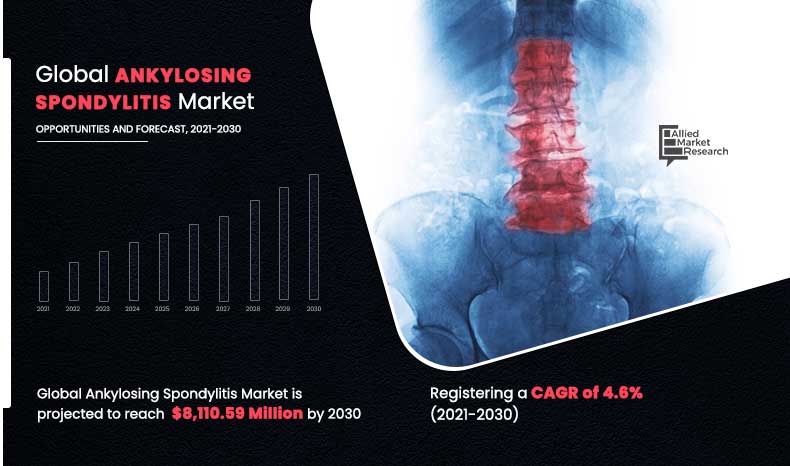
The global ankylosing spondylitis market size was valued at $5,140.94 million in 2020, and is projected to reach $8,110.59 million by 2030, registering a CAGR of 4.6% from 2021 to 2030. The ankylosing spondylitis is an inflammatory disease that can cause some of the bones in the spine (vertebrae) to fuse over time. This fusing makes the spine less flexible and can result in a hunched posture. If ribs are affected, it can be difficult to breathe deeply. Ankylosing spondylitis is a complex disorder that can cause some serious complications when left unchecked.
Symptoms and complications for many patients can be controlled or reduced by following a regular treatment plan. The early signs and symptoms of ankylosing spondylitis might include pain and stiffness in the lower back and hips, especially in the morning and after periods of inactivity. Neck pain and fatigue also are common. Over time, symptoms might worsen, improve or stop at irregular intervals.
Get more information on this report : Request Sample Pages
The ankylosing spondylitis has no known specific cause, though genetic factors seem to be involved. In particular, people who have a gene called HLA-B27 are at a greatly increased risk of developing ankylosing spondylitis. However, only some people with the gene develop the condition. The ankylosing spondylitis can be diagnosed with physical examination. In addition, MRI and X-ray imaging tests are performed for diagnosis of ankylosing spondylitis.
The ankylosing spondylitis cannot be cured or treated completely but symptoms of disease can be managed with drug treatment and physical exercise. For the management of pain associated with ankylosing spondylitis generally NSAIDs are preferred. In addition, TNF inhibitors, corticosteroids and disease-modifying antirheumatic drugs (DMARDs) are used for management of inflammation in ankylosing spondylitis. Furthermore, monoclonal antibodies has been approved for treatment of ankylosing spondylitis.
The growth of the global ankylosing spondylitis market is majorly driven by an increase in prevalence of ankylosing spondylitis. For instance, according to paper published in Scandinavian Journal of Rheumatology, in 2020, titled ‘Prevalence of ankylosing spondylitis in Spain’, the study found that about 7.3% population shows positive screening for ankylosing spondylitis. Furthermore, rise in number of orthopedic hospitals and diagnostic centers boost the diagnosis and treatment of diseases. For instance, according to Definitive Healthcare data in 2020 there are more than 30,500 orthopedic surgeons in the U.S.
Moreover, advancement in ankylosing spondylitis therapy is anticipated to contribute toward the growth of the ankylosing spondylitis market. For instance, in August, 2019, Lilly, a leading manufacturer of biopharmaceuticals, receives U.S. FDA Approval for Taltz (ixekizumab) for the Treatment of Active Ankylosing Spondylitis. Taltz is a monoclonal antibody used to reduce inflammation and pain. However, high cost of ankylosing spondylitis therapy and adverse effects of drugs used for treatment of ankylosing spondylitis restricted the market growth during the forecast period.
The ankylosing spondylitis market is segmented on the basis of drug class, distribution channel, and region. By drug class, the market is mainly categorized into NSAIDs, TNF inhibitors and others.
Depending on distribution channel, it is categorized hospitals pharmacy, retail pharmacy, and online pharmacy.
Region-wise, the ankylosing spondylitis market is analyzed across North America (U.S., Canada, and Mexico), Europe (Germany, France, the UK, Italy, Spain, and Rest of Europe), Asia-Pacific (Japan, China, Australia, India, South Korea, and Rest of Asia-Pacific), and LAMEA (Brazil, South Arabia, South Africa, and LAMEA).
Get more information on this report : Request Sample Pages
Depending on drug class, the NSAIDs segment dominated the ankylosing spondylitis market in 2020, and this trend is expected to continue during the forecast period, owing to increase in ankylosing spondylitis. However, the TNF inhibitors segment is expected to witness considerable growth during the forecast period, owing to rise in advancements in ankylosing spondylitis therapy.
Depending on distribution channel, the retail pharmacy segment was the major contributor in 2020 and is expected to maintain its lead during the forecast period, owing to an increase in number of retail pharmacies and easy to reach for patients. However, the hospital pharmacy segment is expected to witness considerable growth during the forecast period, due to rise in number of hospitals.
Get more information on this report : Request Sample Pages
North America garnered the major share in the ankylosing spondylitis market in 2020, and is expected to continue to dominate during the forecast period, owing to rise in prevalence of ankylosing spondylitis, presence of key players for manufacturing & development of drugs for ankylosing spondylitis treatment, and well-established infrastructure in the region. However, Asia-Pacific is expected to register the highest CAGR of 6.1% from 2021 to 2030, owing to an increase in the number of hospitals, and a high population.
The key players operating in the global ankylosing spondylitis market include AbbVie, Inc, Amgen, Inc, Pfizer, Inc, Novartis AG, Eli Lilly and Company, UCB, Inc., Gilead Sciences, Reliance Life Sciences Pvt. Ltd, Janssen Pharmaceuticals, and Merck & Co. Inc.
Get more information on this report : Request Sample Pages
Key Benefits For Stakeholders
Key Market Segments
CHAPTER 1:INTRODUCTION
1.1.Report description
1.2.Key Benefits for Stakeholders
1.3.Key market segments
1.3.1.List of key players profiled in the report
1.4.Research methodology
1.4.1.Secondary research
1.4.2.Primary research
1.4.3.Analyst tools and models
CHAPTER 2:EXECUTIVE SUMMARY
2.1.Key findings of the study
2.2.CXO perspective
CHAPTER 3:MARKET LANDSCAPE
3.1.Market definition and scope
3.2.Key findings
3.2.1.Top investment pockets
3.2.2.Top winning strategies
3.3.Porter’s five forces analysis
3.4.Top player positioning, 2020
3.5.Market dynamics
3.5.1.Drivers
3.5.1.1.Increase in prevalence of ankylosing spondylitis
3.5.1.2.Rise in number of hospitals and diagnostic centers
3.5.1.3.Advancements in the ankylosing spondylitis treatment
3.5.2.Restraint
3.5.2.1.High cost of treatment and lack of awareness
3.5.2.2.Adverse effect of long-term use of drug therapy
3.5.3.Opportunity
3.5.3.1.Advancements in treatment of ankylosing spondylitis.
3.5.4.Impact analysis
3.6.Impact analysis of COVID-19 on the ankylosing spondylitis market
CHAPTER 4:ANKYLOSING SPONDYLITIS MARKET, BY DRUG CLASS
4.1.Overview
4.1.1.Market size and forecast
4.2.Nonsteroidal anti-inflammatory drugs (NSAIDs)
4.2.1.Key market trends, growth factors, and opportunities
4.2.2.Market size and forecast, by region
4.2.3.Market analysis, by country
4.3.TNF inhibitors
4.3.1.Key market trends, growth factors, and opportunities
4.3.2.Market size and forecast, by region
4.3.3.Market analysis, by country
4.4.Others
4.4.1.Key market trends, growth factors, and opportunities
4.4.2.Market size and forecast, by region
4.4.3.Market analysis, by country
CHAPTER 5:ANKYLOSING SPONDYLITIS MARKET, BY DISTRIBUTION CHANNEL
5.1.Overview
5.1.1.Market size and forecast
5.2.Hospital pharmacy
5.2.1.Market size and forecast, by region
5.2.2.Market analysis, by country
5.3.Retail pharmacy
5.3.1.Market size and forecast, by region
5.3.2.Market analysis, by country
5.4.Online pharmacy
5.4.1.Market size and forecast, by region
5.4.2.Market analysis, by country
CHAPTER 6:ANKYLOSING SPONDYLITIS MARKET, BY REGION
6.1.Overview
6.1.1.Market size and forecast
6.2.North America
6.2.1.Key market trends, growth factors, and opportunities
6.2.2.North America Ankylosing spondylitis market, by Drug Class
6.2.3.North America Ankylosing spondylitis market, by Distribution channel
6.2.4.Market size and forecast, by country
6.2.4.1.U.S.
6.2.4.1.1.U.S. Ankylosing spondylitis market, by Drug Class
6.2.4.1.2.U.S. Ankylosing spondylitis market, by Distribution channels
6.2.4.2.Canada
6.2.4.2.1.Canada ankylosing spondylitis market, by Drug Class
6.2.4.2.2.Canada Ankylosing spondylitis market, by Distribution channels
6.2.4.3.Mexico
6.2.4.3.1.Mexico ankylosing spondylitis market, by Drug Class
6.2.4.3.2.Mexico ankylosing spondylitis market, by Distribution channels
6.3.Europe
6.3.1.Key market trends, growth factors, and opportunities
6.3.2.Europe Ankylosing spondylitis market, by Drug Class
6.3.3.Europe Ankylosing spondylitis market, by Distribution channel
6.3.4.Market size and forecast, by country
6.3.4.1.Germany
6.3.4.1.1.Germany ankylosing spondylitis market, by Drug Class
6.3.4.1.2.Germany ankylosing spondylitis market, by Distribution channels
6.3.4.2.France
6.3.4.2.1.France ankylosing spondylitis market, by Drug Class
6.3.4.2.2.France ankylosing spondylitis market, by Distribution channels
6.3.4.3.UK
6.3.4.3.1.UK ankylosing spondylitis market, by Drug Class
6.3.4.3.2.UK ankylosing spondylitis market, by Distribution channels
6.3.4.4.Italy
6.3.4.4.1.Italy ankylosing spondylitis market, by Drug Class
6.3.4.4.2.Italy ankylosing spondylitis market, by Distribution channels
6.3.4.5.Spain
6.3.4.5.1.Spain ankylosing spondylitis market, by Drug Class
6.3.4.5.2.Spain ankylosing spondylitis market, by Distribution channels
6.3.4.6.Rest of Europe
6.3.4.6.1.Rest of Europe ankylosing spondylitis market, by Drug Class
6.3.4.6.2.Rest of Europe ankylosing spondylitis market, by Distribution channels
6.4.Asia-Pacific
6.4.1.Key market trends, growth factors, and opportunities
6.4.2.Asia-Pacific Ankylosing spondylitis market, by Drug Class
6.4.3.Asia-Pacific Ankylosing spondylitis market, by Distribution channel
6.4.4.Market size and forecast, by country
6.4.4.1.Japan
6.4.4.1.1.Japan ankylosing spondylitis market, by Drug Class
6.4.4.1.2.Japan ankylosing spondylitis market, by Distribution channels
6.4.4.2.China
6.4.4.2.1.China ankylosing spondylitis market, by Drug Class
6.4.4.2.2.China ankylosing spondylitis market, by Distribution channels
6.4.4.3.Australia
6.4.4.3.1.Australia ankylosing spondylitis market, by Drug Class
6.4.4.3.2.Australia ankylosing spondylitis market, by Distribution channels
6.4.4.4.India
6.4.4.4.1.India ankylosing spondylitis market, by Drug Class
6.4.4.4.2.India ankylosing spondylitis market, by Distribution channels
6.4.4.5.South Korea
6.4.4.5.1.South Korea ankylosing spondylitis market, by Drug Class
6.4.4.5.2.South Korea ankylosing spondylitis market, by Distribution channels
6.4.4.6.Rest of Asia-Pacific
6.4.4.6.1.Rest of Asia-Pacific ankylosing spondylitis market, by Drug Class
6.4.4.6.2.Rest of Asia-Pacific ankylosing spondylitis market, by Distribution channels
6.5.LAMEA
6.5.1.Key market trends, growth factors, and opportunities
6.5.2.LAMEA Ankylosing spondylitis market, by Drug Class
6.5.3.LAMEA Ankylosing spondylitis market, by Distribution channel
6.5.4.Market size and forecast, by country
6.5.4.1.Brazil
6.5.4.1.1.Brazil ankylosing spondylitis market, by Drug Class
6.5.4.1.2.Brazil ankylosing spondylitis market, by Distribution channels
6.5.4.2.Saudi Arabia
6.5.4.2.1.Saudi Arabia ankylosing spondylitis market, by Drug Class
6.5.4.2.2.Saudi Arabia ankylosing spondylitis market, by Distribution channels
6.5.4.3.South Africa
6.5.4.3.1.South Africa ankylosing spondylitis market, by Drug Class
6.5.4.3.2.South Africa ankylosing spondylitis market, by Distribution channels
6.5.4.4.Rest of LAMEA
6.5.4.4.1.Rest of LAMEA ankylosing spondylitis market, by Drug Class
6.5.4.4.2.Rest of LAMEA ankylosing spondylitis market, by Distribution channels
CHAPTER 7:COMPANY PROFILES
7.1.AbbVie, Inc
7.1.1.Company overview
7.1.2.Company snapshot
7.1.3.Operating business segments
7.1.4.Product portfolio
7.1.5.Business performance
7.2.Amgen Inc.
7.2.1.Company overview
7.2.2.Company snapshot
7.2.3.Operating business segments
7.2.4.Product portfolio
7.2.5.Business performance
7.2.6.Key strategic moves and developments
7.3.Eli Lilly and Company
7.3.1.Company overview
7.3.2.Company snapshot
7.3.3.Operating business segments
7.3.4.Product portfolio
7.3.5.Business performance
7.3.6.Key strategic moves and developments
7.4.Gilead Sciences
7.4.1.Company overview
7.4.2.Company snapshot
7.4.3.Operating business segments
7.4.4.Product portfolio
7.4.5.Business performance
7.5.Johnson & Johnson (Janssen)
7.5.1.Company overview
7.5.2.Company snapshot
7.5.3.Operating business segments
7.5.4.Product portfolio
7.5.5.Business performance
7.6.Merck & Co. Inc
7.6.1.Company overview
7.6.2.Company snapshot
7.6.3.Operating business segments
7.6.4.Product portfolio
7.6.5.Business performance
7.6.6.Key strategic moves and developments
7.7.Novartis AG
7.7.1.Company overview
7.7.2.Company snapshot
7.7.3.Operating business segments
7.7.4.Product portfolio
7.7.5.Business performance
7.8.Pfizer Inc.
7.8.1.Company overview
7.8.2.Company snapshot
7.8.3.Operating business segments
7.8.4.Product portfolio
7.8.5.Business performance
7.8.6.Key strategic moves and developments
7.9.Reliance Life Sciences Pvt. Ltd
7.9.1.Company overview
7.9.2.Company snapshot
7.9.3.Operating business segments
7.9.4.Product portfolio
7.10.UCB, Inc.
7.10.1.Company overview
7.10.2.Company snapshot
7.10.3.Operating business segments
7.10.4.Product portfolio
LIST OF TABLES
TABLE 01.ANKYLOSING SPONDYLITIS MARKET, BY DRUG CLASS, 2020–2030 ($MILLION)
TABLE 02.ANKYLOSING SPONDYLITIS MARKET BY DRUG CLASS, FOR NONSTEROIDAL ANTI-INFLAMMATORY DRUGS, BY REGION, 2020–2030 ($MILLION)
TABLE 03.ANKYLOSING SPONDYLITIS MARKET BY DRUG CLASS, FOR TNF INHIBITORS, BY REGION, 2020–2030 ($MILLION)
TABLE 04.ANKYLOSING SPONDYLITIS MARKET BY DRUG CLASS, FOR OTHERS, BY REGION, 2020–2030 ($MILLION)
TABLE 05.ANKYLOSING SPONDYLITIS MARKET, BY DISTRIBUTION CHANNEL, 2020–2030 ($MILLION)
TABLE 06.ANKYLOSING SPONDYLITIS MARKET FOR HOSPITAL PHARMACY, BY REGION, 2020-2030 ($MILLION)
TABLE 07.ANKYLOSING SPONDYLITIS MARKET FOR RETAIL PHARMACY, BY REGION, 2020-2030 ($MILLION)
TABLE 08.ANKYLOSING SPONDYLITIS MARKET FOR ONLINE PHARMACY, BY REGION, 2020-2030 ($MILLION)
TABLE 09.ANKYLOSING SPONDYLITIS MARKET, BY REGION, 2020-2030 ($MILLION)
TABLE 10.NORTH AMERICA ANKYLOSING SPONDYLITIS MARKET, BY DRUG CLASS, 2020-2030 ($MILLION)
TABLE 11.NORTH AMERICA ANKYLOSING SPONDYLITIS MARKET, BY DISTRIBUTION CHANNEL, 2020-2030 ($MILLION)
TABLE 12.NORTH AMERICA ANKYLOSING SPONDYLITIS MARKET WAS VALUED, BY COUNTRY, 2020-2030 ($MILLION)
TABLE 13.U.S. ANKYLOSING SPONDYLITIS MARKET, BY DRUG CLASS, 2020-2030 ($MILLION)
TABLE 14.U.S. ANKYLOSING SPONDYLITIS MARKET, BY DISTRIBUTION CHANNELS, 2020-2030 ($MILLION)
TABLE 15.CANADA ANKYLOSING SPONDYLITIS MARKET, BY DRUG CLASS, 2020-2030 ($MILLION)
TABLE 16.CANADA ANKYLOSING SPONDYLITIS MARKET, BY DISTRIBUTION CHANNELS, 2020-2030 ($MILLION)
TABLE 17.MEXICO ANKYLOSING SPONDYLITIS MARKET, BY DRUG CLASS, 2020-2030 ($MILLION)
TABLE 18.MEXICO ANKYLOSING SPONDYLITIS MARKET, BY DISTRIBUTION CHANNELS, 2020-2030 ($MILLION)
TABLE 19.EUROPE ANKYLOSING SPONDYLITIS MARKET, BY DRUG CLASS, 2020-2030 ($MILLION)
TABLE 20.EUROPE ANKYLOSING SPONDYLITIS MARKET, BY DISTRIBUTION CHANNEL, 2020-2030 ($MILLION)
TABLE 21.EUROPE ANKYLOSING SPONDYLITIS MARKET, BY COUNTRY, 2020-2030 ($MILLION)
TABLE 22.GERMANY ANKYLOSING SPONDYLITIS MARKET, BY DRUG CLASS, 2020-2030 ($MILLION)
TABLE 23.GERMANY ANKYLOSING SPONDYLITIS MARKET, BY DISTRIBUTION CHANNELS, 2020-2030 ($MILLION)
TABLE 24.FRANCE ANKYLOSING SPONDYLITIS MARKET, BY DRUG CLASS, 2020-2030 ($MILLION)
TABLE 25.FRANCE ANKYLOSING SPONDYLITIS MARKET, BY DISTRIBUTION CHANNELS, 2020-2030 ($MILLION)
TABLE 26.UK ANKYLOSING SPONDYLITIS MARKET, BY DRUG CLASS, 2020-2030 ($MILLION)
TABLE 27.UK ANKYLOSING SPONDYLITIS MARKET, BY DISTRIBUTION CHANNELS, 2020-2030 ($MILLION)
TABLE 28.ITALY ANKYLOSING SPONDYLITIS MARKET, BY DRUG CLASS, 2020-2030 ($MILLION)
TABLE 29.ITALY ANKYLOSING SPONDYLITIS MARKET, BY DISTRIBUTION CHANNELS, 2020-2030 ($MILLION)
TABLE 30.SPAIN ANKYLOSING SPONDYLITIS MARKET, BY DRUG CLASS, 2020-2030 ($MILLION)
TABLE 31.SPAIN ANKYLOSING SPONDYLITIS MARKET, BY DISTRIBUTION CHANNELS, 2020-2030 ($MILLION)
TABLE 32.REST OF EUROPE ANKYLOSING SPONDYLITIS MARKET, BY DRUG CLASS, 2020-2030 ($MILLION)
TABLE 33.REST OF EUROPE ANKYLOSING SPONDYLITIS MARKET, BY DISTRIBUTION CHANNELS, 2020-2030 ($MILLION)
TABLE 34.ASIA-PACIFIC ANKYLOSING SPONDYLITIS MARKET, BY DRUG CLASS, 2020-2030 ($MILLION)
TABLE 35.ASIA-PACIFIC ANKYLOSING SPONDYLITIS MARKET, BY DISTRIBUTION CHANNEL, 2020-2030 ($MILLION)
TABLE 36.ASIA-PACIFIC ANKYLOSING SPONDYLITIS MARKET, BY COUNTRY, 2020-2030 ($MILLION)
TABLE 37.JAPAN ANKYLOSING SPONDYLITIS MARKET, BY DRUG CLASS, 2020-2030 ($MILLION)
TABLE 38.JAPAN ANKYLOSING SPONDYLITIS MARKET, BY DISTRIBUTION CHANNELS, 2020-2030 ($MILLION)
TABLE 39.CHINA ANKYLOSING SPONDYLITIS MARKET, BY DRUG CLASS, 2020-2030 ($MILLION)
TABLE 40.CHINA ANKYLOSING SPONDYLITIS MARKET, BY DISTRIBUTION CHANNELS, 2020-2030 ($MILLION)
TABLE 41.AUSTRALIA ANKYLOSING SPONDYLITIS MARKET, BY DRUG CLASS, 2020-2030 ($MILLION)
TABLE 42.AUSTRALIA ANKYLOSING SPONDYLITIS MARKET, BY DISTRIBUTION CHANNELS, 2020-2030 ($MILLION)
TABLE 43.INDIA ANKYLOSING SPONDYLITIS MARKET, BY DRUG CLASS, 2020-2030 ($MILLION)
TABLE 44.INDIA ANKYLOSING SPONDYLITIS MARKET, BY DISTRIBUTION CHANNELS, 2020-2030 ($MILLION)
TABLE 45.SOUTH KOREA ANKYLOSING SPONDYLITIS MARKET, BY DRUG CLASS, 2020-2030 ($MILLION)
TABLE 46.SOUTH KOREA ANKYLOSING SPONDYLITIS MARKET, BY DISTRIBUTION CHANNELS, 2020-2030 ($MILLION)
TABLE 47.REST OF ASIA-PACIFIC ANKYLOSING SPONDYLITIS MARKET, BY DRUG CLASS, 2020-2030 ($MILLION)
TABLE 48.REST OF ASIA-PACIFIC ANKYLOSING SPONDYLITIS MARKET, BY DISTRIBUTION CHANNELS, 2020-2030 ($MILLION)
TABLE 49.LAMEA ANKYLOSING SPONDYLITIS MARKET, BY DRUG CLASS, 2020-2030 ($MILLION)
TABLE 50.LAMEA ANKYLOSING SPONDYLITIS MARKET, BY DISTRIBUTION CHANNEL, 2020-2030 ($MILLION)
TABLE 51.LAMEA ANKYLOSING SPONDYLITIS MARKET, BY COUNTRY, 2020-2030 ($MILLION)
TABLE 52.BRAZIL ANKYLOSING SPONDYLITIS MARKET, BY DRUG CLASS, 2020-2030 ($MILLION)
TABLE 53.BRAZIL ANKYLOSING SPONDYLITIS MARKET, BY DISTRIBUTION CHANNELS, 2020-2030 ($MILLION)
TABLE 54.SAUDI ARABIA ANKYLOSING SPONDYLITIS MARKET, BY DRUG CLASS, 2020-2030 ($MILLION)
TABLE 55.SAUDI ARABIA ANKYLOSING SPONDYLITIS MARKET, BY DISTRIBUTION CHANNELS, 2020-2030 ($MILLION)
TABLE 56.SOUTH AFRICA ANKYLOSING SPONDYLITIS MARKET, BY DRUG CLASS, 2020-2030 ($MILLION)
TABLE 57.SOUTH AFRICA ANKYLOSING SPONDYLITIS MARKET, BY DISTRIBUTION CHANNELS, 2020-2030 ($MILLION)
TABLE 58.REST OF LAMEA ANKYLOSING SPONDYLITIS MARKET, BY DRUG CLASS, 2020-2030 ($MILLION)
TABLE 59.REST OF LAMEA ANKYLOSING SPONDYLITIS MARKET, BY DISTRIBUTION CHANNELS, 2020-2030 ($MILLION)
TABLE 60.ABBVIE : COMPANY SNAPSHOT
TABLE 61.ABBVIE: OPERATING SEGMENTS
TABLE 62.ABBVIE: PRODUCT PORTFOLIO
TABLE 63.AMGEN: COMPANY SNAPSHOT
TABLE 64.AMGEN: OPERATING SEGMENTS
TABLE 65.AMGEN: PRODUCT PORTFOLIO
TABLE 66.LILLY: COMPANY SNAPSHOT
TABLE 67.LILLY: OPERATING SEGMENTS
TABLE 68.LILLY: PRODUCT PORTFOLIO
TABLE 69.GILEAD: COMPANY SNAPSHOT
TABLE 70.GILEAD: OPERATING SEGMENTS
TABLE 71.GILEAD: PRODUCT PORTFOLIO
TABLE 72.JANSSEN: COMPANY SNAPSHOT
TABLE 73.JANSSEN: OPERATING SEGMENTS
TABLE 74.JANSSEN: PRODUCT PORTFOLIO
TABLE 75.MERCK: COMPANY SNAPSHOT
TABLE 76.MERCK: OPERATING SEGMENTS
TABLE 77.MERCK: PRODUCT PORTFOLIO
TABLE 78.NOVARTIS: COMPANY SNAPSHOT
TABLE 79.NOVARTIS: OPERATING SEGMENTS
TABLE 80.NOVARTIS: PRODUCT PORTFOLIO
TABLE 81.PFIZER: COMPANY SNAPSHOT
TABLE 82.PFIZER: OPERATING SEGMENTS
TABLE 83.PFIZER: PRODUCT PORTFOLIO
TABLE 84.RELIANCE: COMPANY SNAPSHOT
TABLE 85.RELIANCE: OPERATING SEGMENTS
TABLE 86.RELIANCE: PRODUCT PORTFOLIO
TABLE 87.UCB: COMPANY SNAPSHOT
TABLE 88.UCB: OPERATING SEGMENTS
TABLE 89.UCB: PRODUCT PORTFOLIO
LIST OF FIGURES
FIGURE 01.ANKYLOSING SPONDYLITIS MARKET SEGMENTATION
FIGURE 02.TOP INVESTMENT POCKETS
FIGURE 03.TOP WINNING STRATEGIES, BY YEAR, 2018–2021
FIGURE 05.TOP WINNING STRATEGIES, BY DEVELOPMENT, 2018–2021
FIGURE 06.TOP WINNING STRATEGIES, BY COMPANY, 2018–2021
FIGURE 07.MODERATE BARGAINING POWER OF SUPPLIERS
FIGURE 08.MODERATE BARGAINING POWER OF BUYERS
FIGURE 09.MODERATE THREAT OF SUBSTITUTES
FIGURE 10.MODERATE THREAT OF NEW ENTRANTS
FIGURE 11.MODERATE INTENSITY OF RIVALRY
FIGURE 12.TOP PLAYER POSITIONING, 2020
FIGURE 13.IMPACT ANALYSIS
FIGURE 14.COMPARATIVE ANALYSIS OF ANKYLOSING SPONDYLITIS MARKET BY DRUG CLASS, FOR NONSTEROIDAL ANTI-INFLAMMATORY DRUGS, BY COUNTRY, 2020–2030 (%)
FIGURE 15.COMPARATIVE ANALYSIS OF ANKYLOSING SPONDYLITIS MARKET BY DRUG CLASS, FOR TNF INHIBITORS, BY COUNTRY, 2020–2030 (%)
FIGURE 16.COMPARATIVE ANALYSIS OF ANKYLOSING SPONDYLITIS MARKET BY DRUG CLASS, FOR OTHERS, BY COUNTRY, 2020–2030 (%)
FIGURE 17.COMPARATIVE ANALYSIS OF ANKYLOSING SPONDYLITIS MARKET FOR HOSPITAL PHARMACY, BY COUNTRY, 2020 & 2030 ($MILLION)
FIGURE 18.COMPARATIVE ANALYSIS OF ANKYLOSING SPONDYLITIS MARKET FOR RETAIL PHARMACY, BY COUNTRY, 2020 & 2030 ($MILLION)
FIGURE 19.COMPARATIVE ANALYSIS OF ANKYLOSING SPONDYLITIS MARKET FOR ONLINE PHARMACY, BY COUNTRY, 2020 & 2030 ($MILLION)
FIGURE 20.ABBVIE: NET SALES, 2018–2020 ($MILLION)
FIGURE 21.ABBVIE: REVENUE SHARE BY SEGMENT, 2020 (%)
FIGURE 22.ABBVIE: REVENUE SHARE BY REGION, 2020(%)
FIGURE 23.AMGEN: NET SALES, 2018–2020 ($MILLION)
FIGURE 24.AMGEN: REVENUE SHARE BY SEGMENT, 2020 (%)
FIGURE 25.AMGEN: REVENUE SHARE BY REGION, 2020(%)
FIGURE 26.LILLY: NET SALES, 2018–2020 ($MILLION)
FIGURE 27.LILLY: REVENUE SHARE BY SEGMENT, 2020 (%)
FIGURE 28.LILLY: REVENUE SHARE BY REGION, 2020(%)
FIGURE 29.GILEAD: NET SALES, 2018–2020 ($MILLION)
FIGURE 30.GILEAD: REVENUE SHARE BY SEGMENT, 2020 (%)
FIGURE 31.GILEAD: REVENUE SHARE BY REGION, 2020(%)
FIGURE 32.JANSSEN: NET SALES, 2018–2020 ($MILLION)
FIGURE 33.JANSSEN: REVENUE SHARE BY SEGMENT, 2020 (%)
FIGURE 34.JANSSEN: REVENUE SHARE BY REGION, 2020(%)
FIGURE 35.MERCK: NET SALES, 2018–2020 ($MILLION)
FIGURE 36.MERCK: REVENUE SHARE BY SEGMENT, 2020 (%)
FIGURE 37.MERCK: REVENUE SHARE BY REGION, 2020(%)
FIGURE 38.NOVARTIS: NET SALES, 2018–2020 ($MILLION)
FIGURE 39.NOVARTIS: REVENUE SHARE BY SEGMENT, 2020 (%)
FIGURE 40.NOVARTIS: REVENUE SHARE BY REGION, 2020(%)
FIGURE 41.PFIZER: NET SALES, 2018–2020 ($MILLION)
FIGURE 42.PFIZER: REVENUE SHARE BY SEGMENT, 2020 (%)
FIGURE 43.PFIZER: REVENUE SHARE BY REGION, 2020(%)
Ankylosing spondylitis is a type of arthritis that mainly affects the spine and pelvis bone.
The ankylosing spondylitis drug class includes the NSAIDs, TNF inhibitors and others. The NSAIDs used for the management of pain and inflammation. NSAIDs dominates the market owing to advancement in treatment of ankylosing spondylitis.
The factors such as increased in prevalence of ankylosing spondylitis, rise in number of hospitals, and advancements in ankylosing spondylitis advancement & treatment. In addition, initiatives taken by the government to treat and improve lifestyle of patients are expected to drive the growth of the ankylosing spondylitis market.
North America is expected to witness the highest growth, in terms of revenue, owing to rise in prevalence of ankylosing spondylitis, the presence of key players for manufacturing and developing ankylosing spondylitis, and increase in number of hospitals and diagnostic centers, in the region.
However, the high cost of associated with ankylosing spondylitis treatment and lack of healthcare facilities can hamper market growth.
A. The total market value of Ankylosing spondylitis market is $5140.94 million in 2020.
A. The forecast period in the report is from 2021 to 2030
A. The market value of Ankylosing spondylitis market in 2021 was $5390.79 million
A. The base year for the report is 2020.
A. Yes, ankylosing spondylitis companies are profiled in the report
A. The top companies that hold the market share in Ankylosing spondylitis market are AbbVie, Inc, Amgen, Inc, Pfizer, Inc, Novartis AG, Eli Lilly and Company, UCB, Inc., Gilead Sciences, Reliance Life Sciences Pvt. Ltd, Janssen Pharmaceuticals, and Merck & Co. Inc.
A. Asia-Pacific is expected to register the highest CAGR of 6.10% from 2021 to 2030, owing to increase in number of hospitals, a rise in number of ankylosing spondylitis patients, and high population.
A. The key trends in the Ankylosing spondylitis market are by an increase in the prevalence of ankylosing spondylitis; and R&D in the ankylosing spondylitis sector.
Start reading instantly.
This Report and over 13,000+ thousand more Reports, Available with Avenue Library. T&C*.
Enterprise
License/PDF
*Taxes/Fees, if applicable will be added during checkout. All prices in USD
To ensure high-level data integrity, accurate analysis, and impeccable forecasts
For complete satisfaction
On-demand customization of scope of the report to exactly meet your needs
Targeted market view to provide pertinent information and save time of readers
Get insights on topics that are crucial for your business. Stay abreast of your interest areas.
To ensure high-level data integrity, accurate analysis, and impeccable forecasts
For complete satisfaction
On-demand customization of scope of the report to exactly meet your needs
Targeted market view to provide pertinent information and save time of readers