0
2022
Anti-blue Ray Myopia Lenses Market

Anti-Blue Ray Myopia Lenses Market

by Type (Single, Bifocal, Trifocal, Others), by Distribution Channel (Retail Stores, Hospital and Clinics, E-Commerce Platforms): Global Opportunity Analysis and Industry Forecast, 2021-2030

Report Code: A17385
Jul 2022 | Pages: 290
Tables: 120
Charts: 63
  • Formats*:

  • pdf

    Single User License, Five User
    License & Enterprise User License

  • xls

    Data Pack Excel License

  • ppt

    It comes with the additional cost
    of $2500.00 contact sales.


Anti-Blue Ray Myopia Lenses Market Research, 2030

The global anti-blue ray myopia lenses market was valued at $2.28 billion in 2021, and is projected to reach $5.36 billion by 2030, growing at a CAGR of 7.6% from 2022 to 2030. Anti-blue ray myopia lenses are becoming more and more popular. These lenses do help to lessen eye strain and shield the eyes from dangerous blue radiation, as per analysis studies undertaken by medical professionals. Some of the benefits of using anti-blue ray myopia lenses are they decrease the possibility of migraines and macular degeneration. For instance, though a strong link between blue light and macular degeneration has not yet been conclusively proven, research suggests that macular degeneration may be more likely if blue light is exposed frequently. As a result, many specialists suggest wearing anti-blue ray myopia lenses on a daily basis to reduce the risk of developing this condition. Hence, migraines and headaches are directly related to eye strain in terms of origin and effect. Thus, using these lenses can lessen migraines' frequency and severity.
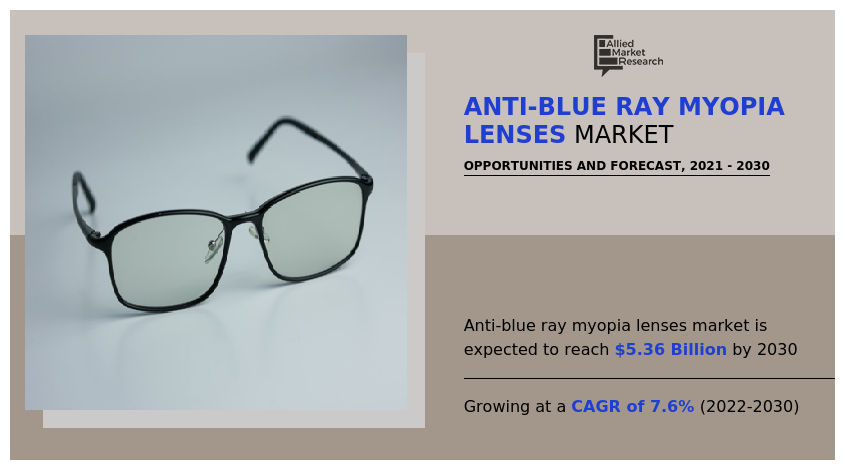
A blue-light-filtering lens retailer named ZENNI OPTICAL said in January 2021 that sales of the lenses had climbed by up to 60% yearly compared to the previous two years, with a sale of 2 million pairs in 2020. According to the aforementioned factors, the pandemic may present considerable market investment prospects in the next years.

Anti-Blue Ray Myopia Lenses Market, Anti-Blue Ray Myopia Lenses Market size, Anti-Blue Ray Myopia Lenses Market share, Anti-Blue Ray Myopia Lenses Market trends, Anti-Blue Ray Myopia Lenses Market growth, Anti-Blue Ray Myopia Lenses Market analysis, Anti-Blue Ray Myopia Lenses Market forecast, Anti-Blue Ray Myopia Lenses Market opportunity

However, due to some chemicals employed in the lens production process, anti-blue ray lenses are discovered to turn yellow over time, which is a growth-restricting factor for the industry. Such key issues may create a negative impact on the Anti-Blue Ray Myopia Lenses Market forecast period.

Due to people's increasing desire to purchase high-quality items for their eye protection, the market for anti-blue ray myopia lenses is expanding extremely quickly on a global scale. According to current market trends, people all around the world want designer and fashionable spectacles. Additionally, it is anticipated that rising trends of online virtual try-ons for eyewear will accelerate the expansion of the market internationally. Customers can choose glasses from the comfort of their homes by using the virtual try-ons to suit their preferences, wants, and likes. The market for anti-blue ray myopia lenses is growing favorably as a result of rising fashion consciousness and living standards. These factors are anticipated to propel the global anti-blue ray myopia lenses market growth.

The key players profiled in this report include Essilor, HOYA GROUP, RODENSTOCK GMBH, ZEISS, Seiko, Chemiglas Corp., Nikon, Shamir Optical Industry Ltd, Mingyue Glasses Co., Ltd., and Shanghai Conant Optics Co., Ltd.

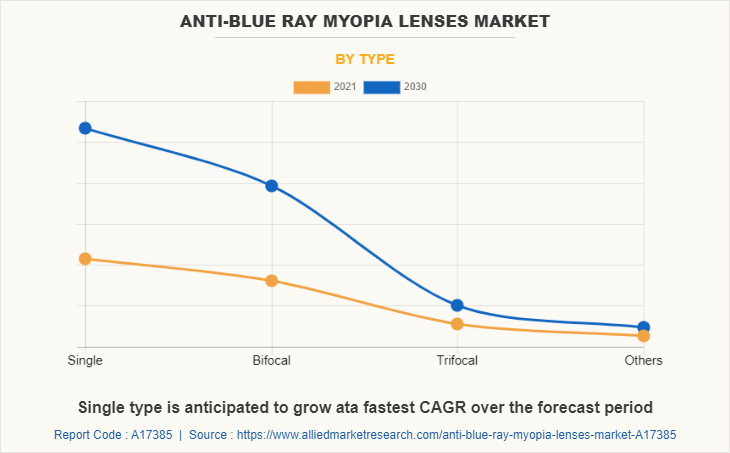
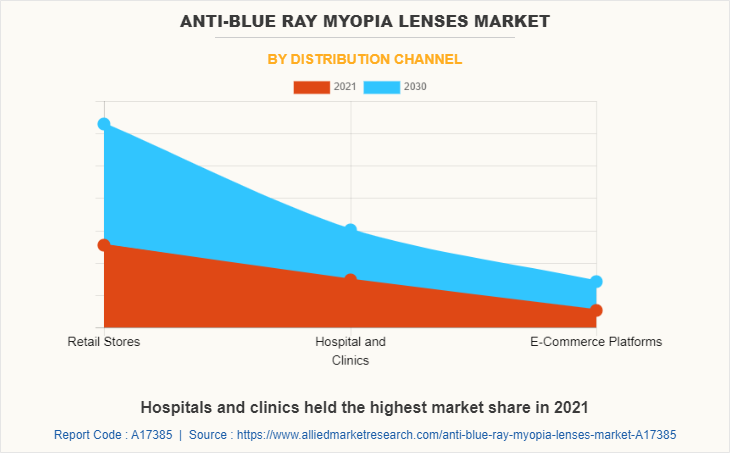
The global anti-blue ray myopia lenses market is segmented on the basis of type, distribution channel, and region. By type, the market is sub-segmented into single, bifocal, trifocal, and others. By distribution channel, the market is classified into retail stores, hospital & clinics, and e-commerce platforms. By region, the market is analyzed across North America, Europe, Asia-Pacific, and LAMEA.

The anti-blue ray myopia lenses market is segmented into Type and Distribution Channel.
Anti-Blue Ray Myopia Lenses Market

By type, the single sub-segment dominated the market in 2021 and is expected to be the fastest growing sub-segment. The majority of people under the age of 40 who need to correct their nearsightedness and farsightedness use single focal lenses. Additionally, for a large portion of the population, this kind of lens is the most economical. Moreover, major industry companies are forming strategic alliances to provide customers with the greatest anti-blue ray lenses possible. These are predicted to be the major factors affecting the anti-blue ray myopia lenses market size during the forecast period.
By type, the bifocal sub-segment is expected to significantly grow during the timeframe. The use of bifocal lenses eliminates the need to switch glasses when doing two vision correction tasks. For many patients, bifocals are a practical solution because of this. A wearer can have just one pair of glasses that make it simple to do everything, rather than needing two pairs—one for driving and one for reading. These are predicted to be the major factors affecting the anti-blue ray myopia lenses market size during the forecast period.

Anti-Blue Ray Myopia Lenses Market

By distribution channel, the retail stores sub-segment dominated the global anti-blue ray myopia lenses market share in 2021. This market expansion can be ascribed to an increase in the number of consumers who favor retail establishments like independent stores, wholesalers, and brand chains. This is due to the broad variety of lenses that retail stores offer, from budget-friendly to high-end brands, which is said to be one of the causes influencing customers to purchase eyewear or lenses from these establishments. Such distribution channel of anti-blue ray myopia lenses in the retail stores are bound to create a scope of growth for the sub-segment during the forecast period.
Anti-Blue Ray Myopia Lenses Market

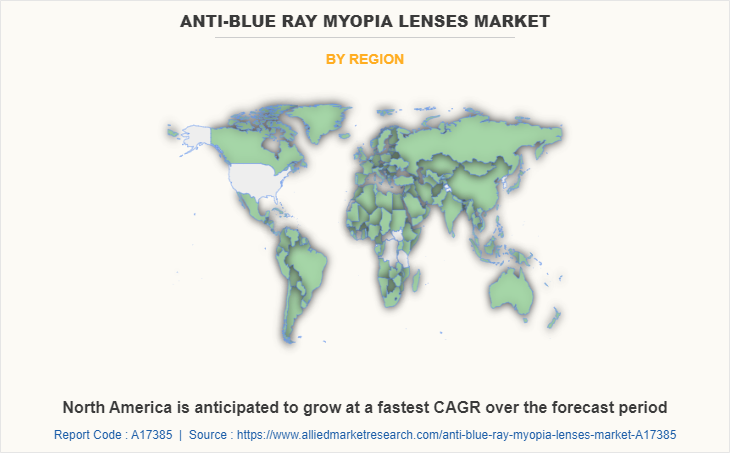
By region, Asia-Pacific market dominated the global market in 2021 and is projected to remain the fastest-growing sub-segment during the forecast period. Myopia, also known as nearsightedness and shortsightedness, is a visual anomaly wherein the resting eye concentrates the picture of a distant object at a point in front of the retina, leading to a blurred image. Myopia is becoming more common among children in Asian nations including China, India, and Japan as a result of more time spent studying or playing video games on screens while using mobile phones. Myopia has been quickly increasing among children in Southeast Asian and Eastern countries over the past 60 years as a result of educational pressure on schoolchildren, according to a review report from the NCBI (National Center for Biotechnology Information) published in May 2020. Such studies demonstrate that, in the following years, the Asia-Pacific anti-blue ray myopia lenses market will be stimulated by the exponential growth in demand for anti-blue ray myopia lenses.

Impact of COVID-19 on the Global Anti-blue Ray Myopia Lenses Industry

  • COVID-19 has positively impacted anti blue ray myopia lenses industry. During the government-enforced lockdown that was put in place to stop the spread of the coronavirus sickness, most individuals spent more time on their digital screens, computers, and mobile devices. People were exposed to blue light for extended periods of time, which negatively impacted the majority of people's eye health, increasing the demand for anti-blue ray lenses.
  • Increased exposure to digital screens, cell phones, and laptops as well as excessive contact with blue lights, which impair eye health, are mostly to blame for the rise in demand for anti-blue ray lenses during the pandemic.
  • Due to increased screen usage during the pandemic, people have been experiencing problems including dry eyes and eye discomfort from too much exposure to blue light. Because of this, the significance of maintaining good eye health has increased dramatically, fuelling market expansion.
  • ZENNI OPTICAL, an optical retail company, claimed in January 2021, that sales of blue-light filtering lenses increased up to 60% annually in comparison to the previous two years, with a sale of 2 million pairs in 2020. The aforementioned elements indicate that the pandemic may result in significant market investment opportunities in the upcoming years.

Key Benefits For Stakeholders

  • This report provides a quantitative analysis of the market segments, current trends, estimations, and dynamics of the anti-blue ray myopia lenses market analysis from 2021 to 2030 to identify the prevailing anti-blue ray myopia lenses market opportunity.
  • The market research is offered along with information related to key drivers, restraints, and opportunities.
  • Porter's five forces analysis highlights the potency of buyers and suppliers to enable stakeholders make profit-oriented business decisions and strengthen their supplier-buyer network.
  • In-depth analysis of the anti-blue ray myopia lenses market segmentation assists to determine the prevailing market opportunities.
  • Major countries in each region are mapped according to their revenue contribution to the global market.
  • Market player positioning facilitates benchmarking and provides a clear understanding of the present position of the market players.
  • The report includes the analysis of the regional as well as global anti-blue ray myopia lenses market trends, key players, market segments, application areas, and market growth strategies.

Anti-Blue Ray Myopia Lenses Market Report Highlights

Aspects Details
By Type
  • Single
  • Bifocal
  • Trifocal
  • Others
By Distribution Channel
  • Retail Stores
  • Hospital and Clinics
  • E-Commerce Platforms
By Region
  • North America  (U.S., Canada, Mexico)
  • Europe  (Germany, U.K., France, Spain, Italy, Rest of Europe)
  • Asia-Pacific  (China, Japan, India, South Korea, Australia, Rest Of Asia Pacific)
  • LAMEA  (Brazil, Saudi Arabia, UAE, South Africa, Rest of LAMEA)
Key Market Players Shamir Optical Industry Ltd., HOYA GROUP, zeiss group, Mingyue Glasses Co., Ltd., rodenstock gmbh, Shanghai Conant Optics Co., Ltd., essilor, seiko optical products, inc., Chemiglas Corp., Nikon
 
  • CHAPTER 1:INTRODUCTION

    • 1.1.Report description

    • 1.2.Key market segments

    • 1.3.Key benefits to the stakeholders

    • 1.4.Research Methodology

      • 1.4.1.Secondary research

      • 1.4.2.Primary research

      • 1.4.3.Analyst tools and models

  • CHAPTER 2:EXECUTIVE SUMMARY

    • 2.1.Key findings of the study

    • 2.2.CXO Perspective

  • CHAPTER 3:MARKET OVERVIEW

    • 3.1.Market definition and scope

    • 3.2.Key findings

      • 3.2.1.Top investment pockets

    • 3.3.Porter’s five forces analysis

    • 3.4.Top player positioning

    • 3.5.Market dynamics

      • 3.5.1.Drivers

      • 3.5.2.Restraints

      • 3.5.3.Opportunities

    • 3.6.COVID-19 Impact Analysis on the market

    • 3.7.Value Chain Analysis

    • 3.8.Key Regulation Analysis

    • 3.9.Patent Landscape

    • 3.10.Market Share Analysis

    • 3.11.Regulatory Guidelines

  • CHAPTER 4: ANTI-BLUE RAY MYOPIA LENSES MARKET, BY TYPE

    • 4.1 Overview

      • 4.1.1 Market size and forecast

    • 4.2 Single

      • 4.2.1 Key market trends, growth factors and opportunities

      • 4.2.2 Market size and forecast, by region

      • 4.2.3 Market analysis by country

    • 4.3 Bifocal

      • 4.3.1 Key market trends, growth factors and opportunities

      • 4.3.2 Market size and forecast, by region

      • 4.3.3 Market analysis by country

    • 4.4 Trifocal

      • 4.4.1 Key market trends, growth factors and opportunities

      • 4.4.2 Market size and forecast, by region

      • 4.4.3 Market analysis by country

    • 4.5 Others

      • 4.5.1 Key market trends, growth factors and opportunities

      • 4.5.2 Market size and forecast, by region

      • 4.5.3 Market analysis by country

  • CHAPTER 5: ANTI-BLUE RAY MYOPIA LENSES MARKET, BY DISTRIBUTION CHANNEL

    • 5.1 Overview

      • 5.1.1 Market size and forecast

    • 5.2 Retail Stores

      • 5.2.1 Key market trends, growth factors and opportunities

      • 5.2.2 Market size and forecast, by region

      • 5.2.3 Market analysis by country

    • 5.3 Hospital and Clinics

      • 5.3.1 Key market trends, growth factors and opportunities

      • 5.3.2 Market size and forecast, by region

      • 5.3.3 Market analysis by country

    • 5.4 E-Commerce Platforms

      • 5.4.1 Key market trends, growth factors and opportunities

      • 5.4.2 Market size and forecast, by region

      • 5.4.3 Market analysis by country

  • CHAPTER 6: ANTI-BLUE RAY MYOPIA LENSES MARKET, BY REGION

    • 6.1 Overview

      • 6.1.1 Market size and forecast

    • 6.2 North America

      • 6.2.1 Key trends and opportunities

      • 6.2.2 North America Market size and forecast, by Type

      • 6.2.3 North America Market size and forecast, by Distribution Channel

      • 6.2.4 North America Market size and forecast, by country

        • 6.2.4.1 U.S.
          • 6.2.4.1.1 Market size and forecast, by Type
          • 6.2.4.1.2 Market size and forecast, by Distribution Channel
        • 6.2.4.2 Canada
          • 6.2.4.2.1 Market size and forecast, by Type
          • 6.2.4.2.2 Market size and forecast, by Distribution Channel
        • 6.2.4.3 Mexico
          • 6.2.4.3.1 Market size and forecast, by Type
          • 6.2.4.3.2 Market size and forecast, by Distribution Channel
    • 6.3 Europe

      • 6.3.1 Key trends and opportunities

      • 6.3.2 Europe Market size and forecast, by Type

      • 6.3.3 Europe Market size and forecast, by Distribution Channel

      • 6.3.4 Europe Market size and forecast, by country

        • 6.3.4.1 Germany
          • 6.3.4.1.1 Market size and forecast, by Type
          • 6.3.4.1.2 Market size and forecast, by Distribution Channel
        • 6.3.4.2 U.K.
          • 6.3.4.2.1 Market size and forecast, by Type
          • 6.3.4.2.2 Market size and forecast, by Distribution Channel
        • 6.3.4.3 France
          • 6.3.4.3.1 Market size and forecast, by Type
          • 6.3.4.3.2 Market size and forecast, by Distribution Channel
        • 6.3.4.4 Spain
          • 6.3.4.4.1 Market size and forecast, by Type
          • 6.3.4.4.2 Market size and forecast, by Distribution Channel
        • 6.3.4.5 Italy
          • 6.3.4.5.1 Market size and forecast, by Type
          • 6.3.4.5.2 Market size and forecast, by Distribution Channel
        • 6.3.4.6 Rest of Europe
          • 6.3.4.6.1 Market size and forecast, by Type
          • 6.3.4.6.2 Market size and forecast, by Distribution Channel
    • 6.4 Asia-Pacific

      • 6.4.1 Key trends and opportunities

      • 6.4.2 Asia-Pacific Market size and forecast, by Type

      • 6.4.3 Asia-Pacific Market size and forecast, by Distribution Channel

      • 6.4.4 Asia-Pacific Market size and forecast, by country

        • 6.4.4.1 China
          • 6.4.4.1.1 Market size and forecast, by Type
          • 6.4.4.1.2 Market size and forecast, by Distribution Channel
        • 6.4.4.2 Japan
          • 6.4.4.2.1 Market size and forecast, by Type
          • 6.4.4.2.2 Market size and forecast, by Distribution Channel
        • 6.4.4.3 India
          • 6.4.4.3.1 Market size and forecast, by Type
          • 6.4.4.3.2 Market size and forecast, by Distribution Channel
        • 6.4.4.4 South Korea
          • 6.4.4.4.1 Market size and forecast, by Type
          • 6.4.4.4.2 Market size and forecast, by Distribution Channel
        • 6.4.4.5 Australia
          • 6.4.4.5.1 Market size and forecast, by Type
          • 6.4.4.5.2 Market size and forecast, by Distribution Channel
        • 6.4.4.6 Rest Of Asia Pacific
          • 6.4.4.6.1 Market size and forecast, by Type
          • 6.4.4.6.2 Market size and forecast, by Distribution Channel
    • 6.5 LAMEA

      • 6.5.1 Key trends and opportunities

      • 6.5.2 LAMEA Market size and forecast, by Type

      • 6.5.3 LAMEA Market size and forecast, by Distribution Channel

      • 6.5.4 LAMEA Market size and forecast, by country

        • 6.5.4.1 Brazil
          • 6.5.4.1.1 Market size and forecast, by Type
          • 6.5.4.1.2 Market size and forecast, by Distribution Channel
        • 6.5.4.2 Saudi Arabia
          • 6.5.4.2.1 Market size and forecast, by Type
          • 6.5.4.2.2 Market size and forecast, by Distribution Channel
        • 6.5.4.3 UAE
          • 6.5.4.3.1 Market size and forecast, by Type
          • 6.5.4.3.2 Market size and forecast, by Distribution Channel
        • 6.5.4.4 South Africa
          • 6.5.4.4.1 Market size and forecast, by Type
          • 6.5.4.4.2 Market size and forecast, by Distribution Channel
        • 6.5.4.5 Rest of LAMEA
          • 6.5.4.5.1 Market size and forecast, by Type
          • 6.5.4.5.2 Market size and forecast, by Distribution Channel
  • CHAPTER 7: COMPANY LANDSCAPE

    • 7.1. Introduction

    • 7.2. Top winning strategies

    • 7.3. Product Mapping of Top 10 Player

    • 7.4. Competitive Dashboard

    • 7.5. Competitive Heatmap

    • 7.6. Key developments

  • CHAPTER 8: COMPANY PROFILES

    • 8.1 HOYA GROUP

      • 8.1.1 Company overview

      • 8.1.2 Company snapshot

      • 8.1.3 Operating business segments

      • 8.1.4 Product portfolio

      • 8.1.5 Business performance

      • 8.1.6 Key strategic moves and developments

    • 8.2 essilor

      • 8.2.1 Company overview

      • 8.2.2 Company snapshot

      • 8.2.3 Operating business segments

      • 8.2.4 Product portfolio

      • 8.2.5 Business performance

      • 8.2.6 Key strategic moves and developments

    • 8.3 rodenstock gmbh

      • 8.3.1 Company overview

      • 8.3.2 Company snapshot

      • 8.3.3 Operating business segments

      • 8.3.4 Product portfolio

      • 8.3.5 Business performance

      • 8.3.6 Key strategic moves and developments

    • 8.4 zeiss group

      • 8.4.1 Company overview

      • 8.4.2 Company snapshot

      • 8.4.3 Operating business segments

      • 8.4.4 Product portfolio

      • 8.4.5 Business performance

      • 8.4.6 Key strategic moves and developments

    • 8.5 seiko optical products, inc.

      • 8.5.1 Company overview

      • 8.5.2 Company snapshot

      • 8.5.3 Operating business segments

      • 8.5.4 Product portfolio

      • 8.5.5 Business performance

      • 8.5.6 Key strategic moves and developments

    • 8.6 Chemiglas Corp.

      • 8.6.1 Company overview

      • 8.6.2 Company snapshot

      • 8.6.3 Operating business segments

      • 8.6.4 Product portfolio

      • 8.6.5 Business performance

      • 8.6.6 Key strategic moves and developments

    • 8.7 Nikon

      • 8.7.1 Company overview

      • 8.7.2 Company snapshot

      • 8.7.3 Operating business segments

      • 8.7.4 Product portfolio

      • 8.7.5 Business performance

      • 8.7.6 Key strategic moves and developments

    • 8.8 Shamir Optical Industry Ltd.

      • 8.8.1 Company overview

      • 8.8.2 Company snapshot

      • 8.8.3 Operating business segments

      • 8.8.4 Product portfolio

      • 8.8.5 Business performance

      • 8.8.6 Key strategic moves and developments

    • 8.9 Mingyue Glasses Co., Ltd.

      • 8.9.1 Company overview

      • 8.9.2 Company snapshot

      • 8.9.3 Operating business segments

      • 8.9.4 Product portfolio

      • 8.9.5 Business performance

      • 8.9.6 Key strategic moves and developments

    • 8.10 Shanghai Conant Optics Co., Ltd.

      • 8.10.1 Company overview

      • 8.10.2 Company snapshot

      • 8.10.3 Operating business segments

      • 8.10.4 Product portfolio

      • 8.10.5 Business performance

      • 8.10.6 Key strategic moves and developments

  • LIST OF TABLES

  • TABLE 1. GLOBAL ANTI-BLUE RAY MYOPIA LENSES MARKET, BY TYPE, 2021-2030,($MILLION)
    TABLE 2. ANTI-BLUE RAY MYOPIA LENSES MARKET REVENUE, FOR SINGLE, BY REGION , 2021-2030,($MILLION)
    TABLE 3. ANTI-BLUE RAY MYOPIA LENSES MARKET FOR SINGLE BY COUNTRY, 2021-2030,($MILLION)
    TABLE 4. ANTI-BLUE RAY MYOPIA LENSES MARKET REVENUE, FOR BIFOCAL, BY REGION , 2021-2030,($MILLION)
    TABLE 5. ANTI-BLUE RAY MYOPIA LENSES MARKET FOR BIFOCAL BY COUNTRY, 2021-2030,($MILLION)
    TABLE 6. ANTI-BLUE RAY MYOPIA LENSES MARKET REVENUE, FOR TRIFOCAL, BY REGION , 2021-2030,($MILLION)
    TABLE 7. ANTI-BLUE RAY MYOPIA LENSES MARKET FOR TRIFOCAL BY COUNTRY, 2021-2030,($MILLION)
    TABLE 8. ANTI-BLUE RAY MYOPIA LENSES MARKET REVENUE, FOR OTHERS, BY REGION , 2021-2030,($MILLION)
    TABLE 9. ANTI-BLUE RAY MYOPIA LENSES MARKET FOR OTHERS BY COUNTRY, 2021-2030,($MILLION)
    TABLE 10. GLOBAL ANTI-BLUE RAY MYOPIA LENSES MARKET, BY DISTRIBUTION CHANNEL, 2021-2030,($MILLION)
    TABLE 11. ANTI-BLUE RAY MYOPIA LENSES MARKET REVENUE, FOR RETAIL STORES, BY REGION , 2021-2030,($MILLION)
    TABLE 12. ANTI-BLUE RAY MYOPIA LENSES MARKET FOR RETAIL STORES BY COUNTRY, 2021-2030,($MILLION)
    TABLE 13. ANTI-BLUE RAY MYOPIA LENSES MARKET REVENUE, FOR HOSPITAL AND CLINICS, BY REGION , 2021-2030,($MILLION)
    TABLE 14. ANTI-BLUE RAY MYOPIA LENSES MARKET FOR HOSPITAL AND CLINICS BY COUNTRY, 2021-2030,($MILLION)
    TABLE 15. ANTI-BLUE RAY MYOPIA LENSES MARKET REVENUE, FOR E-COMMERCE PLATFORMS, BY REGION , 2021-2030,($MILLION)
    TABLE 16. ANTI-BLUE RAY MYOPIA LENSES MARKET FOR E-COMMERCE PLATFORMS BY COUNTRY, 2021-2030,($MILLION)
    TABLE 17. ANTI-BLUE RAY MYOPIA LENSES MARKET, BY REGION, 2021-2030,($MILLION)
    TABLE 18. NORTH AMERICA ANTI-BLUE RAY MYOPIA LENSES MARKET, BY TYPE, 2021-2030,($MILLION)
    TABLE 19. NORTH AMERICA ANTI-BLUE RAY MYOPIA LENSES MARKET, BY DISTRIBUTION CHANNEL, 2021-2030,($MILLION)
    TABLE 20. NORTH AMERICA ANTI-BLUE RAY MYOPIA LENSES MARKET, BY COUNTRY, 2021-2030,($MILLION)
    TABLE 21. U.S. ANTI-BLUE RAY MYOPIA LENSES MARKET, BY TYPE, 2021-2030,($MILLION)
    TABLE 22. U.S. ANTI-BLUE RAY MYOPIA LENSES MARKET, BY DISTRIBUTION CHANNEL, 2021-2030,($MILLION)
    TABLE 23. CANADA ANTI-BLUE RAY MYOPIA LENSES MARKET, BY TYPE, 2021-2030,($MILLION)
    TABLE 24. CANADA ANTI-BLUE RAY MYOPIA LENSES MARKET, BY DISTRIBUTION CHANNEL, 2021-2030,($MILLION)
    TABLE 25. MEXICO ANTI-BLUE RAY MYOPIA LENSES MARKET, BY TYPE, 2021-2030,($MILLION)
    TABLE 26. MEXICO ANTI-BLUE RAY MYOPIA LENSES MARKET, BY DISTRIBUTION CHANNEL, 2021-2030,($MILLION)
    TABLE 27. EUROPE ANTI-BLUE RAY MYOPIA LENSES MARKET, BY TYPE, 2021-2030,($MILLION)
    TABLE 28. EUROPE ANTI-BLUE RAY MYOPIA LENSES MARKET, BY DISTRIBUTION CHANNEL, 2021-2030,($MILLION)
    TABLE 29. EUROPE ANTI-BLUE RAY MYOPIA LENSES MARKET, BY COUNTRY, 2021-2030,($MILLION)
    TABLE 30. GERMANY ANTI-BLUE RAY MYOPIA LENSES MARKET, BY TYPE, 2021-2030,($MILLION)
    TABLE 31. GERMANY ANTI-BLUE RAY MYOPIA LENSES MARKET, BY DISTRIBUTION CHANNEL, 2021-2030,($MILLION)
    TABLE 32. U.K. ANTI-BLUE RAY MYOPIA LENSES MARKET, BY TYPE, 2021-2030,($MILLION)
    TABLE 33. U.K. ANTI-BLUE RAY MYOPIA LENSES MARKET, BY DISTRIBUTION CHANNEL, 2021-2030,($MILLION)
    TABLE 34. FRANCE ANTI-BLUE RAY MYOPIA LENSES MARKET, BY TYPE, 2021-2030,($MILLION)
    TABLE 35. FRANCE ANTI-BLUE RAY MYOPIA LENSES MARKET, BY DISTRIBUTION CHANNEL, 2021-2030,($MILLION)
    TABLE 36. SPAIN ANTI-BLUE RAY MYOPIA LENSES MARKET, BY TYPE, 2021-2030,($MILLION)
    TABLE 37. SPAIN ANTI-BLUE RAY MYOPIA LENSES MARKET, BY DISTRIBUTION CHANNEL, 2021-2030,($MILLION)
    TABLE 38. ITALY ANTI-BLUE RAY MYOPIA LENSES MARKET, BY TYPE, 2021-2030,($MILLION)
    TABLE 39. ITALY ANTI-BLUE RAY MYOPIA LENSES MARKET, BY DISTRIBUTION CHANNEL, 2021-2030,($MILLION)
    TABLE 40. REST OF EUROPE ANTI-BLUE RAY MYOPIA LENSES MARKET, BY TYPE, 2021-2030,($MILLION)
    TABLE 41. REST OF EUROPE ANTI-BLUE RAY MYOPIA LENSES MARKET, BY DISTRIBUTION CHANNEL, 2021-2030,($MILLION)
    TABLE 42. ASIA-PACIFIC ANTI-BLUE RAY MYOPIA LENSES MARKET, BY TYPE, 2021-2030,($MILLION)
    TABLE 43. ASIA-PACIFIC ANTI-BLUE RAY MYOPIA LENSES MARKET, BY DISTRIBUTION CHANNEL, 2021-2030,($MILLION)
    TABLE 44. ASIA-PACIFIC ANTI-BLUE RAY MYOPIA LENSES MARKET, BY COUNTRY, 2021-2030,($MILLION)
    TABLE 45. CHINA ANTI-BLUE RAY MYOPIA LENSES MARKET, BY TYPE, 2021-2030,($MILLION)
    TABLE 46. CHINA ANTI-BLUE RAY MYOPIA LENSES MARKET, BY DISTRIBUTION CHANNEL, 2021-2030,($MILLION)
    TABLE 47. JAPAN ANTI-BLUE RAY MYOPIA LENSES MARKET, BY TYPE, 2021-2030,($MILLION)
    TABLE 48. JAPAN ANTI-BLUE RAY MYOPIA LENSES MARKET, BY DISTRIBUTION CHANNEL, 2021-2030,($MILLION)
    TABLE 49. INDIA ANTI-BLUE RAY MYOPIA LENSES MARKET, BY TYPE, 2021-2030,($MILLION)
    TABLE 50. INDIA ANTI-BLUE RAY MYOPIA LENSES MARKET, BY DISTRIBUTION CHANNEL, 2021-2030,($MILLION)
    TABLE 51. SOUTH KOREA ANTI-BLUE RAY MYOPIA LENSES MARKET, BY TYPE, 2021-2030,($MILLION)
    TABLE 52. SOUTH KOREA ANTI-BLUE RAY MYOPIA LENSES MARKET, BY DISTRIBUTION CHANNEL, 2021-2030,($MILLION)
    TABLE 53. AUSTRALIA ANTI-BLUE RAY MYOPIA LENSES MARKET, BY TYPE, 2021-2030,($MILLION)
    TABLE 54. AUSTRALIA ANTI-BLUE RAY MYOPIA LENSES MARKET, BY DISTRIBUTION CHANNEL, 2021-2030,($MILLION)
    TABLE 55. REST OF ASIA PACIFIC ANTI-BLUE RAY MYOPIA LENSES MARKET, BY TYPE, 2021-2030,($MILLION)
    TABLE 56. REST OF ASIA PACIFIC ANTI-BLUE RAY MYOPIA LENSES MARKET, BY DISTRIBUTION CHANNEL, 2021-2030,($MILLION)
    TABLE 57. LAMEA ANTI-BLUE RAY MYOPIA LENSES MARKET, BY TYPE, 2021-2030,($MILLION)
    TABLE 58. LAMEA ANTI-BLUE RAY MYOPIA LENSES MARKET, BY DISTRIBUTION CHANNEL, 2021-2030,($MILLION)
    TABLE 59. LAMEA ANTI-BLUE RAY MYOPIA LENSES MARKET, BY COUNTRY, 2021-2030,($MILLION)
    TABLE 60. BRAZIL ANTI-BLUE RAY MYOPIA LENSES MARKET, BY TYPE, 2021-2030,($MILLION)
    TABLE 61. BRAZIL ANTI-BLUE RAY MYOPIA LENSES MARKET, BY DISTRIBUTION CHANNEL, 2021-2030,($MILLION)
    TABLE 62. SAUDI ARABIA ANTI-BLUE RAY MYOPIA LENSES MARKET, BY TYPE, 2021-2030,($MILLION)
    TABLE 63. SAUDI ARABIA ANTI-BLUE RAY MYOPIA LENSES MARKET, BY DISTRIBUTION CHANNEL, 2021-2030,($MILLION)
    TABLE 64. UAE ANTI-BLUE RAY MYOPIA LENSES MARKET, BY TYPE, 2021-2030,($MILLION)
    TABLE 65. UAE ANTI-BLUE RAY MYOPIA LENSES MARKET, BY DISTRIBUTION CHANNEL, 2021-2030,($MILLION)
    TABLE 66. SOUTH AFRICA ANTI-BLUE RAY MYOPIA LENSES MARKET, BY TYPE, 2021-2030,($MILLION)
    TABLE 67. SOUTH AFRICA ANTI-BLUE RAY MYOPIA LENSES MARKET, BY DISTRIBUTION CHANNEL, 2021-2030,($MILLION)
    TABLE 68. REST OF LAMEA ANTI-BLUE RAY MYOPIA LENSES MARKET, BY TYPE, 2021-2030,($MILLION)
    TABLE 69. REST OF LAMEA ANTI-BLUE RAY MYOPIA LENSES MARKET, BY DISTRIBUTION CHANNEL, 2021-2030,($MILLION)
    TABLE 70.HOYA GROUP: COMPANY SNAPSHOT
    TABLE 71.HOYA GROUP: OPERATING SEGMENTS
    TABLE 72.HOYA GROUP: PRODUCT PORTFOLIO
    TABLE 73.HOYA GROUP: NET SALES,
    TABLE 74.HOYA GROUP: KEY STRATERGIES
    TABLE 75.ESSILOR: COMPANY SNAPSHOT
    TABLE 76.ESSILOR: OPERATING SEGMENTS
    TABLE 77.ESSILOR: PRODUCT PORTFOLIO
    TABLE 78.ESSILOR: NET SALES,
    TABLE 79.ESSILOR: KEY STRATERGIES
    TABLE 80.RODENSTOCK GMBH: COMPANY SNAPSHOT
    TABLE 81.RODENSTOCK GMBH: OPERATING SEGMENTS
    TABLE 82.RODENSTOCK GMBH: PRODUCT PORTFOLIO
    TABLE 83.RODENSTOCK GMBH: NET SALES,
    TABLE 84.RODENSTOCK GMBH: KEY STRATERGIES
    TABLE 85.ZEISS GROUP: COMPANY SNAPSHOT
    TABLE 86.ZEISS GROUP: OPERATING SEGMENTS
    TABLE 87.ZEISS GROUP: PRODUCT PORTFOLIO
    TABLE 88.ZEISS GROUP: NET SALES,
    TABLE 89.ZEISS GROUP: KEY STRATERGIES
    TABLE 108.SHAMIR OPTICAL INDUSTRY LTD.: NET SALES,
    TABLE 109.SHAMIR OPTICAL INDUSTRY LTD.: KEY STRATERGIES
    TABLE 110.MINGYUE GLASSES CO., LTD.: COMPANY SNAPSHOT
    TABLE 90.SEIKO OPTICAL PRODUCTS, INC.: COMPANY SNAPSHOT
    TABLE 91.SEIKO OPTICAL PRODUCTS, INC.: OPERATING SEGMENTS
    TABLE 92.SEIKO OPTICAL PRODUCTS, INC.: PRODUCT PORTFOLIO
    TABLE 93.SEIKO OPTICAL PRODUCTS, INC.: NET SALES,
    TABLE 94.SEIKO OPTICAL PRODUCTS, INC.: KEY STRATERGIES
    TABLE 95.CHEMIGLAS CORP.: COMPANY SNAPSHOT
    TABLE 96.CHEMIGLAS CORP.: OPERATING SEGMENTS
    TABLE 97.CHEMIGLAS CORP.: PRODUCT PORTFOLIO
    TABLE 98.CHEMIGLAS CORP.: NET SALES,
    TABLE 99.CHEMIGLAS CORP.: KEY STRATERGIES
    TABLE 100.NIKON: COMPANY SNAPSHOT
    TABLE 101.NIKON: OPERATING SEGMENTS
    TABLE 102.NIKON: PRODUCT PORTFOLIO
    TABLE 103.NIKON: NET SALES,
    TABLE 104.NIKON: KEY STRATERGIES
    TABLE 105.SHAMIR OPTICAL INDUSTRY LTD.: COMPANY SNAPSHOT
    TABLE 106.SHAMIR OPTICAL INDUSTRY LTD.: OPERATING SEGMENTS
    TABLE 107.SHAMIR OPTICAL INDUSTRY LTD.: PRODUCT PORTFOLIO
    TABLE 111.MINGYUE GLASSES CO., LTD.: OPERATING SEGMENTS
    TABLE 112.MINGYUE GLASSES CO., LTD.: PRODUCT PORTFOLIO
    TABLE 113.MINGYUE GLASSES CO., LTD.: NET SALES,
    TABLE 114.MINGYUE GLASSES CO., LTD.: KEY STRATERGIES
    TABLE 115.SHANGHAI CONANT OPTICS CO., LTD.: COMPANY SNAPSHOT
    TABLE 116.SHANGHAI CONANT OPTICS CO., LTD.: OPERATING SEGMENTS
    TABLE 117.SHANGHAI CONANT OPTICS CO., LTD.: PRODUCT PORTFOLIO
    TABLE 118.SHANGHAI CONANT OPTICS CO., LTD.: NET SALES,
    TABLE 119.SHANGHAI CONANT OPTICS CO., LTD.: KEY STRATERGIES
  • LIST OF FIGURES

  • FIGURE 1.ANTI-BLUE RAY MYOPIA LENSES MARKET SEGMENTATION
    FIGURE 2.ANTI-BLUE RAY MYOPIA LENSES MARKET,2021-2030
    FIGURE 3.ANTI-BLUE RAY MYOPIA LENSES MARKET,2021-2030
    FIGURE 4. TOP INVESTMENT POCKETS, BY REGION
    FIGURE 5.PORTER FIVE-1
    FIGURE 6.PORTER FIVE-2
    FIGURE 7.PORTER FIVE-3
    FIGURE 8.PORTER FIVE-4
    FIGURE 9.PORTER FIVE-5
    FIGURE 10.TOP PLAYER POSITIONING
    FIGURE 11.ANTI-BLUE RAY MYOPIA LENSES MARKET:DRIVERS, RESTRAINTS AND OPPORTUNITIES
    FIGURE 12.VALUE CHAIN ANALYSIS
    FIGURE 13.KEY REGULATION ANALYSIS
    FIGURE 14.PATENT ANALYSIS BY COMPANY
    FIGURE 15.PATENT ANALYSIS BY COUNTRY
    FIGURE 16.MARKET SHARE ANALYSIS
    FIGURE 17.REGULATORY GUIDELINES
    FIGURE 18.ANTI-BLUE RAY MYOPIA LENSES MARKET,BY TYPE,2021(%)
    FIGURE 19.COMPARATIVE SHARE ANALYSIS OF SINGLE ANTI-BLUE RAY MYOPIA LENSES MARKET,2021-2030(%)
    FIGURE 20.COMPARATIVE SHARE ANALYSIS OF BIFOCAL ANTI-BLUE RAY MYOPIA LENSES MARKET,2021-2030(%)
    FIGURE 21.COMPARATIVE SHARE ANALYSIS OF TRIFOCAL ANTI-BLUE RAY MYOPIA LENSES MARKET,2021-2030(%)
    FIGURE 22.COMPARATIVE SHARE ANALYSIS OF OTHERS ANTI-BLUE RAY MYOPIA LENSES MARKET,2021-2030(%)
    FIGURE 23.ANTI-BLUE RAY MYOPIA LENSES MARKET,BY DISTRIBUTION CHANNEL,2021(%)
    FIGURE 24.COMPARATIVE SHARE ANALYSIS OF RETAIL STORES ANTI-BLUE RAY MYOPIA LENSES MARKET,2021-2030(%)
    FIGURE 25.COMPARATIVE SHARE ANALYSIS OF HOSPITAL AND CLINICS ANTI-BLUE RAY MYOPIA LENSES MARKET,2021-2030(%)
    FIGURE 26.COMPARATIVE SHARE ANALYSIS OF E-COMMERCE PLATFORMS ANTI-BLUE RAY MYOPIA LENSES MARKET,2021-2030(%)
    FIGURE 27.ANTI-BLUE RAY MYOPIA LENSES MARKET BY REGION,2021
    FIGURE 28.U.S. ANTI-BLUE RAY MYOPIA LENSES MARKET,2021-2030($MILLION)
    FIGURE 29.CANADA ANTI-BLUE RAY MYOPIA LENSES MARKET,2021-2030($MILLION)
    FIGURE 30.MEXICO ANTI-BLUE RAY MYOPIA LENSES MARKET,2021-2030($MILLION)
    FIGURE 31.GERMANY ANTI-BLUE RAY MYOPIA LENSES MARKET,2021-2030($MILLION)
    FIGURE 32.U.K. ANTI-BLUE RAY MYOPIA LENSES MARKET,2021-2030($MILLION)
    FIGURE 33.FRANCE ANTI-BLUE RAY MYOPIA LENSES MARKET,2021-2030($MILLION)
    FIGURE 34.SPAIN ANTI-BLUE RAY MYOPIA LENSES MARKET,2021-2030($MILLION)
    FIGURE 35.ITALY ANTI-BLUE RAY MYOPIA LENSES MARKET,2021-2030($MILLION)
    FIGURE 36.REST OF EUROPE ANTI-BLUE RAY MYOPIA LENSES MARKET,2021-2030($MILLION)
    FIGURE 37.CHINA ANTI-BLUE RAY MYOPIA LENSES MARKET,2021-2030($MILLION)
    FIGURE 38.JAPAN ANTI-BLUE RAY MYOPIA LENSES MARKET,2021-2030($MILLION)
    FIGURE 39.INDIA ANTI-BLUE RAY MYOPIA LENSES MARKET,2021-2030($MILLION)
    FIGURE 40.SOUTH KOREA ANTI-BLUE RAY MYOPIA LENSES MARKET,2021-2030($MILLION)
    FIGURE 41.AUSTRALIA ANTI-BLUE RAY MYOPIA LENSES MARKET,2021-2030($MILLION)
    FIGURE 42.REST OF ASIA PACIFIC ANTI-BLUE RAY MYOPIA LENSES MARKET,2021-2030($MILLION)
    FIGURE 43.BRAZIL ANTI-BLUE RAY MYOPIA LENSES MARKET,2021-2030($MILLION)
    FIGURE 44.SAUDI ARABIA ANTI-BLUE RAY MYOPIA LENSES MARKET,2021-2030($MILLION)
    FIGURE 45.UAE ANTI-BLUE RAY MYOPIA LENSES MARKET,2021-2030($MILLION)
    FIGURE 46.SOUTH AFRICA ANTI-BLUE RAY MYOPIA LENSES MARKET,2021-2030($MILLION)
    FIGURE 47.REST OF LAMEA ANTI-BLUE RAY MYOPIA LENSES MARKET,2021-2030($MILLION)
    FIGURE 48. TOP WINNING STRATEGIES, BY YEAR
    FIGURE 49. TOP WINNING STRATEGIES, BY DEVELOPMENT
    FIGURE 50. TOP WINNING STRATEGIES, BY COMPANY
    FIGURE 51.PRODUCT MAPPING OF TOP 10 PLAYERS
    FIGURE 52.COMPETITIVE DASHBOARD
    FIGURE 53.COMPETITIVE HEATMAP OF TOP 10 KEY PLAYERS
    FIGURE 54.HOYA GROUP.: NET SALES ,($MILLION)
    FIGURE 55.ESSILOR.: NET SALES ,($MILLION)
    FIGURE 56.RODENSTOCK GMBH.: NET SALES ,($MILLION)
    FIGURE 57.ZEISS GROUP.: NET SALES ,($MILLION)
    FIGURE 58.SEIKO OPTICAL PRODUCTS, INC..: NET SALES ,($MILLION)
    FIGURE 59.CHEMIGLAS CORP..: NET SALES ,($MILLION)
    FIGURE 60.NIKON.: NET SALES ,($MILLION)
    FIGURE 61.SHAMIR OPTICAL INDUSTRY LTD..: NET SALES ,($MILLION)
    FIGURE 62.MINGYUE GLASSES CO., LTD..: NET SALES ,($MILLION)
    FIGURE 63.SHANGHAI CONANT OPTICS CO., LTD..: NET SALES ,($MILLION)


Increase in demand for anti-blue ray myopia lenses due to the shift to remote work culture which increased the usage of digital screens and mobile phones is the key factor that is projected to drive the growth of the global anti-blue ray myopia lenses market during the forecast period. In addition, the use of digital screens and mobile phones is increasing, which is primarily driving the large expansion of the anti-blue ray myopia lenses market. However, the price of anti-blue ray myopia lenses is higher than that of regular myopia lenses. During the forecast period, this factor is anticipated to impede the expansion of the global market. Future business prospects could be enormous as a result of people adopting fashion trends more frequently. Eyewear is a fashion statement these days, and many people wear them in accordance with the newest industry trends. The market for anti-blue ray myopia lenses is also anticipated to increase due to the rise in myopia among young adults and children.

Among the analyzed regions, Asia-Pacific is expected to account for the highest revenue in the market by the end of 2030, followed by Europe, North America, and LAMEA. Growing fashion trends for anti-blue ray myopia lenses in the market is the key factor responsible for leading position of North America and Asia-Pacific in the global anti-blue ray myopia lenses market.

PURCHASE OPTIONS

Call or Email us

U.S.-Canada Toll-free: +1-800-792-5285
Int'l : +1-503-894-6022
Europe : +44-845-528-1300
Email : help@alliedmarketresearch.com
 
FREQUENTLY ASKED QUESTIONS?

A. Strategic alliances among market players, along with growing eye disease is expected to accelerate the growth of the anti-blue ray myopia lenses market is the major market driver. In addition, the increasing adoption of fashion trends may create huge opportunities for the market in the future. Now-a-days, eyewear is a fashion statement, and many people are using them according to the latest market trends, which is estimated to generate excellent opportunities in the anti-blue ray myopia lenses market.

A. Retail stores sub-segment of the distribution channel acquired the maximum share of the global anti-blue ray myopia market in 2021.

A. The use of anti-blue ray myopia lenses as single, bifocal, trifocal, others is estimated to drive the adoption of anti-blue ray myopia lenses.

A. North America will provide more business opportunities for the global anti-blue ray myopia lenses market in future.

A. Essilor, HOYA GROUP, RODENSTOCK GMBH, ZEISS, Seiko, Chemiglas Corp., Nikon, Shamir Optical Industry Ltd, Mingyue Glasses Co., Ltd., and Shanghai Conant Optics Co., Ltd. are the major players in the anti-blue ray myopia lenses market.

A. The major growth strategies adopted by anti-blue ray myopia lenses market players are investment and agreement.

A. The report provides an extensive qualitative and quantitative analysis of the current trends and future estimations of the global anti-blue ray myopia lenses market from 2021 to 2030 to determine the prevailing opportunities.

Looking for Customization?

 Customization Request

Have a Question?

 Speak with Analyst

Any Confusion?

 Inquire Before Buying

Have a glance of the Report

  Request Sample
RELATED TAGS

Purchase Full Report of
Anti-blue Ray Myopia Lenses Market

Start reading instantly.
This Report and over 68,439+ more Reports, Available with Avenue Library. T&C*.

  • Online Only
  • $3,456
  • Online cloud access only
  • Restricted print, copy, paste & download
  • Read only
  • Free industry update
    (Within 180 days)
  • Free report update in next update cycle
    (Jul 2023 - Jul 2024)
  • Data Pack
  • $3,840
  • Restricted to one authorized user
  • One print only
  • Available in
    Excel
  • Free industry update
    (Within 180 days)
  •   Free report update in next update cycle
    (Jul 2023 - Jul 2024)
  • Single User
  • $5,769
  • Restricted to one authorized user
  • One print only
  • Available in
    PDF
  • Free industry update
    (Within 180 days)
  •   Free report update in next update cycle
    (Jul 2023 - Jul 2024)
  • Five Users
  • $6,450
  • Limited to five authorized users
  • Print upto five copies
  • Available in
    PDF
  • Free industry update
    (Within 180 days)
  •   Free report update in next update cycle
    (Jul 2023 - Jul 2024)
  • Enterprise
    License/PDF

  • $10,995
  • Unlimited
    within
    company/enterprise
  • Available in Excel & PDF
  • Free industry update
    (Within 180 days)
  •   Free report update in next update cycle
    (Jul 2023 - Jul 2024)
  • Library
    Membership

  • $999 $ 1,175
    Per User/ Per month/ Billed annually
  • Published Content
    E-access
  • Company Profiles
    E-access
  • Newly Added Content Access
  • 10 PDF
    Downloads
  • 5 Excel Data
    Pack Downloads
  • 250 Company Profiles PDF Downloads
  • Buy Now

*Taxes/Fees, if applicable will be added during checkout. All prices in USD

RELATED REPORTS
 

Why Allied Market Research?


Infallible Methodology

To ensure high-level data integrity, accurate analysis, and impeccable forecasts

Analyst Support

For complete satisfaction

Customization

On-demand customization of scope of the report to exactly meet your needs

TARGETED MARKET VIEW

Targeted market view to provide pertinent information and save time of readers

Get fresh content delivered

Get insights on topics that are crucial for your business. Stay abreast of your interest areas.

Get Industry Data Alerts

Why Allied Market Research?

Infallible Methodology

To ensure high-level data integrity, accurate analysis, and impeccable forecasts

Analyst Support

For complete satisfaction

Customization

On-demand customization of scope of the report to exactly meet your needs

TARGETED MARKET VIEW

Targeted market view to provide pertinent information and save time of readers