0
2022
Antibacterial Soap Market

Antibacterial Soap Market

by Form (Bar, Powder, Liquid), by Application (Hand wash, Body wash), by Distribution Channel (Supermarket and Hypermarket, Pharmacy stores, Online Sales, Other channels): Global Opportunity Analysis and Industry Forecast, 2020-2030

Report Code: A16014
Apr 2022 | Pages: 300
Tables: 152
Charts: 61
  • Formats*:

  • pdf

    Single User License, Five User
    License & Enterprise User License

  • xls

    Data Pack Excel License

  • ppt

    It comes with the additional cost
    of $2500.00 contact sales.


Antibacterial Soap Market Research, 2030

The global antibacterial soap market was valued at $3.7 billion in 2020, and is projected to reach $6.9 billion by 2030, growing at a CAGR of 6.3% from 2021 to 2030.
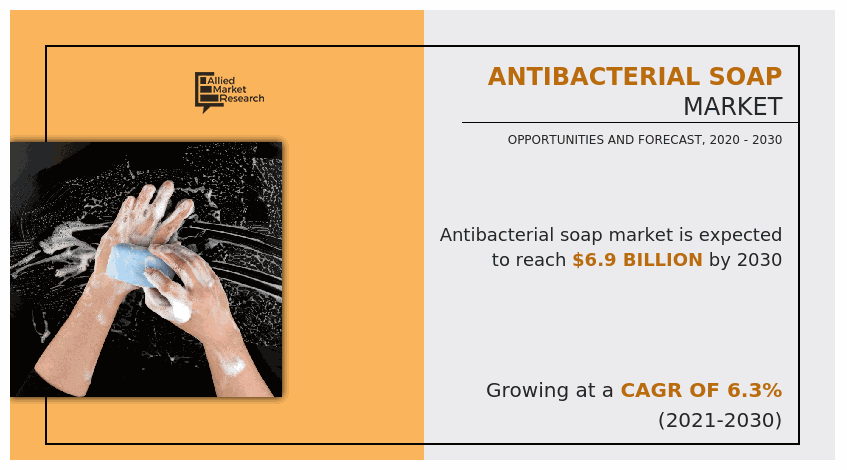
The outbreak of the COVID-19 positively impacts the market growth. Panic buying and stockpiling of antibacterial soaps increases the demand for antibacterial soaps. The government authorities initiated campaigns to spread awareness among people, which promoted frequent washing of hands would kill the virus and limit its spread.

Antibacterial Soap Market, Antibacterial Soap Industry, Antibacterial Soap Market Size, Antibacterial Soap Market Share, Antibacterial Soap Market Trends, Antibacterial Soap Market Growth

Antibacterial soap is used for cleaning and disinfecting hands and body. The global antibacterial soap market size is expected to witness significant growth, owing to increase in burden of infectious diseases, rise in health-conscious people, and growth in awareness regarding health benefits of using antibacterial soaps. According to the World Bank, maintaining hygiene can significantly reduce healthcare expenses. Washing hands reduces the risks of respiratory diseases among the population by 16% – 20%. According to the Centers for Disease Control and Prevention (CDC), washing hands with soap and water can reduce deaths caused due to diarrhea by 50%. Implementation of initiatives by the government, schools, and NGOs and various campaigns of the manufacturers to spread awareness regarding personal hygiene and handwashing boost the growth of the antibacterial soap market during the forecast period.

Rise in investments in R&D to promote adoption of the herbal and organic ingredients in the antibacterial soaps and regular product launches in varied fragrances boosts the sales of antibacterial soaps. For instance, Lifebuoy, a top antibacterial soap brand of Unilever entered into a partnership with TESCO stores, in February 2020, to provide hand wash liquid soaps to adopted schools of TESCO during the pandemic. Furthermore, increase in awareness among population and health professionals regarding the healthcare associated infections drives the demand for antibacterial soaps across hospitals and clinics. Moreover, rise in health awareness fuels the adoption of the antibacterial soaps in the food service units, including restaurants, hotels, and cafes across the globe.

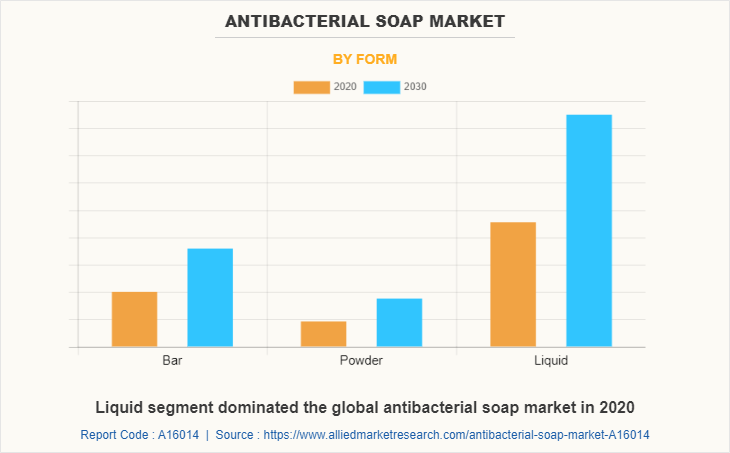
As per the antibacterial soap market forecast, the market is segmented on the basis of form, application, distribution channel, and region. Depending on the form, it is segregated into bar, powder, and liquid. According to application, it is divided into hand wash and body wash. As per the distribution channel, it is categorized into supermarket & hypermarket, pharmacy stores, online sales, and other channels. Region-wise, it is analyzed across North America (the U.S., Canada, and Mexico), Europe (the UK, Germany, France, Italy, Spain, Russia, and rest of Europe), Asia-Pacific (China, Japan, India, South Korea, Australia, and rest of Asia-Pacific), and LAMEA (Brazil, Argentina, South Africa, Saudi Arabia, and rest of LAMEA).
Antibacterial Soap Market

Depending on form, the liquid segment dominated the global market, accounting for 61.1% of the antibacterial soap market share in 2020. Increase in preferences for the liquid soaps among the consumers, owing to easy usage and convenience associated with liquid soap fuels the growth of the market. Surge in demand for from the healthcare sector is expected to boost the requirement for antibacterial soaps in the future.
Antibacterial Soap Market

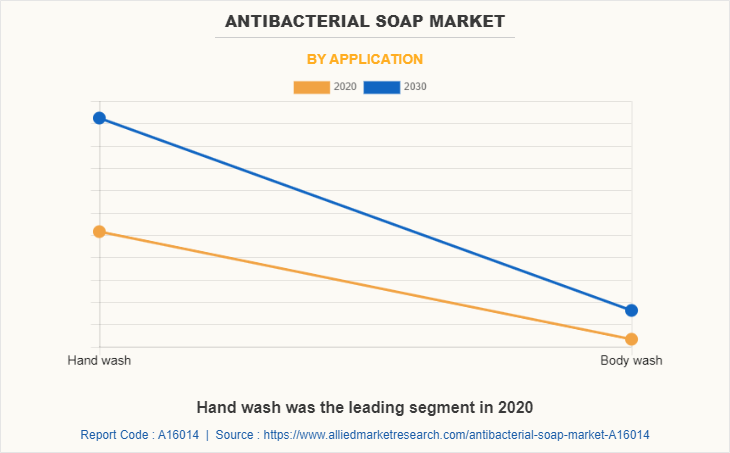
According to application, the hand wash segment dominated the antibacterial soap market demand. Increase in awareness regarding health benefits of washing hands contributes in the growth of the market. Rise in demand for handwashing to prevent infections and diseases caused due to contaminated hands results in the dominance of the hand wash segment.
Antibacterial Soap Market

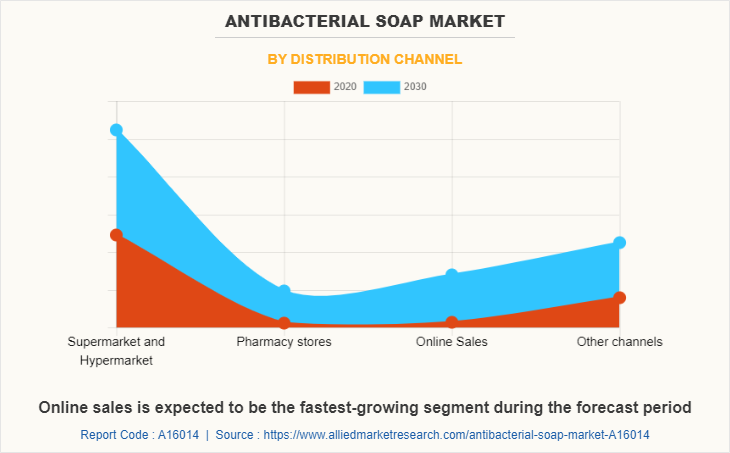
As per the distribution channel, the online sales segment is expected to foresee fastest growth during the forecast period. This is attributable to the growth in adoption of smartphones, rise in penetration of internet, increase in adoption of the e-commerce platforms among the consumers, and convenience of shopping from home are the primary factors that foster the growth of the online sales segment in the global market.

Antibacterial Soap Market

Region-wise, Asia-Pacific is expected to exhibit significant growth, owing to various factors, including increase in population, rise in health awareness, urbanization, surge in penetration of liquid antibacterial soaps, growth in disposable income, improvement in standards of living, and rise in prevalence of infectious diseases.

Players operating in global antibacterial soap industry have adopted various developmental strategies to expand their market share, exploit the antibacterial soap market opportunities, and increase their profitability in the market. The key players profiled in this report include 3M, Amway Corporation, Godrej Consumer Products Limited, GOJO Industries, Inc., Henkel AG & Co. KGaA, ITC Ltd., Reckitt-Benckiser Group PLC. , The Procter & Gamble Company, Unilever Plc., and Vi-Jon.

Key Benefits For Stakeholders

  • This report provides a quantitative analysis of the market segments, current trends, estimations, and dynamics of the antibacterial soap market analysis from 2020 to 2030 to identify the prevailing antibacterial soap market opportunity.
  • The market research is offered along with information related to key drivers, restraints, and opportunities.
  • Porter's five forces analysis highlights the potency of buyers and suppliers to enable stakeholders make profit-oriented business decisions and strengthen their supplier-buyer network.
  • In-depth analysis of the antibacterial soap market segmentation assists to determine the prevailing market opportunities.
  • Major countries in each region are mapped according to their revenue contribution to the global market.
  • Market player positioning facilitates benchmarking and provides a clear understanding of the present position of the market players.
  • The report includes the analysis of the regional as well as global antibacterial soap market trends, key players, market segments, application areas, and antibacterial soap market growth strategies.

Antibacterial Soap Market Report Highlights

Aspects Details
By Form
  • Bar
  • Powder
  • Liquid
By Application
  • Hand wash
  • Body wash
By Distribution Channel
  • Supermarket and Hypermarket
  • Pharmacy stores
  • Online Sales
  • Other channels
By Region
  • North America  (U.S., Canada, Mexico)
  • Europe  (U.K., Germany, France, Italy, Spain, Russia, Rest of Europe)
  • Asia-Pacific  (China, Japan, India, South Korea, Australia, Rest Of Asia Pacific)
  • LAMEA  (Brazil, Argentina, South Africa, Saudi Arabia, Rest of LAMEA)
Key Market Players Unilever plc, Procter & Gamble Co., Godrej Consumer Products Ltd, amway corporation, Henkel AG & Co KGaA, 3M, ITC Ltd, Vi-Jon, Reckitt Benckiser Group, gojo industries
 
  • CHAPTER 1:INTRODUCTION

    • 1.1.Report description

    • 1.2.Key market segments

    • 1.3.Key benefits to the stakeholders

    • 1.4.Research Methodology

      • 1.4.1.Secondary research

      • 1.4.2.Primary research

      • 1.4.3.Analyst tools and models

  • CHAPTER 2:EXECUTIVE SUMMARY

    • 2.1.Key findings of the study

    • 2.2.CXO Perspective

  • CHAPTER 3:MARKET OVERVIEW

    • 3.1.Market definition and scope

    • 3.2.Key findings

      • 3.2.1.Top investment pockets

    • 3.3.Porter’s five forces analysis

    • 3.4.Top player positioning

    • 3.5.Market dynamics

      • 3.5.1.Drivers

      • 3.5.2.Restraints

      • 3.5.3.Opportunities

    • 3.6.COVID-19 Impact Analysis on the market

    • 3.7.Value Chain Analysis

  • CHAPTER 4: ANTIBACTERIAL SOAP MARKET, BY FORM

    • 4.1 Overview

      • 4.1.1 Market size and forecast

    • 4.2 Bar

      • 4.2.1 Key market trends, growth factors and opportunities

      • 4.2.2 Market size and forecast, by region

      • 4.2.3 Market analysis by country

    • 4.3 Powder

      • 4.3.1 Key market trends, growth factors and opportunities

      • 4.3.2 Market size and forecast, by region

      • 4.3.3 Market analysis by country

    • 4.4 Liquid

      • 4.4.1 Key market trends, growth factors and opportunities

      • 4.4.2 Market size and forecast, by region

      • 4.4.3 Market analysis by country

  • CHAPTER 5: ANTIBACTERIAL SOAP MARKET, BY APPLICATION

    • 5.1 Overview

      • 5.1.1 Market size and forecast

    • 5.2 Hand wash

      • 5.2.1 Key market trends, growth factors and opportunities

      • 5.2.2 Market size and forecast, by region

      • 5.2.3 Market analysis by country

    • 5.3 Body wash

      • 5.3.1 Key market trends, growth factors and opportunities

      • 5.3.2 Market size and forecast, by region

      • 5.3.3 Market analysis by country

  • CHAPTER 6: ANTIBACTERIAL SOAP MARKET, BY DISTRIBUTION CHANNEL

    • 6.1 Overview

      • 6.1.1 Market size and forecast

    • 6.2 Supermarket and Hypermarket

      • 6.2.1 Key market trends, growth factors and opportunities

      • 6.2.2 Market size and forecast, by region

      • 6.2.3 Market analysis by country

    • 6.3 Pharmacy stores

      • 6.3.1 Key market trends, growth factors and opportunities

      • 6.3.2 Market size and forecast, by region

      • 6.3.3 Market analysis by country

    • 6.4 Online Sales

      • 6.4.1 Key market trends, growth factors and opportunities

      • 6.4.2 Market size and forecast, by region

      • 6.4.3 Market analysis by country

    • 6.5 Other channels

      • 6.5.1 Key market trends, growth factors and opportunities

      • 6.5.2 Market size and forecast, by region

      • 6.5.3 Market analysis by country

  • CHAPTER 7: ANTIBACTERIAL SOAP MARKET, BY REGION

    • 7.1 Overview

      • 7.1.1 Market size and forecast

    • 7.2 North America

      • 7.2.1 Key trends and opportunities

      • 7.2.2 North America Market size and forecast, by Form

      • 7.2.3 North America Market size and forecast, by Application

      • 7.2.4 North America Market size and forecast, by Distribution Channel

      • 7.2.5 North America Market size and forecast, by country

        • 7.2.5.1 U.S.
          • 7.2.5.1.1 Market size and forecast, by Form
          • 7.2.5.1.2 Market size and forecast, by Application
          • 7.2.5.1.3 Market size and forecast, by Distribution Channel
        • 7.2.5.2 Canada
          • 7.2.5.2.1 Market size and forecast, by Form
          • 7.2.5.2.2 Market size and forecast, by Application
          • 7.2.5.2.3 Market size and forecast, by Distribution Channel
        • 7.2.5.3 Mexico
          • 7.2.5.3.1 Market size and forecast, by Form
          • 7.2.5.3.2 Market size and forecast, by Application
          • 7.2.5.3.3 Market size and forecast, by Distribution Channel
    • 7.3 Europe

      • 7.3.1 Key trends and opportunities

      • 7.3.2 Europe Market size and forecast, by Form

      • 7.3.3 Europe Market size and forecast, by Application

      • 7.3.4 Europe Market size and forecast, by Distribution Channel

      • 7.3.5 Europe Market size and forecast, by country

        • 7.3.5.1 U.K.
          • 7.3.5.1.1 Market size and forecast, by Form
          • 7.3.5.1.2 Market size and forecast, by Application
          • 7.3.5.1.3 Market size and forecast, by Distribution Channel
        • 7.3.5.2 Germany
          • 7.3.5.2.1 Market size and forecast, by Form
          • 7.3.5.2.2 Market size and forecast, by Application
          • 7.3.5.2.3 Market size and forecast, by Distribution Channel
        • 7.3.5.3 France
          • 7.3.5.3.1 Market size and forecast, by Form
          • 7.3.5.3.2 Market size and forecast, by Application
          • 7.3.5.3.3 Market size and forecast, by Distribution Channel
        • 7.3.5.4 Italy
          • 7.3.5.4.1 Market size and forecast, by Form
          • 7.3.5.4.2 Market size and forecast, by Application
          • 7.3.5.4.3 Market size and forecast, by Distribution Channel
        • 7.3.5.5 Spain
          • 7.3.5.5.1 Market size and forecast, by Form
          • 7.3.5.5.2 Market size and forecast, by Application
          • 7.3.5.5.3 Market size and forecast, by Distribution Channel
        • 7.3.5.6 Russia
          • 7.3.5.6.1 Market size and forecast, by Form
          • 7.3.5.6.2 Market size and forecast, by Application
          • 7.3.5.6.3 Market size and forecast, by Distribution Channel
        • 7.3.5.7 Rest of Europe
          • 7.3.5.7.1 Market size and forecast, by Form
          • 7.3.5.7.2 Market size and forecast, by Application
          • 7.3.5.7.3 Market size and forecast, by Distribution Channel
    • 7.4 Asia-Pacific

      • 7.4.1 Key trends and opportunities

      • 7.4.2 Asia-Pacific Market size and forecast, by Form

      • 7.4.3 Asia-Pacific Market size and forecast, by Application

      • 7.4.4 Asia-Pacific Market size and forecast, by Distribution Channel

      • 7.4.5 Asia-Pacific Market size and forecast, by country

        • 7.4.5.1 China
          • 7.4.5.1.1 Market size and forecast, by Form
          • 7.4.5.1.2 Market size and forecast, by Application
          • 7.4.5.1.3 Market size and forecast, by Distribution Channel
        • 7.4.5.2 Japan
          • 7.4.5.2.1 Market size and forecast, by Form
          • 7.4.5.2.2 Market size and forecast, by Application
          • 7.4.5.2.3 Market size and forecast, by Distribution Channel
        • 7.4.5.3 India
          • 7.4.5.3.1 Market size and forecast, by Form
          • 7.4.5.3.2 Market size and forecast, by Application
          • 7.4.5.3.3 Market size and forecast, by Distribution Channel
        • 7.4.5.4 South Korea
          • 7.4.5.4.1 Market size and forecast, by Form
          • 7.4.5.4.2 Market size and forecast, by Application
          • 7.4.5.4.3 Market size and forecast, by Distribution Channel
        • 7.4.5.5 Australia
          • 7.4.5.5.1 Market size and forecast, by Form
          • 7.4.5.5.2 Market size and forecast, by Application
          • 7.4.5.5.3 Market size and forecast, by Distribution Channel
        • 7.4.5.6 Rest Of Asia Pacific
          • 7.4.5.6.1 Market size and forecast, by Form
          • 7.4.5.6.2 Market size and forecast, by Application
          • 7.4.5.6.3 Market size and forecast, by Distribution Channel
    • 7.5 LAMEA

      • 7.5.1 Key trends and opportunities

      • 7.5.2 LAMEA Market size and forecast, by Form

      • 7.5.3 LAMEA Market size and forecast, by Application

      • 7.5.4 LAMEA Market size and forecast, by Distribution Channel

      • 7.5.5 LAMEA Market size and forecast, by country

        • 7.5.5.1 Brazil
          • 7.5.5.1.1 Market size and forecast, by Form
          • 7.5.5.1.2 Market size and forecast, by Application
          • 7.5.5.1.3 Market size and forecast, by Distribution Channel
        • 7.5.5.2 Argentina
          • 7.5.5.2.1 Market size and forecast, by Form
          • 7.5.5.2.2 Market size and forecast, by Application
          • 7.5.5.2.3 Market size and forecast, by Distribution Channel
        • 7.5.5.3 South Africa
          • 7.5.5.3.1 Market size and forecast, by Form
          • 7.5.5.3.2 Market size and forecast, by Application
          • 7.5.5.3.3 Market size and forecast, by Distribution Channel
        • 7.5.5.4 Saudi Arabia
          • 7.5.5.4.1 Market size and forecast, by Form
          • 7.5.5.4.2 Market size and forecast, by Application
          • 7.5.5.4.3 Market size and forecast, by Distribution Channel
        • 7.5.5.5 Rest of LAMEA
          • 7.5.5.5.1 Market size and forecast, by Form
          • 7.5.5.5.2 Market size and forecast, by Application
          • 7.5.5.5.3 Market size and forecast, by Distribution Channel
  • CHAPTER 8: COMPANY LANDSCAPE

    • 8.1. Introduction

    • 8.2. Top winning strategies

    • 8.3. Product Mapping of Top 10 Player

    • 8.4. Competitive Dashboard

    • 8.5. Competitive Heatmap

    • 8.6. Key developments

  • CHAPTER 9: COMPANY PROFILES

    • 9.1 Reckitt Benckiser Group

      • 9.1.1 Company overview

      • 9.1.2 Company snapshot

      • 9.1.3 Operating business segments

      • 9.1.4 Product portfolio

      • 9.1.5 Business performance

      • 9.1.6 Key strategic moves and developments

    • 9.2 3M

      • 9.2.1 Company overview

      • 9.2.2 Company snapshot

      • 9.2.3 Operating business segments

      • 9.2.4 Product portfolio

      • 9.2.5 Business performance

      • 9.2.6 Key strategic moves and developments

    • 9.3 amway corporation

      • 9.3.1 Company overview

      • 9.3.2 Company snapshot

      • 9.3.3 Operating business segments

      • 9.3.4 Product portfolio

      • 9.3.5 Business performance

      • 9.3.6 Key strategic moves and developments

    • 9.4 Godrej Consumer Products Ltd

      • 9.4.1 Company overview

      • 9.4.2 Company snapshot

      • 9.4.3 Operating business segments

      • 9.4.4 Product portfolio

      • 9.4.5 Business performance

      • 9.4.6 Key strategic moves and developments

    • 9.5 Unilever plc

      • 9.5.1 Company overview

      • 9.5.2 Company snapshot

      • 9.5.3 Operating business segments

      • 9.5.4 Product portfolio

      • 9.5.5 Business performance

      • 9.5.6 Key strategic moves and developments

    • 9.6 gojo industries

      • 9.6.1 Company overview

      • 9.6.2 Company snapshot

      • 9.6.3 Operating business segments

      • 9.6.4 Product portfolio

      • 9.6.5 Business performance

      • 9.6.6 Key strategic moves and developments

    • 9.7 Henkel AG & Co KGaA

      • 9.7.1 Company overview

      • 9.7.2 Company snapshot

      • 9.7.3 Operating business segments

      • 9.7.4 Product portfolio

      • 9.7.5 Business performance

      • 9.7.6 Key strategic moves and developments

    • 9.8 ITC Ltd

      • 9.8.1 Company overview

      • 9.8.2 Company snapshot

      • 9.8.3 Operating business segments

      • 9.8.4 Product portfolio

      • 9.8.5 Business performance

      • 9.8.6 Key strategic moves and developments

    • 9.9 Procter & Gamble Co.

      • 9.9.1 Company overview

      • 9.9.2 Company snapshot

      • 9.9.3 Operating business segments

      • 9.9.4 Product portfolio

      • 9.9.5 Business performance

      • 9.9.6 Key strategic moves and developments

    • 9.10 Vi-Jon

      • 9.10.1 Company overview

      • 9.10.2 Company snapshot

      • 9.10.3 Operating business segments

      • 9.10.4 Product portfolio

      • 9.10.5 Business performance

      • 9.10.6 Key strategic moves and developments

  • LIST OF TABLES

  • TABLE 1. GLOBAL ANTIBACTERIAL SOAP MARKET, BY FORM, 2020-2030,($MILLION)
    TABLE 2. ANTIBACTERIAL SOAP MARKET REVENUE, FOR BAR, BY REGION , 2020-2030,($MILLION)
    TABLE 3. ANTIBACTERIAL SOAP MARKET BAR BY COUNTRY, 2020-2030,($MILLION)
    TABLE 4. ANTIBACTERIAL SOAP MARKET REVENUE, FOR POWDER, BY REGION , 2020-2030,($MILLION)
    TABLE 5. ANTIBACTERIAL SOAP MARKET POWDER BY COUNTRY, 2020-2030,($MILLION)
    TABLE 6. ANTIBACTERIAL SOAP MARKET REVENUE, FOR LIQUID, BY REGION , 2020-2030,($MILLION)
    TABLE 7. ANTIBACTERIAL SOAP MARKET LIQUID BY COUNTRY, 2020-2030,($MILLION)
    TABLE 8. GLOBAL ANTIBACTERIAL SOAP MARKET, BY APPLICATION, 2020-2030,($MILLION)
    TABLE 9. ANTIBACTERIAL SOAP MARKET REVENUE, FOR HAND WASH, BY REGION , 2020-2030,($MILLION)
    TABLE 10. ANTIBACTERIAL SOAP MARKET HAND WASH BY COUNTRY, 2020-2030,($MILLION)
    TABLE 11. ANTIBACTERIAL SOAP MARKET REVENUE, FOR BODY WASH, BY REGION , 2020-2030,($MILLION)
    TABLE 12. ANTIBACTERIAL SOAP MARKET BODY WASH BY COUNTRY, 2020-2030,($MILLION)
    TABLE 13. GLOBAL ANTIBACTERIAL SOAP MARKET, BY DISTRIBUTION CHANNEL, 2020-2030,($MILLION)
    TABLE 14. ANTIBACTERIAL SOAP MARKET REVENUE, FOR SUPERMARKET AND HYPERMARKET, BY REGION , 2020-2030,($MILLION)
    TABLE 15. ANTIBACTERIAL SOAP MARKET SUPERMARKET AND HYPERMARKET BY COUNTRY, 2020-2030,($MILLION)
    TABLE 16. ANTIBACTERIAL SOAP MARKET REVENUE, FOR PHARMACY STORES, BY REGION , 2020-2030,($MILLION)
    TABLE 17. ANTIBACTERIAL SOAP MARKET PHARMACY STORES BY COUNTRY, 2020-2030,($MILLION)
    TABLE 18. ANTIBACTERIAL SOAP MARKET REVENUE, FOR ONLINE SALES, BY REGION , 2020-2030,($MILLION)
    TABLE 19. ANTIBACTERIAL SOAP MARKET ONLINE SALES BY COUNTRY, 2020-2030,($MILLION)
    TABLE 20. ANTIBACTERIAL SOAP MARKET REVENUE, FOR OTHER CHANNELS, BY REGION , 2020-2030,($MILLION)
    TABLE 21. ANTIBACTERIAL SOAP MARKET OTHER CHANNELS BY COUNTRY, 2020-2030,($MILLION)
    TABLE 22. ANTIBACTERIAL SOAP MARKET, BY REGION, 2020-2030,($MILLION)
    TABLE 23. NORTH AMERICA ANTIBACTERIAL SOAP MARKET, BY FORM, 2020-2030,($MILLION)
    TABLE 24. NORTH AMERICA ANTIBACTERIAL SOAP MARKET, BY APPLICATION, 2020-2030,($MILLION)
    TABLE 25. NORTH AMERICA ANTIBACTERIAL SOAP MARKET, BY DISTRIBUTION CHANNEL, 2020-2030,($MILLION)
    TABLE 26. NORTH AMERICA ANTIBACTERIAL SOAP MARKET, BY COUNTRY, 2020-2030,($MILLION)
    TABLE 27. U.S. ANTIBACTERIAL SOAP MARKET BY FORM 2020-2030,($MILLION)
    TABLE 28. U.S. ANTIBACTERIAL SOAP MARKET BY APPLICATION 2020-2030,($MILLION)
    TABLE 29. U.S. ANTIBACTERIAL SOAP MARKET BY DISTRIBUTION CHANNEL 2020-2030,($MILLION)
    TABLE 30. CANADA ANTIBACTERIAL SOAP MARKET BY FORM 2020-2030,($MILLION)
    TABLE 31. CANADA ANTIBACTERIAL SOAP MARKET BY APPLICATION 2020-2030,($MILLION)
    TABLE 32. CANADA ANTIBACTERIAL SOAP MARKET BY DISTRIBUTION CHANNEL 2020-2030,($MILLION)
    TABLE 33. MEXICO ANTIBACTERIAL SOAP MARKET BY FORM 2020-2030,($MILLION)
    TABLE 34. MEXICO ANTIBACTERIAL SOAP MARKET BY APPLICATION 2020-2030,($MILLION)
    TABLE 35. MEXICO ANTIBACTERIAL SOAP MARKET BY DISTRIBUTION CHANNEL 2020-2030,($MILLION)
    TABLE 36. EUROPE ANTIBACTERIAL SOAP MARKET, BY FORM, 2020-2030,($MILLION)
    TABLE 37. EUROPE ANTIBACTERIAL SOAP MARKET, BY APPLICATION, 2020-2030,($MILLION)
    TABLE 38. EUROPE ANTIBACTERIAL SOAP MARKET, BY DISTRIBUTION CHANNEL, 2020-2030,($MILLION)
    TABLE 39. EUROPE ANTIBACTERIAL SOAP MARKET, BY COUNTRY, 2020-2030,($MILLION)
    TABLE 40. U.K. ANTIBACTERIAL SOAP MARKET BY FORM 2020-2030,($MILLION)
    TABLE 41. U.K. ANTIBACTERIAL SOAP MARKET BY APPLICATION 2020-2030,($MILLION)
    TABLE 42. U.K. ANTIBACTERIAL SOAP MARKET BY DISTRIBUTION CHANNEL 2020-2030,($MILLION)
    TABLE 43. GERMANY ANTIBACTERIAL SOAP MARKET BY FORM 2020-2030,($MILLION)
    TABLE 44. GERMANY ANTIBACTERIAL SOAP MARKET BY APPLICATION 2020-2030,($MILLION)
    TABLE 45. GERMANY ANTIBACTERIAL SOAP MARKET BY DISTRIBUTION CHANNEL 2020-2030,($MILLION)
    TABLE 46. FRANCE ANTIBACTERIAL SOAP MARKET BY FORM 2020-2030,($MILLION)
    TABLE 47. FRANCE ANTIBACTERIAL SOAP MARKET BY APPLICATION 2020-2030,($MILLION)
    TABLE 48. FRANCE ANTIBACTERIAL SOAP MARKET BY DISTRIBUTION CHANNEL 2020-2030,($MILLION)
    TABLE 49. ITALY ANTIBACTERIAL SOAP MARKET BY FORM 2020-2030,($MILLION)
    TABLE 50. ITALY ANTIBACTERIAL SOAP MARKET BY APPLICATION 2020-2030,($MILLION)
    TABLE 51. ITALY ANTIBACTERIAL SOAP MARKET BY DISTRIBUTION CHANNEL 2020-2030,($MILLION)
    TABLE 52. SPAIN ANTIBACTERIAL SOAP MARKET BY FORM 2020-2030,($MILLION)
    TABLE 53. SPAIN ANTIBACTERIAL SOAP MARKET BY APPLICATION 2020-2030,($MILLION)
    TABLE 54. SPAIN ANTIBACTERIAL SOAP MARKET BY DISTRIBUTION CHANNEL 2020-2030,($MILLION)
    TABLE 55. RUSSIA ANTIBACTERIAL SOAP MARKET BY FORM 2020-2030,($MILLION)
    TABLE 56. RUSSIA ANTIBACTERIAL SOAP MARKET BY APPLICATION 2020-2030,($MILLION)
    TABLE 57. RUSSIA ANTIBACTERIAL SOAP MARKET BY DISTRIBUTION CHANNEL 2020-2030,($MILLION)
    TABLE 58. REST OF EUROPE ANTIBACTERIAL SOAP MARKET BY FORM 2020-2030,($MILLION)
    TABLE 59. REST OF EUROPE ANTIBACTERIAL SOAP MARKET BY APPLICATION 2020-2030,($MILLION)
    TABLE 60. REST OF EUROPE ANTIBACTERIAL SOAP MARKET BY DISTRIBUTION CHANNEL 2020-2030,($MILLION)
    TABLE 61. ASIA-PACIFIC ANTIBACTERIAL SOAP MARKET, BY FORM, 2020-2030,($MILLION)
    TABLE 62. ASIA-PACIFIC ANTIBACTERIAL SOAP MARKET, BY APPLICATION, 2020-2030,($MILLION)
    TABLE 63. ASIA-PACIFIC ANTIBACTERIAL SOAP MARKET, BY DISTRIBUTION CHANNEL, 2020-2030,($MILLION)
    TABLE 64. ASIA-PACIFIC ANTIBACTERIAL SOAP MARKET, BY COUNTRY, 2020-2030,($MILLION)
    TABLE 65. CHINA ANTIBACTERIAL SOAP MARKET BY FORM 2020-2030,($MILLION)
    TABLE 66. CHINA ANTIBACTERIAL SOAP MARKET BY APPLICATION 2020-2030,($MILLION)
    TABLE 67. CHINA ANTIBACTERIAL SOAP MARKET BY DISTRIBUTION CHANNEL 2020-2030,($MILLION)
    TABLE 68. JAPAN ANTIBACTERIAL SOAP MARKET BY FORM 2020-2030,($MILLION)
    TABLE 69. JAPAN ANTIBACTERIAL SOAP MARKET BY APPLICATION 2020-2030,($MILLION)
    TABLE 70. JAPAN ANTIBACTERIAL SOAP MARKET BY DISTRIBUTION CHANNEL 2020-2030,($MILLION)
    TABLE 71. INDIA ANTIBACTERIAL SOAP MARKET BY FORM 2020-2030,($MILLION)
    TABLE 72. INDIA ANTIBACTERIAL SOAP MARKET BY APPLICATION 2020-2030,($MILLION)
    TABLE 73. INDIA ANTIBACTERIAL SOAP MARKET BY DISTRIBUTION CHANNEL 2020-2030,($MILLION)
    TABLE 74. SOUTH KOREA ANTIBACTERIAL SOAP MARKET BY FORM 2020-2030,($MILLION)
    TABLE 75. SOUTH KOREA ANTIBACTERIAL SOAP MARKET BY APPLICATION 2020-2030,($MILLION)
    TABLE 76. SOUTH KOREA ANTIBACTERIAL SOAP MARKET BY DISTRIBUTION CHANNEL 2020-2030,($MILLION)
    TABLE 77. AUSTRALIA ANTIBACTERIAL SOAP MARKET BY FORM 2020-2030,($MILLION)
    TABLE 78. AUSTRALIA ANTIBACTERIAL SOAP MARKET BY APPLICATION 2020-2030,($MILLION)
    TABLE 79. AUSTRALIA ANTIBACTERIAL SOAP MARKET BY DISTRIBUTION CHANNEL 2020-2030,($MILLION)
    TABLE 80. REST OF ASIA PACIFIC ANTIBACTERIAL SOAP MARKET BY FORM 2020-2030,($MILLION)
    TABLE 81. REST OF ASIA PACIFIC ANTIBACTERIAL SOAP MARKET BY APPLICATION 2020-2030,($MILLION)
    TABLE 82. REST OF ASIA PACIFIC ANTIBACTERIAL SOAP MARKET BY DISTRIBUTION CHANNEL 2020-2030,($MILLION)
    TABLE 83. LAMEA ANTIBACTERIAL SOAP MARKET, BY FORM, 2020-2030,($MILLION)
    TABLE 84. LAMEA ANTIBACTERIAL SOAP MARKET, BY APPLICATION, 2020-2030,($MILLION)
    TABLE 85. LAMEA ANTIBACTERIAL SOAP MARKET, BY DISTRIBUTION CHANNEL, 2020-2030,($MILLION)
    TABLE 86. LAMEA ANTIBACTERIAL SOAP MARKET, BY COUNTRY, 2020-2030,($MILLION)
    TABLE 87. BRAZIL ANTIBACTERIAL SOAP MARKET BY FORM 2020-2030,($MILLION)
    TABLE 88. BRAZIL ANTIBACTERIAL SOAP MARKET BY APPLICATION 2020-2030,($MILLION)
    TABLE 89. BRAZIL ANTIBACTERIAL SOAP MARKET BY DISTRIBUTION CHANNEL 2020-2030,($MILLION)
    TABLE 90. ARGENTINA ANTIBACTERIAL SOAP MARKET BY FORM 2020-2030,($MILLION)
    TABLE 91. ARGENTINA ANTIBACTERIAL SOAP MARKET BY APPLICATION 2020-2030,($MILLION)
    TABLE 92. ARGENTINA ANTIBACTERIAL SOAP MARKET BY DISTRIBUTION CHANNEL 2020-2030,($MILLION)
    TABLE 93. SOUTH AFRICA ANTIBACTERIAL SOAP MARKET BY FORM 2020-2030,($MILLION)
    TABLE 94. SOUTH AFRICA ANTIBACTERIAL SOAP MARKET BY APPLICATION 2020-2030,($MILLION)
    TABLE 95. SOUTH AFRICA ANTIBACTERIAL SOAP MARKET BY DISTRIBUTION CHANNEL 2020-2030,($MILLION)
    TABLE 96. SAUDI ARABIA ANTIBACTERIAL SOAP MARKET BY FORM 2020-2030,($MILLION)
    TABLE 97. SAUDI ARABIA ANTIBACTERIAL SOAP MARKET BY APPLICATION 2020-2030,($MILLION)
    TABLE 98. SAUDI ARABIA ANTIBACTERIAL SOAP MARKET BY DISTRIBUTION CHANNEL 2020-2030,($MILLION)
    TABLE 99. REST OF LAMEA ANTIBACTERIAL SOAP MARKET BY FORM 2020-2030,($MILLION)
    TABLE 100. REST OF LAMEA ANTIBACTERIAL SOAP MARKET BY APPLICATION 2020-2030,($MILLION)
    TABLE 101. REST OF LAMEA ANTIBACTERIAL SOAP MARKET BY DISTRIBUTION CHANNEL 2020-2030,($MILLION)
    TABLE 102.RECKITT BENCKISER GROUP: COMPANY SNAPSHOT
    TABLE 103.RECKITT BENCKISER GROUP: OPERATING SEGMENTS
    TABLE 104.RECKITT BENCKISER GROUP: PRODUCT PORTFOLIO
    TABLE 105.RECKITT BENCKISER GROUP: NET SALES,
    TABLE 106.RECKITT BENCKISER GROUP: KEY STRATERGIES
    TABLE 107.3M: COMPANY SNAPSHOT
    TABLE 108.3M: OPERATING SEGMENTS
    TABLE 109.3M: PRODUCT PORTFOLIO
    TABLE 110.3M: NET SALES,
    TABLE 111.3M: KEY STRATERGIES
    TABLE 112.AMWAY CORPORATION: COMPANY SNAPSHOT
    TABLE 113.AMWAY CORPORATION: OPERATING SEGMENTS
    TABLE 114.AMWAY CORPORATION: PRODUCT PORTFOLIO
    TABLE 115.AMWAY CORPORATION: NET SALES,
    TABLE 116.AMWAY CORPORATION: KEY STRATERGIES
    TABLE 117.GODREJ CONSUMER PRODUCTS LTD: COMPANY SNAPSHOT
    TABLE 118.GODREJ CONSUMER PRODUCTS LTD: OPERATING SEGMENTS
    TABLE 119.GODREJ CONSUMER PRODUCTS LTD: PRODUCT PORTFOLIO
    TABLE 120.GODREJ CONSUMER PRODUCTS LTD: NET SALES,
    TABLE 121.GODREJ CONSUMER PRODUCTS LTD: KEY STRATERGIES
    TABLE 122.UNILEVER PLC: COMPANY SNAPSHOT
    TABLE 123.UNILEVER PLC: OPERATING SEGMENTS
    TABLE 124.UNILEVER PLC: PRODUCT PORTFOLIO
    TABLE 125.UNILEVER PLC: NET SALES,
    TABLE 126.UNILEVER PLC: KEY STRATERGIES
    TABLE 127.GOJO INDUSTRIES: COMPANY SNAPSHOT
    TABLE 128.GOJO INDUSTRIES: OPERATING SEGMENTS
    TABLE 129.GOJO INDUSTRIES: PRODUCT PORTFOLIO
    TABLE 130.GOJO INDUSTRIES: NET SALES,
    TABLE 131.GOJO INDUSTRIES: KEY STRATERGIES
    TABLE 132.HENKEL AG & CO KGAA: COMPANY SNAPSHOT
    TABLE 133.HENKEL AG & CO KGAA: OPERATING SEGMENTS
    TABLE 134.HENKEL AG & CO KGAA: PRODUCT PORTFOLIO
    TABLE 135.HENKEL AG & CO KGAA: NET SALES,
    TABLE 136.HENKEL AG & CO KGAA: KEY STRATERGIES
    TABLE 137.ITC LTD: COMPANY SNAPSHOT
    TABLE 138.ITC LTD: OPERATING SEGMENTS
    TABLE 139.ITC LTD: PRODUCT PORTFOLIO
    TABLE 140.ITC LTD: NET SALES,
    TABLE 141.ITC LTD: KEY STRATERGIES
    TABLE 142.PROCTER & GAMBLE CO.: COMPANY SNAPSHOT
    TABLE 143.PROCTER & GAMBLE CO.: OPERATING SEGMENTS
    TABLE 144.PROCTER & GAMBLE CO.: PRODUCT PORTFOLIO
    TABLE 145.PROCTER & GAMBLE CO.: NET SALES,
    TABLE 146.PROCTER & GAMBLE CO.: KEY STRATERGIES
    TABLE 147.VI-JON: COMPANY SNAPSHOT
    TABLE 148.VI-JON: OPERATING SEGMENTS
    TABLE 149.VI-JON: PRODUCT PORTFOLIO
    TABLE 150.VI-JON: NET SALES,
    TABLE 151.VI-JON: KEY STRATERGIES
  • LIST OF FIGURES

  • FIGURE 1.ANTIBACTERIAL SOAP MARKET SEGMENTATION
    FIGURE 2.ANTIBACTERIAL SOAP MARKET,2020-2030
    FIGURE 3.ANTIBACTERIAL SOAP MARKET,2020-2030
    FIGURE 4. TOP INVESTMENT POCKETS, BY REGION
    FIGURE 5.PORTER FIVE-1
    FIGURE 6.PORTER FIVE-2
    FIGURE 7.PORTER FIVE-3
    FIGURE 8.PORTER FIVE-4
    FIGURE 9.PORTER FIVE-5
    FIGURE 10.TOP PLAYER POSITIONING
    FIGURE 11.ANTIBACTERIAL SOAP MARKET:DRIVERS, RESTRAINTS AND OPPORTUNITIES
    FIGURE 12.VALUE CHAIN ANALYSIS
    FIGURE 12.ANTIBACTERIAL SOAP MARKET,BY FORM,2020(%)
    FIGURE 13.COMPARATIVE SHARE ANALYSIS OF BAR ANTIBACTERIAL SOAP MARKET,2020-2030(%)
    FIGURE 14.COMPARATIVE SHARE ANALYSIS OF POWDER ANTIBACTERIAL SOAP MARKET,2020-2030(%)
    FIGURE 15.COMPARATIVE SHARE ANALYSIS OF LIQUID ANTIBACTERIAL SOAP MARKET,2020-2030(%)
    FIGURE 16.ANTIBACTERIAL SOAP MARKET,BY APPLICATION,2020(%)
    FIGURE 17.COMPARATIVE SHARE ANALYSIS OF HAND WASH ANTIBACTERIAL SOAP MARKET,2020-2030(%)
    FIGURE 18.COMPARATIVE SHARE ANALYSIS OF BODY WASH ANTIBACTERIAL SOAP MARKET,2020-2030(%)
    FIGURE 19.ANTIBACTERIAL SOAP MARKET,BY DISTRIBUTION CHANNEL,2020(%)
    FIGURE 20.COMPARATIVE SHARE ANALYSIS OF SUPERMARKET AND HYPERMARKET ANTIBACTERIAL SOAP MARKET,2020-2030(%)
    FIGURE 21.COMPARATIVE SHARE ANALYSIS OF PHARMACY STORES ANTIBACTERIAL SOAP MARKET,2020-2030(%)
    FIGURE 22.COMPARATIVE SHARE ANALYSIS OF ONLINE SALES ANTIBACTERIAL SOAP MARKET,2020-2030(%)
    FIGURE 23.COMPARATIVE SHARE ANALYSIS OF OTHER CHANNELS ANTIBACTERIAL SOAP MARKET,2020-2030(%)
    FIGURE 24.ANTIBACTERIAL SOAP MARKET BY REGION,2020
    FIGURE 25.U.S. ANTIBACTERIAL SOAP MARKET,2020-2030($MILLION)
    FIGURE 26.CANADA ANTIBACTERIAL SOAP MARKET,2020-2030($MILLION)
    FIGURE 27.MEXICO ANTIBACTERIAL SOAP MARKET,2020-2030($MILLION)
    FIGURE 28.U.K. ANTIBACTERIAL SOAP MARKET,2020-2030($MILLION)
    FIGURE 29.GERMANY ANTIBACTERIAL SOAP MARKET,2020-2030($MILLION)
    FIGURE 30.FRANCE ANTIBACTERIAL SOAP MARKET,2020-2030($MILLION)
    FIGURE 31.ITALY ANTIBACTERIAL SOAP MARKET,2020-2030($MILLION)
    FIGURE 32.SPAIN ANTIBACTERIAL SOAP MARKET,2020-2030($MILLION)
    FIGURE 33.RUSSIA ANTIBACTERIAL SOAP MARKET,2020-2030($MILLION)
    FIGURE 34.REST OF EUROPE ANTIBACTERIAL SOAP MARKET,2020-2030($MILLION)
    FIGURE 35.CHINA ANTIBACTERIAL SOAP MARKET,2020-2030($MILLION)
    FIGURE 36.JAPAN ANTIBACTERIAL SOAP MARKET,2020-2030($MILLION)
    FIGURE 37.INDIA ANTIBACTERIAL SOAP MARKET,2020-2030($MILLION)
    FIGURE 38.SOUTH KOREA ANTIBACTERIAL SOAP MARKET,2020-2030($MILLION)
    FIGURE 39.AUSTRALIA ANTIBACTERIAL SOAP MARKET,2020-2030($MILLION)
    FIGURE 40.REST OF ASIA PACIFIC ANTIBACTERIAL SOAP MARKET,2020-2030($MILLION)
    FIGURE 41.BRAZIL ANTIBACTERIAL SOAP MARKET,2020-2030($MILLION)
    FIGURE 42.ARGENTINA ANTIBACTERIAL SOAP MARKET,2020-2030($MILLION)
    FIGURE 43.SOUTH AFRICA ANTIBACTERIAL SOAP MARKET,2020-2030($MILLION)
    FIGURE 44.SAUDI ARABIA ANTIBACTERIAL SOAP MARKET,2020-2030($MILLION)
    FIGURE 45.REST OF LAMEA ANTIBACTERIAL SOAP MARKET,2020-2030($MILLION)
    FIGURE 46. TOP WINNING STRATEGIES, BY YEAR
    FIGURE 47. TOP WINNING STRATEGIES, BY DEVELOPMENT
    FIGURE 48. TOP WINNING STRATEGIES, BY COMPANY
    FIGURE 49.PRODUCT MAPPING OF TOP 10 PLAYERS
    FIGURE 50.COMPETITIVE DASHBOARD
    FIGURE 51.COMPETITIVE HEATMAP OF TOP 10 KEY PLAYERS
    FIGURE 52.RECKITT BENCKISER GROUP.: NET SALES ,($MILLION)
    FIGURE 53.3M.: NET SALES ,($MILLION)
    FIGURE 54.AMWAY CORPORATION.: NET SALES ,($MILLION)
    FIGURE 55.GODREJ CONSUMER PRODUCTS LTD.: NET SALES ,($MILLION)
    FIGURE 56.UNILEVER PLC.: NET SALES ,($MILLION)
    FIGURE 57.GOJO INDUSTRIES.: NET SALES ,($MILLION)
    FIGURE 58.HENKEL AG & CO KGAA.: NET SALES ,($MILLION)
    FIGURE 59.ITC LTD.: NET SALES ,($MILLION)
    FIGURE 60.PROCTER & GAMBLE CO..: NET SALES ,($MILLION)
    FIGURE 61.VI-JON.: NET SALES ,($MILLION)


Based on the insights of the top CXOs, the factor that drives the growth of the market includes different campaigns initiated by top manufacturers and brands to promote various social issues, including health & hygiene awareness, education, and sustainability. Reckitt-Benckiser, in March 2019,  launched a campaign named Surakshit Parivar in South India. The aim of this campaign was to promote and create awareness regarding the benefits of hygiene. Dettol brand of Reckitt-Benckiser developed perception that Dettol means protection from germs. This kind of corporate social responsibility in developing markets is expected to offer lucrative growth opportunities to players. The modern day consumers are highly captivated by the social and environmental concerns, which the market players are leveraging to promote their brands in the markets.

Furthermore, various government initiatives to promote hygiene and cleanliness, including the Swachh Bharat Mission by the Government of India play a crucial role in the growth of the antibacterial soap market. According to the Press Information Bureau, the sanitization coverage in rural India increased from 39% in 2014 to 76% in 2018, after the launch of the Swachh Bharat Mission.

PURCHASE OPTIONS

Call or Email us

U.S.-Canada Toll-free: +1-800-792-5285
Int'l : +1-503-894-6022
Europe : +44-845-528-1300
Email : help@alliedmarketresearch.com
 
FREQUENTLY ASKED QUESTIONS?

A. The global antibacterial soap market size was valued at $3,733.9 million in 2020, and is estimated to reach $6,924.9 million by 2030, registering a CAGR of 6.3% from 2021 to 2030.

A. The forecast period calculated in the global Antibacterial Soap market report is 2021 to 2030. Rising consumer awareness regarding the health benefits of using antibacterial soap and the easy availability of the antibacterial soaps in the market are expected to foster the market growth.

A. The base year calculated in the report is 2020. The year 2020 was an exceptional year characterized by the outbreak of the COVID-19 pandemic. The report provides a detailed analysis regarding the impact of the COVID-19 on the global Antibacterial Soap market.

A. The key players profiled in this report include 3M, Amway Corporation, Godrej Consumer Products Limited, GOJO Industries, Inc., Henkel AG & Co. KGaA, ITC Ltd., Reckitt-Benckiser Group PLC. , The Procter & Gamble Company, Unilever Plc., and Vi-Jon.

A. Depending on form, the liquid segment dominated the global market, accounting for 61.1% of the antibacterial soap market share in 2020. Increase in preferences for the liquid soaps among the consumers, owing to easy usage and convenience associated with liquid soap fuels the growth of the market.

A. North America held the largest market share in 2020. This is attributed to the increased demand for the liquid antibacterial soaps for hand wash and body wash across the region.

A. Players operating in global antibacterial soap industry have adopted various developmental strategies to expand their market share, exploit the antibacterial soap market opportunities, and increase their profitability in the market.

A. The global antibacterial soap market size was valued at $3,733.9 million in 2020, and is estimated to reach $6,924.9 million by 2030, registering a CAGR of 6.3% from 2021 to 2030.

Looking for Customization?

 Customization Request

Have a Question?

 Speak with Analyst

Any Confusion?

 Inquire Before Buying

Have a glance of the Report

  Request Sample
RELATED TAGS

Purchase Full Report of
Antibacterial Soap Market

Start reading instantly.
This Report and over 68,131+ more Reports, Available with Avenue Library. T&C*.

  • Online Only
  • $3,456
  • Online cloud access only
  • Restricted print, copy, paste & download
  • Read only
  • Free industry update
    (Within 180 days)
  • Free report update in next update cycle
    (Apr 2023 - Apr 2024)
  • Data Pack
  • $3,840
  • Restricted to one authorized user
  • One print only
  • Available in
    Excel
  • Free industry update
    (Within 180 days)
  •   Free report update in next update cycle
    (Apr 2023 - Apr 2024)
  • Single User
  • $5,769
  • Restricted to one authorized user
  • One print only
  • Available in
    PDF
  • Free industry update
    (Within 180 days)
  •   Free report update in next update cycle
    (Apr 2023 - Apr 2024)
  • Five Users
  • $6,450
  • Limited to five authorized users
  • Print upto five copies
  • Available in
    PDF
  • Free industry update
    (Within 180 days)
  •   Free report update in next update cycle
    (Apr 2023 - Apr 2024)
  • Enterprise
    License/PDF

  • $10,995
  • Unlimited
    within
    company/enterprise
  • Available in Excel & PDF
  • Free industry update
    (Within 180 days)
  •   Free report update in next update cycle
    (Apr 2023 - Apr 2024)
  • Library
    Membership

  • $999 $ 1,175
    Per User/ Per month/ Billed annually
  • Published Content
    E-access
  • Company Profiles
    E-access
  • Newly Added Content Access
  • 10 PDF
    Downloads
  • 5 Excel Data
    Pack Downloads
  • 250 Company Profiles PDF Downloads
  • Buy Now

*Taxes/Fees, if applicable will be added during checkout. All prices in USD

RELATED REPORTS
 

Why Allied Market Research?


Infallible Methodology

To ensure high-level data integrity, accurate analysis, and impeccable forecasts

Analyst Support

For complete satisfaction

Customization

On-demand customization of scope of the report to exactly meet your needs

TARGETED MARKET VIEW

Targeted market view to provide pertinent information and save time of readers

Get fresh content delivered

Get insights on topics that are crucial for your business. Stay abreast of your interest areas.

Get Industry Data Alerts

Why Allied Market Research?

Infallible Methodology

To ensure high-level data integrity, accurate analysis, and impeccable forecasts

Analyst Support

For complete satisfaction

Customization

On-demand customization of scope of the report to exactly meet your needs

TARGETED MARKET VIEW

Targeted market view to provide pertinent information and save time of readers