
Antibody Production Market Research, 2032
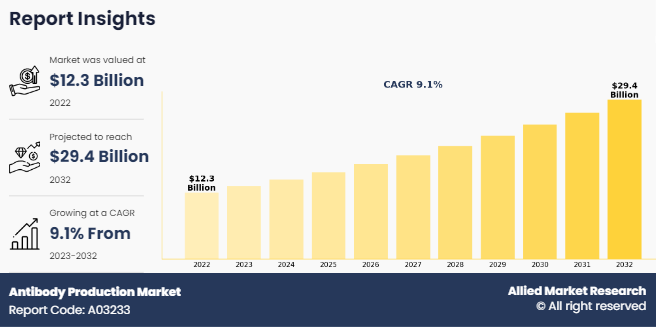
The global antibody production market was valued at $12.3 billion in 2022, and is projected to reach $29.4 billion by 2032, growing at a CAGR of 9.1% from 2023 to 2032.The growth of the antibody production market is driven by an increase in prevalence of chronic diseases and advancements in biotechnology and molecular biology. For instance, according to the American Cancer Society Cancer Statistics 2022, around 1,918,030 new cancer cases were predicted to occur in the U.S. in 2022. Additionally, according to the Canadian Cancer Statistics November 2021 report, an estimated 2 in 5 Canadians were likely to be diagnosed with cancer in their lifetime and 229,200 Canadians were predicted to be diagnosed with cancer in 2021.
Antibody production refers to the process by which antibodies, also known as immunoglobulins, are generated either naturally within living organisms or artificially in laboratory settings. Antibodies are proteins produced by the immune system in response to the presence of foreign substances, such as pathogens or antigens. They play a critical role in the immune response by recognizing and neutralizing harmful agents, marking them for destruction by other immune cells, or triggering other immune mechanisms.
Key Takeaways
- By product, the consumables segment dominated the global market in terms of revenue in 2022. However, the instruments segment is expected to register the highest CAGR during the forecast period.
- By process, the downstream processing segment dominated the global antibody production market size in terms of revenue in 2022 and is expected to register the highest CAGR during the forecast period.
- By end user, the pharmaceutical and biotechnology companies segment dominated the market in terms of revenue in 2022. However, the CROs and CDMOs segment is expected to register the highest CAGR during the forecast period.
- By region, North America dominated the antibody production market share in terms of revenue in 2022. However, Asia-Pacific is expected to register the highest CAGR during the forecast period.
Market Dynamics
Antibody production market trends includes increase in prevalence of chronic diseases, technological advancements in biotechnology, growing demand for personalized medicine, investments in research and development, supportive regulatory environment, and expansion of applications of antibodies are the major factors which contributes towards the market growth. Rise in chronic diseases such as cancer, autoimmune disorders, and infectious diseases due to factors like aging populations, lifestyle changes, and environmental factors drives the demand for antibody production for treatment purpose. Antibodies play a crucial role in the treatment of many chronic diseases, offering targeted therapies with high specificity and efficacy. As the prevalence of these diseases continues to increase, there is a growing demand for antibody-based therapeutics, driving the growth of the market.
In addition, the rise in expenditure on research and development played a pivotal role in driving the growth of the antibody production market growth. Pharmaceutical companies, biotechnology firms, and academic institutions are allocating significant resources to advance antibody development, and manufacturing processes. These investments fuel innovation in biotechnology and molecular biology, leading to the emergence of novel techniques and technologies for generating antibodies. Furthermore, advancements in biotechnology have revolutionized antibody production processes, making them more efficient, scalable, and cost-effective which is expected to drive market growth. Innovations such as recombinant DNA technology, phage display libraries, and high-throughput screening methods have accelerated the development, and optimization of antibodies. These technological advancements have expanded the capabilities of antibody production and enabled the development of novel therapies which drive antibody production market growth.
Moreover, shift towards personalized medicine, which involves tailoring medical treatments to individual patients based on their unique genetic makeup, biomarkers, and disease characteristics further supports the market growth. Antibodies offer highly specific and targeted therapies that can be customized to address the specific needs of individual patients. As personalized medicine becomes increasingly important in healthcare, the demand for antibody production products that support personalized treatment approaches is expected to grow and provide the antibody production market opportunity.
Antibodies are being increasingly explored for their therapeutic potential across a wide range of medical conditions beyond traditional areas. This includes neurological disorders, cardiovascular diseases, and rare genetic disorders, among others. As research uncovers new therapeutic targets and mechanisms of action for antibodies, the potential applications continue to expand, driving demand for antibody production services and products. The development and production of these immunotherapies rely heavily on antibody production technologies, driving market growth.
Further, the contract development and manufacturing organizations (CDMOs) play a vital role in the antibody production market by providing outsourced services for antibody discovery, development, and manufacturing. As biopharmaceutical companies seek to streamline operations, reduce costs, and accelerate timelines, they increasingly rely on CDMOs to support their antibody production projects. The expansion of contract manufacturing services contributes to market growth by offering specialized expertise, infrastructure, and scalability to meet the growing demand for antibody-based therapies.
However, the advanced antibody production technologies are not readily available or accessible in certain developing regions due to lack of infrastructure, lack of resources, and insufficient training facilities. This hinders the widespread adoption of sophisticated methods in such areas that restrain market growth. On the other hand, the rise in technological advancements in diagnostic and rise in demand for point of care testing provide lucrative opportunities to market growth. Furthermore, the surge in research and development activities among pharmaceutical market leaders to develop economical and effective antibodies and biosimilar antibodies is a significant opportunity to the antibodies market. As the demand for antibody-based therapeutics continues to rise, driven by the increasing prevalence of chronic diseases and the need for targeted treatment options, pharmaceutical companies are intensifying their efforts to innovate and expand their product portfolios.
Segments Overview
Antibody production market analysis is segmented into product, process, end user, and region. By product, the market is bifurcated into instruments and consumables. The instruments segment is further categorized into bioreactors, chromatography systems, and filtration systems. By process, the market is categorized into upstream processing and downstream processing. As per end user, it is segregated into pharmaceutical and biotechnology companies, CROs and CDMOs, and others. Region wise, the market is analyzed across North America, Europe, Asia-Pacific, LA, and MEA.
By Product
The consumables segment dominated the global antibody production market size in 2022, owing to rise in adoption of consumables for antibody production and increase in demand for monoclonal antibodies in biopharmaceutical industry. However, the instruments segment is expected to register the highest CAGR during the forecast period, owing to the technological advancements in instrumentation which have led to the development of innovative tools and equipment specifically designed for antibody production processes. These instruments encompass a wide range of technologies, including bioreactors, chromatography systems, filtration units, and automation platforms, which play crucial roles in various stages of antibody development, and manufacturing.

By Process
The downstream processing segment dominated the global antibody production market share in 2022 is expected to register the highest CAGR during the forecast period, owing to as the downstream processing plays a critical role in the purification and isolation of antibodies from complex biological mixtures, such as cell culture supernatants or blood serum, the increase in demand for efficient purification and manufacturing technologies, as well as advancements in downstream processing techniques.

By End User
The pharmaceutical and biotechnology companies segment held the largest market share in 2022, owing to rise in adoption of antibodies and rise in investments in research and development and manufacturing infrastructure for antibody production. However, the CROs and CDMOs segment is expected to register the highest CAGR during the antibody production market forecast period, owing to growing complexity of antibody production processes, coupled with the need for specialized technical skills and equipment, which has led biopharmaceutical companies to rely on CROs and CDMOs for their expertise. These service providers offer a wide range of services, including cell line development, process development, analytical testing, and cGMP manufacturing.

By Region
The antibody production industry is analyzed across North America, Europe, Asia-Pacific, LA, and MEA. North America has accounted for the largest share in the market and is expected to remain dominant during the forecast period. This dominance is attributed to its strong biopharmaceutical industry, rise in research infrastructure, regulatory environment, and business-friendly policies with supportive government policies. As the region continues to lead in innovation and commercialization in the biotechnology sector, it is expected to maintain its dominant position in the market during the forecast period.
However, the Asia-Pacific region is anticipated to register the highest CAGR during the forecast period. This is attributed to increased investments in healthcare infrastructure, research and development, and biotechnology innovation. In addition, the outsourcing trend in the biopharmaceutical industry is driving the growth in the Asia-Pacific region. Biopharmaceutical companies, both domestic and international, are increasingly outsourcing antibody production and manufacturing activities to APAC-based CMOs and CDMOs to leverage cost advantages, regulatory expertise, and manufacturing capabilities. This trend is expected to fuel market growth in the APAC region, particularly in countries with established biopharmaceutical manufacturing hubs.

Competitive Analysis
Key players such as Danaher Corporation have adopted expansion, acquisition, and product launch as key developmental strategies to improve the product portfolio of the antibody production market. For instance, in August 2023, Danaher Corporation, a global science and technology innovator, announced that it has entered into a definitive agreement to acquire Abcam plc, a leading global supplier of protein consumables, pursuant to which Danaher will acquire all of the outstanding shares of Abcam for $24.00 per share in cash, or a total enterprise value of approximately $5.7 billion including assumed indebtedness and net of acquired cash.
Recent Developments in the Antibody Production Industry
- In April 2023, Cytiva, a part of Danaher Corporation, launched X-platform bioreactors to simplify single-use upstream bioprocessing operations. X-platform bioreactors, initially available in 50 and 200 L sizes are provided with Figurate automation solution software and can increase process efficiency through ergonomic improvements, production capability and simplified supply chain operations.
- In July 2021, Cytiva and Pall Corporation, part of the Danaher Corporation, will expand manufacturing capacity and services across geographies for global life sciences customers. Cytiva and Pall Corporation are investing 1.5 billion USD over two years to meet growing demand for biotechnology solutions.
- In March 2020, Danaher Corporation announced the completion of its acquisition of the Biopharma business from General Electric Company's Life Sciences division. As part of Danaher, the business will be called Cytiva and will be a standalone operating company within Danaher's Life Sciences segment.
Key Benefits for Stakeholders
- This report provides a quantitative analysis of the market segments, current trends, estimations, and dynamics of the antibody production market analysis from 2022 to 2032 to identify the prevailing market opportunities.
- The market research is offered along with information related to key drivers, restraints, and opportunities.
- Porter's five forces analysis highlights the potency of buyers and suppliers to enable stakeholders make profit-oriented business decisions and strengthen their supplier-buyer network.
- In-depth analysis of the antibody production market segmentation assists to determine the prevailing market opportunities.
- Major countries in each region are mapped according to their revenue contribution to the global market.
- Market player positioning facilitates benchmarking and provides a clear understanding of the present position of the market players.
- The report includes the analysis of the regional as well as global market trends, key players, market segments, application areas, and market growth strategies.
Antibody Production Market Report Highlights
| Aspects | Details |
| Forecast period | 2022 - 2032 |
| Report Pages | 276 |
| By End User |
|
| By Product |
|
| By Process |
|
| By Region |
|
| Key Market Players | Cell Culture Company, Sartorius AG, Merck KGaA, Danaher Corporation, Cellabcdmo, Genetix Biotech Asia Pvt. Ltd., Bio-Rad Laboratories, Inc. , Thermo Fisher Scientific Inc., Agilent Technologies, Inc., TECNIC |
Analyst Review
This section provides various opinions of global antibody production market. The increasing prevalence of diseases such as cancer, autoimmune disorders, and infectious diseases drives the demand for therapeutic antibodies, stimulating growth in the antibody production market. However, the high cost in development of antibodies restricts market growth. In addition, rise in biopharmaceutical research and development, particularly in monoclonal antibody therapies, fuels demand for antibody production products. Continuous innovations in antibody production technologies, such as cell culture systems, expression systems, and purification techniques, improve efficiency, yield, and scalability, thus fostering market growth.
Furthermore, North America accounted for the largest share in 2022 and is expected to remain dominant during the forecast period. This is attributed to the advanced healthcare infrastructure, a well-established system that supports the widespread adoption of antibodies and highly skilled workforce in biotechnology, immunology, and related fields, which supports the development and production of antibodies. However, Asia-Pacific is anticipated to witness notable growth owing to growing healthcare expenditure and rise in incidence of lifestyle-related diseases in the Asia-Pacific region, such as diabetes and cardiovascular disorders. There is increasing demand for targeted biologic treatments driving the need for antibody production.
The total market value of antibody production market is $12.3 billion in 2022.
The market value of antibody production market in 2032 is $29.4 billion.
The forecast period for antibody production market is 2023 to 2032.
The base year is 2022 in antibody production market.
North America is accounted for the largest market share in 2022 owing to well established healthcare infrastructure, presence of leading academic and research institutions, along with a skilled workforce comprising scientists, researchers, and technicians.
Antibody production refers to the process of generating antibodies, which are specialized proteins produced by the immune system to identify and neutralize harmful substances such as bacteria, viruses, and toxins.
Increasing demand for antibody-based therapeutics, growing prevalence of chronic and infectious diseases, such as cancer, autoimmune disorders, and viral infections, fuels the demand for novel and effective treatments, advancements in biotechnology and pharmaceutical manufacturing processes are the major factors which drives the market growth.
Loading Table Of Content...
Loading Research Methodology...

