
Antimicrobial Plastics Market Research, 2033
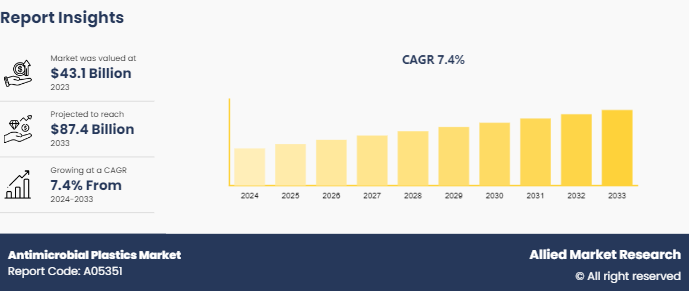
The global antimicrobial plastics market size was valued at $43.1 billion in 2023, and is projected to reach $87.4 billion by 2033, growing at a CAGR of 7.4% from 2024 to 2033.
Market Introduction and Definition
Antimicrobial plastics are materials infused with substances that inhibit the growth and spread of microorganisms such as bacteria, fungi, and viruses. These plastics contain antimicrobial agents, which can be organic compounds, metal ions, or nanoparticles such as silver, copper, or zinc. The agents are integrated during the manufacturing process, providing long-lasting protection against microbial contamination. Used in healthcare, food packaging, and consumer products, antimicrobial plastics help reduce the risk of infections, prolong the shelf life of products, and maintain hygiene. Their effectiveness and safety depend on the type and concentration of the antimicrobial agents used.
Key Takeaways
- Over 1, 500 product literatures, industry releases, annual reports, and various documents from major antimicrobial plastics industry participants, along with credible industry journals, trade association releases, and government websites, have been reviewed to generate valuable industry insights.
- The antimicrobial plastics market study covers 20 countries. The research includes a segment analysis of each country in terms of value and volume for the projected period 2024-2033.
- The study integrated high-quality data, expert opinions and analysis, and crucial independent perspectives. This research approach aims to provide a balanced view of global markets, assisting stakeholders in making informed decisions to achieve their most ambitious growth objectives.
Market Dynamics
Increasing awareness among consumers and industries about the importance of hygiene and sanitation has fueled demand for antimicrobial plastics. This awareness is particularly pronounced in healthcare settings, where the prevention of infections is critical. Also, there is a growing preference for antimicrobial materials in consumer goods such as electronics, kitchenware, and personal care items. Consumers seek products that offer additional protection against bacteria and viruses, especially in high-touch areas.
According to Smithers?report The Future of Global Packaging to 2028, over the five years leading to 2028, the global packaging market is expected to grow from $1.17 trillion to $1.42 trillion, expanding at a CAGR of 3.9%. Asia, the largest market, accounted for $470 billion of global packaging sales in 2023. North America follows in second place with $270 billion, while Western Europe holds third place with $234 billion in sales. Currently, the emerging and developing regions of Eastern Europe, South & Central America, the Middle East, and Africa each account for a relatively small share of the global packaging market. Besides, with a global CAGR of 5.1%, flexible plastics are projected to be the fastest-growing packaging material over the next five years, with global sales rising from $197.7 billion in 2023 to $253.2 billion in 2028. Consequently, growing demand for packaging materials is expected to propel the antimicrobial plastics market in coming years.
However, compliance with stringent regulatory requirements, particularly regarding safety, efficacy, and environmental impact, can pose significant barriers for manufacturers. Navigating complex regulatory frameworks, such as those set by the EPA and FDA in the U.S., requires substantial investment in testing and documentation. Nevertheless, recent sustainability initiatives for antimicrobial technologies have emphasized the significance of features like biocompatibility and biostability, thereby creating ample market growth opportunities in the coming years. As a result, water-based antimicrobial coatings with fewer volatile organic compounds have become increasingly attractive to manufacturers. Innovative coatings such as LapisShield by Microban offer long-lasting protection for water-based coatings and can be applied to a wide range of substrates.
The active ingredient in LapisShield disrupts bacterial internal enzymes, blocking metabolic pathways and creating an inhospitable environment that prevents reproduction. Additionally, the technology is free from heavy metals and is registered with the U.S. Environmental Protection Agency and the EU Biocidal Products Regulation, making sustainable antimicrobial water-based coatings more accessible to healthcare equipment manufacturers worldwide. Traditionally, in-can antimicrobial technologies have been used to extend the shelf life of solvent-based coatings during storage. However, the benefits of these formulations are minimal once the solution has dried, leaving the product vulnerable to microbial attack. Therefore, long-lasting antimicrobial chemistries such as Ascera are essential for improving coating durability. In addition, incorporating antimicrobial technologies into the base materials of nebulizers, aspirators, and other breathing devices or applying them as coatings on these machines can help keep these essential plastic products cleaner and functional for a longer duration.
Patent Analysis:

Market Segmentation
The antimicrobial plastics market is segmented on the basis of additive, plastic, end-use and region. By additive, the market is classified into inorganic and organic. By plastic, the market is classified into engineering, high-performance, and others. By end-use, the market is segmented into healthcare, packaging, automotive, consumer goods, building & construction, and others. Region-wise, the antimicrobial plastics market share is studied across areas such as North America, Europe, Asia-Pacific, and LAMEA.
Regional/Country Market Outlook
The antimicrobial plastics market in North America is significant and growing, driven by increasing demand across various sectors such as healthcare, consumer goods, automotive, and packaging. The U.S. leads this market, benefiting from a strong demand for antimicrobial solutions in healthcare facilities, consumer products, and automotive interiors. The presence of major manufacturers and advanced R&D facilities further supports market growth. Canada also represents a growing market, with rising investments in healthcare and consumer goods sectors to meet higher hygiene standards.
Competitive Landscape
Key players in the antimicrobial plastics market include INEOS Group, BioCote Limited, Lonza Group, Microban International, RTP Company, Avient Corporation, BASF SE, Palram Industries Ltd., LyondellBasell Industries Holdings B.V., and DuPont de Nemours.
Key Developments
- In 2023, Microban International announced the launch of a new built-in antibacterial technology called MicroGuard. This technology is specifically designed for polymer materials such as polyvinyl chloride (PVC) , polyurethane (PU) , and ethylene-vinyl acetate copolymer (EVA) foam. Compared to similar antibacterial additives on the market, MicroGuard offers more user-friendly features and can replace arsenic-containing organic compound antibacterial agents. Importantly, it does not pollute water sources or harm aquatic organisms during application, aiding manufacturers in achieving production processes that comply with industry regulatory standards. MicroGuard can be used in polymer products for outdoor applications like roof waterproofing membranes, tarpaulins, awnings, and patios, as well as in consumer products made from PU and EVA foams, such as shoe soles, furniture cushions, and mattresses.
- In 2023, Avient Corporation announced the expansion of its Cesa Withstand portfolio to include new grades of antimicrobial and antifungal additives. These new grades are designed to enhance the performance of thermoplastic polyurethane (TPU) film-laminated products and devices, particularly in applications where preventing microbial growth is crucial. Cesa Withstand additives use organic and inorganic ingredients to inhibit the growth of bacteria, mold, and fungi on plastic surfaces, delivering exceptional antimicrobial performance. Extensive testing to international standards, including JIS 2801, has confirmed the effective reduction of bacterial activity on TPU film laminated plastic and textile surfaces. Additionally, the additives have passed stringent anti-fungal testing according to JIS Z 2911.
- In 2021, Avient Corporation introduced three new proprietary thermoplastic elastomer (TPE) formulations with antimicrobial additives to its GLS TPE portfolio. These additives, tested according to JIS Z2801 and ASTM G21-15 standards, inhibit bacterial growth by 99.9 percent or more and resist fungal and mold growth, providing protection for molded plastic parts. The GLS TPEs with antimicrobial additives are available in Versaflex and OnFlex grades. They are suitable for applications in consumer electronics, personal care item grips, and automotive components such as cup holder mats and HVAC seals.
Public Policies
- The Environmental Protection Agency (EPA) regulates antimicrobial agents in plastics under the Federal Insecticide, Fungicide, and Rodenticide Act (FIFRA) . Manufacturers must register their products, proving they are safe and effective.
- The Food and Drug Administration (FDA) oversees antimicrobial plastics used in food contact applications, ensuring they meet safety standards under the Federal Food, Drug, and Cosmetic Act (FFDCA) .
- The Registration, Evaluation, Authorization, and Restriction of Chemicals (REACH) regulation requires companies to provide safety information on chemicals used in antimicrobial plastics.
Key Sources Referred
- Environmental Protection Agency (EPA)
- Food and Drug Administration (FDA)
- European Chemicals Agency (ECHA)
- European Food Safety Authority (EFSA)
- Health Canada
- Food Safety Commission (FSC)
- National Health Commission (NHC)
- Therapeutic Goods Administration (TGA)
Key Benefits For Stakeholders
- This report provides a quantitative analysis of the market segments, current trends, estimations, and dynamics of the antimicrobial plastics market analysis from 2024 to 2033 to identify the prevailing antimicrobial plastics market opportunities.
- The market research is offered along with information related to key drivers, restraints, and opportunities.
- Porter's five forces analysis highlights the potency of buyers and suppliers to enable stakeholders make profit-oriented business decisions and strengthen their supplier-buyer network.
- In-depth analysis of the antimicrobial plastics market segmentation assists to determine the prevailing market opportunities.
- Major countries in each region are mapped according to their revenue contribution to the global market.
- Market player positioning facilitates benchmarking and provides a clear understanding of the present position of the market players.
- The report includes the analysis of the regional as well as global antimicrobial plastics market trends, key players, market segments, application areas, and market growth strategies.
Antimicrobial Plastics Market Report Highlights
| Aspects | Details |
| Market Size By 2033 | USD 87.4 Billion |
| Growth Rate | CAGR of 7.4% |
| Forecast period | 2024 - 2033 |
| Report Pages | 250 |
| By Additive |
|
| By Plastic |
|
| By End-Use |
|
| By Region |
|
| Key Market Players | INEOS Group, Lonza Group, RTP Company, LLC, Avient Corporation, BioCote Limited, Microban International, BASF SE, Palram Industries Ltd., LyondellBasell Industries Holdings B.V., DuPont de Nemours, Inc. |
The antimicrobial plastics market is driven by heightened hygiene and sanitation awareness, especially in healthcare settings to prevent infections. Increased consumer demand for antimicrobial products in everyday items like electronics and personal care products also fuels growth.
Key players in the antimicrobial plastics market include INEOS Group, BioCote Limited, Lonza Group, Microban International, RTP Company, Avient Corporation, BASF SE, Palram Industries Ltd., LyondellBasell Industries Holdings B.V., and DuPont de Nemours.
The healthcare segment is expected to lead throughout the forecast period.
Asia-Pacific is the largest regional market for Antimicrobial Plastics.
The antimicrobial plastics market was valued at $43.1 billion in 2023, and is estimated to reach $87.4 billion by 2033, growing at a CAGR of 7.4% from 2024 to 2033.
Loading Table Of Content...

