0
2018
Application Container Market

Application Container Market

by Deployment Model (On-premise and Cloud), Organization Size (Small- & Medium-sized Enterprises (SMEs) and Large Enterprises), Industry Vertical (IT & Telecom, Government, Healthcare, BFSI, Retail, Education, Others) - Global Opportunity Analysis and Industry Forecast, 2018-2025

Report Code: A04339
Jun 2018 | Pages: 216
Tables: 106
Charts: 60
  • Formats*:

  • pdf

    Single User License, Five User
    License & Enterprise User License

  • xls

    Data Pack Excel License

  • ppt

    It comes with the additional cost
    of $2500.00 contact sales.


COVID-19

Pandemic disrupted the entire world and affected many industries.

Get detailed COVID-19 impact analysis on the Application Container Market

Request Now !

Application Container Market Overview:

The application container technology helps enterprises to enhance their core competencies, such as security, network connectivity, customer relationships, and end-to-end services level monitoring. It enables the end-user organizations to optimize their application infrastructure resource utilization and save operating cost. The adoption of application container is growing, as a number of organizations are deploying containers to help build, manage, and easily move applications across different environments. Moreover, it provides increased flexibility and efficiency, and allows customers to migrate to cloud native environments. The global application container market size was valued at $698 million in 2016, and is projected to reach at $8,202 million by 2025, growing at a CAGR of 31.8% from 2018 to 2025

Global Application Container Market

Factors such as gaining momentum in microservices architecture and ongoing modernization of existing business-critical applications have driven the growth of the application container market. In addition, increase in financial investment in container technology and presence of large number of start-ups & established vendors in the market are expected to present major opportunities for application container market expansion in the near future.

Global Application Container Market, by Deployment Model

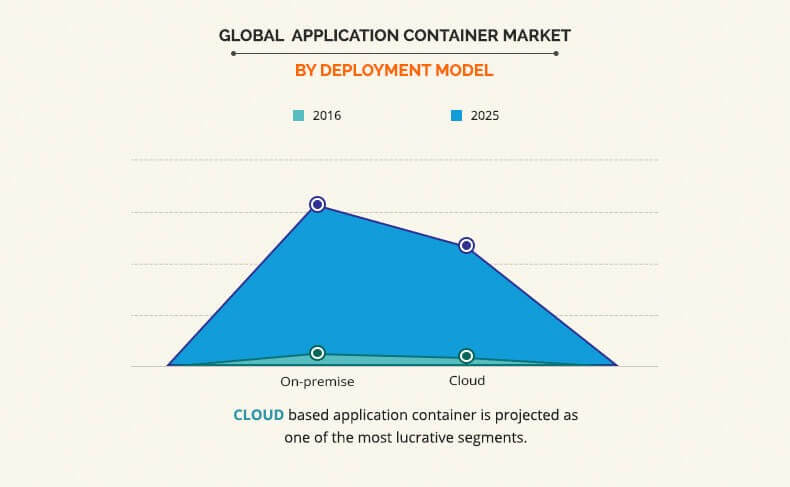
The on-premise segment dominated the overall market in 2016, and is expected to continue this trend in the near future, owing to continuous change in on-premises deployment, which has many of the characteristics of the cloud such as high degree of virtualization and relative independence from hardware constraints through abstraction.

Global Application Container Market, by Industry Vertical

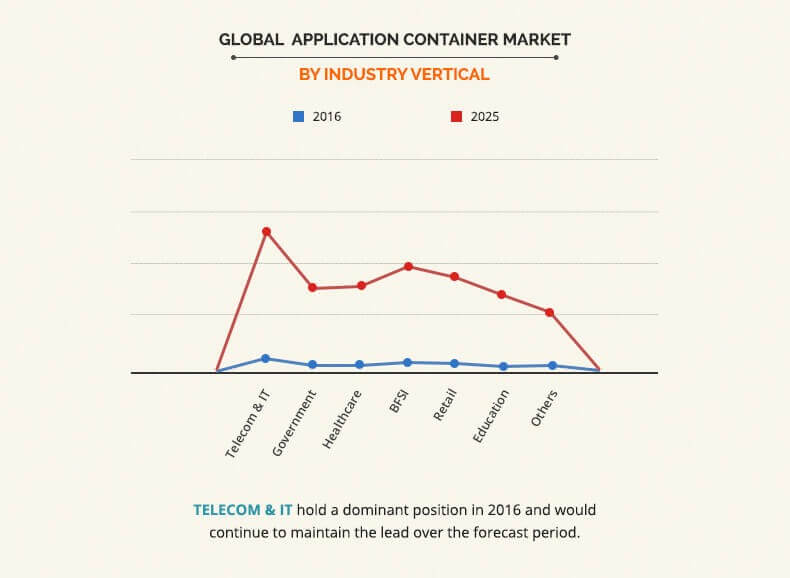
The IT & telecom segment dominated the overall application container market share in 2016, and is expected to continue this trend in the near future, owing to ongoing application modernization in IT industry primarily to empower digital customer experience and growing need for agile business applications.

Application Container Market, by Region

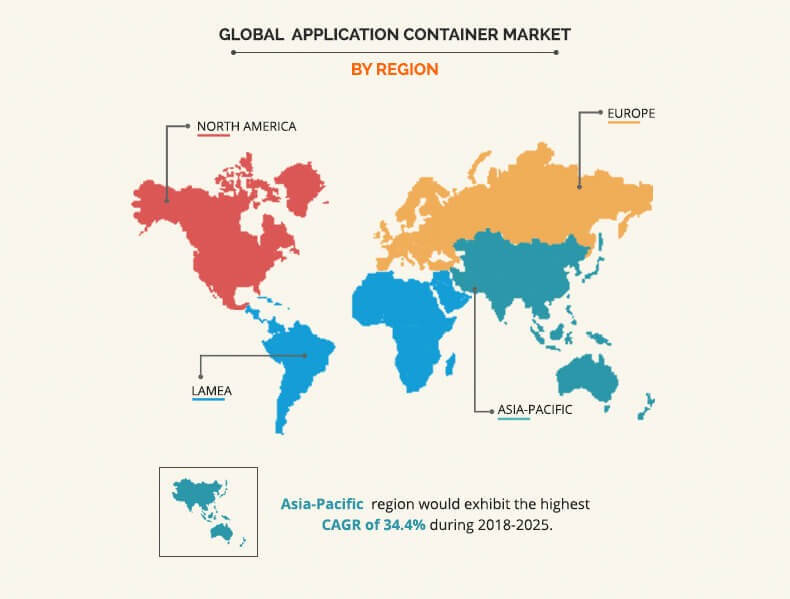
North America dominated the overall market in 2016, due to the factors such as availability of advanced ICT infrastructure in the region, consistent research & development activities performed by the technology providers, and an extensive cloud network established by major cloud service providers. However, Asia-Pacific is expected to witness the highest growth rate during the forecasted period.

The report focuses on the growth prospects and restraints of the market based on the analysis of regional application container market trends. The study provides Porter’s Five Forces analysis of the industry to understand the impact of various factors such as bargaining power of suppliers, competitive intensity of competitors, threat of new entrants, threat of substitutes, and bargaining power of buyers on the growth of the market. These factors collectively impact the growth of the global application container market size during the forecast period.

Segment Review

The global application container market is segmented into deployment model, organization size, industry vertical, and region. Based on deployment model, the market is bifurcated into on-premise and cloud-based. On the basis of organization size, it is categorized into small & medium sized enterprises (SMEs) and large enterprises. By industry vertical, it is divided into IT & telecom, government, healthcare, BFSI, retail, education, others. Region wise, it is analyzed across North America, Europe, Asia-Pacific, and LAMEA.

The key players operating in the global supply chain management software market include Amazon Web Services, Inc., CA Technologies, Docker Inc., Google, Inc., IBM Corporation, Joyent, Inc., Mesosphere, Inc., Microsoft Corporation, Rancher Labs, Inc., and Red Hat, Inc.

Top Impacting Factors

Rise in popularity of application container technology over virtual machines, surge in adoption of cloud-based computing system in organizations, and rise in trend of Internet of Things (IoT) among end users act as the major drivers of the market. However, security risks associated with the application container technology is expected to hamper the market growth during the forecast period.

Rise in Popularity of Application Container Technology Over Virtual Machines

Rise in popularity of application container technology over the virtual machines due to its numerous benefits is expected to boost the growth of the market. For instance, an application container is of the size 10 megabytes, whereas a virtual machine with its own entire operating system have size of several gigabytes. Owing to this, a single server can host far more containers than virtual machines. Another major benefit is that virtual machines may take several minutes to boot up their operating systems and begin running the applications they host, while application container can be started almost instantly.

Surge in Adoption of Cloud-based Computing System in Organizations

Cloud computing vendors are offering multitenancy services, which provide a single set of software application to more than one customer at the same time. The adoption of multitenancy cloud environment helps enterprises to decrease the cost of running a technology by sharing information technology resources. SMEs are deploying multitenancy architecture to reduce the IT maintenance cost and achieve economies of scale. Thus, emergence of multitenancy services is expected to increase the adoption of cloud computing.

Rise in Trend of Internet of Things (IoT) Among End Users

Continuously increase in volume of data generated by the adoption of Internet of Thing (IoT) is boosting the market for application container. Moreover, application containers are used to support all the features, which are required to run an application on resource constrained IoT Devices. They are portable, efficient, and allow quick application deployment and rapid application scaling. IoT-frontend applications would benefit the most with the use of application container model, as it will make it easy to deploy, run, and upgrade the applications by using container orchestration tools such as Kubernetes.

Impact of COVID-19 on Application Container Market:

  • The global lockdown has not impacted on the application container market as the operations in the IT industry are carried out normally by ‘working from home’ structure. And, as a result, the use of application container in IT industry has a constant demand across the world.
  • Moreover, the application container has become helpful to provide greater efficiency and better application development during work from home. Therefore, all the software organizations have adopted the application container during Covid-19 pandemic.

Key Benefits for Stakeholders

  • This study includes the analytical depiction of the global application container market along with current trends and future estimations to determine the imminent investment pockets.
  • The report presents information related to key drivers, restraints, and opportunities.
  • The current market is quantitatively analyzed from 2016 to 2023 to highlight the financial competency of the industry.
  • Porter’s Five Forces analysis illustrates the potency of buyers & suppliers in the global application container industry.

Application Container Market Report Highlights

Aspects Details
By Deployment Model
  • On-premise
  • Cloud
By Organization Size
  • Small- & Medium-sized Enterprises (SMEs)
  • Large Enterprises
By Industry Vertical
  • Telecom & IT
  • Government
  • Healthcare
  • BFSI
  • Retail
  • Education
  • Others
By Geography
  • North America
    • U.S.
    • Canada
    • Mexico
  • Europe
    • UK
    • Germany
    • France
    • Italy
    • Rest of Europe
  • Asia-Pacific
    • China
    • Singapore
    • Japan
    • Australia
    • Rest of APAC
  • LAMEA
    • Latin America
    • Middle East
    • Africa
Key Market Players Amazon Web Services, Inc., CA Technologies, Google LLC, Red Hat, Inc., Docker, Inc., SAP SE, Microsoft Corporation, Joyent, Inc., Mesosphere, Inc., Rancher Labs, Inc., International Business Machines Corporation
 

CHAPTER 1: INTRODUCTION

1.1. Report description
1.2. Key benefits for stakeholders
1.3. Research methodology

1.3.1. Secondary research
1.3.2. Primary research
1.3.3. Analyst tools & models

CHAPTER 2: EXECUTIVE SUMMARY

2.1. CXO perspective

CHAPTER 3: MARKET OVERVIEW

3.1. Market definition and scope
3.2. Key findings

3.2.1. Top impacting factors
3.2.2. Top investment pockets
3.2.3. Top winning strategies

3.3. Porter's five forces analysis
3.4. Key Player Positioning, 2016
3.5. Market dynamics

3.5.1. Drivers

3.5.1.1. Rise in popularity of application container technology over virtual machines
3.5.1.2. Growing adoption of cloud-based computing system in organizations
3.5.1.3. Rising adoption of Internet of Things (IoT) among end users

3.5.2. Restraints

3.5.2.1. Security Risks Associated With the application container technology

3.5.3. Opportunities

3.5.3.1. Increasing investment in application container technology

CHAPTER 4: APPLICATION CONTAINER MARKET, BY DEPLOYMENT MODEL

4.1. Overview
4.2. On-premise

4.2.1. Key market trends
4.2.2. Key growth factors and opportunities
4.2.3. Market size and forecast, by region
4.2.4. Market analysis by country

4.3. Cloud

4.3.1. Key market trends
4.3.2. Key growth factors and opportunities
4.3.3. Market size and forecast, by region
4.3.4. Market analysis by country

CHAPTER 5: APPLICATION CONTAINER MARKET, BY ORGANIZATION SIZE

5.1. Overview
5.2. Small & Medium Size Enterprises (SME’s)

5.2.1. Key market trends
5.2.2. Key growth factors and opportunities
5.2.3. Market size and forecast, by region
5.2.4. Market analysis by country

5.3. Large Enterprises

5.3.1. Key market trends
5.3.2. Key growth factors and opportunities
5.3.3. Market size and forecast, by region
5.3.4. Market analysis by country

CHAPTER 6: APPLICATION CONTAINER MARKET, BY INDUSTRY VERTICALS

6.1. Overview
6.2. Telecom & IT

6.2.1. Key market trends
6.2.2. Key growth factors and opportunities
6.2.3. Market size and forecast, by region
6.2.4. Market analysis by country

6.3. Government

6.3.1. Key market trends
6.3.2. Key growth factors and opportunities
6.3.3. Market size and forecast, by region
6.3.4. Market analysis by country

6.4. Healthcare

6.4.1. Key market trends
6.4.2. Key growth factors and opportunities
6.4.3. Market size and forecast, by region
6.4.4. Market analysis by country

6.5. BFSI

6.5.1. Key market trends
6.5.2. Key growth factors and opportunities
6.5.3. Market size and forecast, by region
6.5.4. Market analysis by country

6.6. Retail

6.6.1. Key market trends
6.6.2. Key growth factors and opportunities
6.6.3. Market size and forecast, by region
6.6.4. Market analysis by country

6.7. Education

6.7.1. Key market trends
6.7.2. Key growth factors and opportunities
6.7.3. Market size and forecast, by region
6.7.4. Market analysis by country

6.8. Others

6.8.1. Key market trends
6.8.2. Key growth factors and opportunities
6.8.3. Market size and forecast, by region
6.8.4. Market analysis by country

CHAPTER 7: APPLICATION CONTAINER MARKET, BY GEOGRAPHY

7.1. Overview
7.2. North America

7.2.1. Key market trends
7.2.2. Key growth factors and opportunities
7.2.3. Market size and forecast

7.2.3.1. Market size and forecast, by deployemnt model
7.2.3.2. Market size and forecast, by organization size
7.2.3.3. Market size and forecast, by Industry Vertical
7.2.3.4. Market size and forecast, by country
7.2.3.5. U.S.

7.2.3.5.1. Market size and forecast, by deployment model
7.2.3.5.2. Market size and forecast, by organization size
7.2.3.5.3. Market size and forecast, by end user

7.2.3.6. Canada

7.2.3.6.1. Market size and forecast, by deployment model
7.2.3.6.2. Market size and forecast, by organization size
7.2.3.6.3. Market size and forecast, by end user

7.2.3.7. Mexico

7.2.3.7.1. Market size and forecast, by deployment model
7.2.3.7.2. Market size and forecast, by organization size
7.2.3.7.3. Market size and forecast, by end user

7.3. Europe

7.3.1. Key market trends
7.3.2. Key growth factors and opportunities
7.3.3. Market size and forecast

7.3.3.1. Market size and forecast, by deployemnt model
7.3.3.2. Market size and forecast, by organization size
7.3.3.3. Market size and forecast, by Industry Vertical
7.3.3.4. Market size and forecast, by country
7.3.3.5. UK

7.3.3.5.1. Market size and forecast, by deployment model
7.3.3.5.2. Market size and forecast, by organization size
7.3.3.5.3. Market size and forecast, by end user

7.3.3.6. Germany

7.3.3.6.1. Market size and forecast, by deployment model
7.3.3.6.2. Market size and forecast, by organization size
7.3.3.6.3. Market size and forecast, by end user

7.3.3.7. France

7.3.3.7.1. Market size and forecast, by deployment model
7.3.3.7.2. Market size and forecast, by organization size
7.3.3.7.3. Market size and forecast, by end user

7.3.3.8. Italy

7.3.3.8.1. Market size and forecast, by deployment model
7.3.3.8.2. Market size and forecast, by organization size
7.3.3.8.3. Market size and forecast, by end user

7.3.3.9. Rest of Europe

7.3.3.9.1. Market size and forecast, by deployment model
7.3.3.9.2. Market size and forecast, by organization size
7.3.3.9.3. Market size and forecast, by end user

7.4. Asia-Pacific

7.4.1. Key market trends
7.4.2. Key growth factors and opportunities
7.4.3. Market size and forecast

7.4.3.1. Market size and forecast, by deployment model
7.4.3.2. Market size and forecast, by organization size
7.4.3.3. Market size and forecast, by Industry Vertical
7.4.3.4. Market size and forecast, by country
7.4.3.5. China

7.4.3.5.1. Market size and forecast, by deployment model
7.4.3.5.2. Market size and forecast, by organization size
7.4.3.5.3. Market size and forecast, by end user

7.4.3.6. Singapore

7.4.3.6.1. Market size and forecast, by deployment model
7.4.3.6.2. Market size and forecast, by organization size
7.4.3.6.3. Market size and forecast, by end user

7.4.3.7. Japan

7.4.3.7.1. Market size and forecast, by deployment model
7.4.3.7.2. Market size and forecast, by organization size
7.4.3.7.3. Market size and forecast, by end user

7.4.3.8. Australia

7.4.3.8.1. Market size and forecast, by deployment model
7.4.3.8.2. Market size and forecast, by organization size
7.4.3.8.3. Market size and forecast, by end user

7.4.3.9. Rest of APAC

7.4.3.9.1. Market size and forecast, by deployment model
7.4.3.9.2. Market size and forecast, by organization size
7.4.3.9.3. Market size and forecast, by end user

7.5. LAMEA

7.5.1. Key market trends
7.5.2. Key growth factors and opportunities
7.5.3. Market size and forecast

7.5.3.1. Market size and forecast, by deployemnt model
7.5.3.2. Market size and forecast, by organization size
7.5.3.3. Market size and forecast, by Industry Vertical
7.5.3.4. Market size and forecast, by country
7.5.3.5. Latin America

7.5.3.5.1. Market size and forecast, by deployment model
7.5.3.5.2. Market size and forecast, by organization size
7.5.3.5.3. Market size and forecast, by end user

7.5.3.6. Middle East

7.5.3.6.1. Market size and forecast, by deployment model
7.5.3.6.2. Market size and forecast, by organization size
7.5.3.6.3. Market size and forecast, by end user

7.5.3.7. Africa

7.5.3.7.1. Market size and forecast, by deployment model
7.5.3.7.2. Market size and forecast, by organization size
7.5.3.7.3. Market size and forecast, by industry vertical

CHAPTER 8: COMPANY PROFILES

8.1. Amazon Web Services, Inc.

8.1.1. Company overview
8.1.2. Company snapshot
8.1.3. Product portfolio
8.1.4. Business performance
8.1.5. Key strategic moves and developments

8.2. CA Technologies

8.2.1. Company overview
8.2.2. Company snapshot
8.2.3. Operating business segments
8.2.4. Product portfolio
8.2.5. Business performance
8.2.6. Key strategic moves and developments

8.3. Docker, Inc.

8.3.1. Company overview
8.3.2. Company snapshot
8.3.3. Product portfolio
8.3.4. Key strategic moves and developments

8.4. Google LLC

8.4.1. Company overview
8.4.2. Company snapshot
8.4.3. Product portfolio
8.4.4. Business performance
8.4.5. Key strategic moves and developments

8.5. International Business Machines Corporation

8.5.1. Company overview
8.5.2. Company snapshot
8.5.3. Operating business segments
8.5.4. Product portfolio
8.5.5. Business performance
8.5.6. Key strategic moves and developments

8.6. Joyent, Inc.

8.6.1. Company overview
8.6.2. Company snapshot
8.6.3. Product portfolio
8.6.4. Key strategic moves and developments

8.7. Mesosphere, Inc.

8.7.1. Company overview
8.7.2. Company snapshot
8.7.3. Product portfolio
8.7.4. Key strategic moves and developments

8.8. Microsoft Corporation

8.8.1. Company overview
8.8.2. Company snapshot
8.8.3. Operating business segments
8.8.4. Product portfolio
8.8.5. Business performance
8.8.6. Key strategic moves and developments

8.9. Rancher Labs, Inc.

8.9.1. Company overview
8.9.2. Company snapshot
8.9.3. Product portfolio
8.9.4. Key strategic moves and developments

8.10. Red Hat, Inc.

8.10.1. Company overview
8.10.2. Company snapshot
8.10.3. Operating business segments
8.10.4. Product portfolio
8.10.5. Business performance
8.10.6. Key strategic moves and developments

8.11. SAP SE

8.11.1. Company overview
8.11.2. Company snapshot
8.11.3. Operating business segments
8.11.4. Product portfolio
8.11.5. Business performance

LIST OF TABLES

TABLE 01. GLOBAL APPLICATION CONTAINER MARKET REVENUE, BY DEPLOYMENT MODEL, 2016-2025 ($MILLION)
TABLE 02. APPLICATION CONTAINER MARKET REVENUE FOR ON-PREMISE, BY REGION, 2016-2025 ($MILLION)
TABLE 03. APPLICATION CONTAINER MARKET REVENUE FOR CLOUD-BASED, BY REGION, 2016-2025 ($MILLION)
TABLE 04. GLOBAL APPLICATION CONTAINER MARKET REVENUE, BY ORGANIZATION SIZE, 2016-2025 ($MILLION)
TABLE 05. APPLICATION CONTAINER MARKET REVENUE FOR SME’S, BY REGION, 2016-2025 ($MILLION)
TABLE 06. APPLICATION CONTAINER MARKET REVENUE FOR LARGE ENTERPRISES, BY REGION, 2016-2025 ($MILLION)
TABLE 07. GLOBAL APPLICATION CONTAINER MARKET REVENUE, BY INDUSTRY VERTICALS, 2016-2025 ($MILLION)
TABLE 08. APPLICATION CONTAINER MARKET REVENUE FOR TELECOM & IT, BY REGION, 2016-2025 ($MILLION)
TABLE 09. APPLICATION CONTAINER MARKET REVENUE FOR GOVERNMENT, BY REGION, 2016-2025 ($MILLION)
TABLE 10. APPLICATION CONTAINER MARKET REVENUE FOR HEALTHCARE, BY REGION, 2016-2025 ($MILLION)
TABLE 11. APPLICATION CONTAINER MARKET REVENUE FOR BFSI, BY REGION, 2016-2025 ($MILLION)
TABLE 12. APPLICATION CONTAINER MARKET REVENUE FOR RETAIL, BY REGION, 2016-2025 ($MILLION)
TABLE 13. APPLICATION CONTAINER MARKET REVENUE FOR EDUCATION, BY REGION, 2016-2025 ($MILLION)
TABLE 14. APPLICATION CONTAINER MARKET REVENUE FOR EDUCATION, BY REGION, 2016-2025 ($MILLION)
TABLE 15. APPLICATION CONTAINER MARKET REVENUE, BY REGION, 2016-2025 ($MILLION)
TABLE 16. NORTH AMERICA APPLICATION CONTAINER MARKET, BY DEPLOYMENT MODEL, 2016-2025 ($MILLION)
TABLE 17. NORTH AMERICA APPLICATION CONTAINER MARKET, BY ORGANIZATION SIZE, 2016-2025 ($MILLION)
TABLE 18. NORTH AMERICA APPLICATION CONTAINER MARKET, BY INDUSTRY VERTICAL, 2016-2025 ($MILLION)
TABLE 19. NORTH AMERICA APPLICATION CONTAINER MARKET, BY COUNTRY, 2016-2025 ($MILLION)
TABLE 20. U.S. APPLICATION CONTAINER MARKET, BY DEPLOYMENT MODEL, 2016-2025 ($MILLION)
TABLE 21. U.S. APPLICATION CONTAINER MARKET, BY ORGANIZATION SIZE, 2016-2025 ($MILLION)
TABLE 22. U.S. APPLICATION CONTAINER MARKET, BY INDUSTRY VERTICAL, 2016-2025 ($MILLION)
TABLE 23. CANADA APPLICATION CONTAINER MARKET, BY DEPLOYMENT MODEL, 2016-2025 ($MILLION)
TABLE 24. CANADA APPLICATION CONTAINER MARKET, BY ORGANIZATION SIZE, 2016-2025 ($MILLION)
TABLE 25. CANADA APPLICATION CONTAINER MARKET, BY INDUSTRY VERTICAL, 2016-2025 ($MILLION)
TABLE 26. MEXICO APPLICATION CONTAINER MARKET, BY DEPLOYMENT MODEL, 2016-2025 ($MILLION)
TABLE 27. MEXICO APPLICATION CONTAINER MARKET, BY ORGANIZATION SIZE, 2016-2025 ($MILLION)
TABLE 28. MEXICO APPLICATION CONTAINER MARKET, BY INDUSTRY VERTICAL, 2016-2025 ($MILLION)
TABLE 29. EUROPE APPLICATION CONTAINER MARKET, BY DEPLOYMENT MODEL, 2016-2025 ($MILLION)
TABLE 30. EUROPE APPLICATION CONTAINER MARKET, BY ORGANIZATION SIZE, 2016-2025 ($MILLION)
TABLE 31. EUROPE APPLICATION CONTAINER MARKET, BY INDUSTRY VERTICAL, 2016-2025 ($MILLION)
TABLE 32. EUROPE APPLICATION CONTAINER MARKET, BY COUNTRY, 2016-2025 ($MILLION)
TABLE 33. UK APPLICATION CONTAINER MARKET, BY DEPLOYMENT MODEL, 2016-2025 ($MILLION)
TABLE 34. UK APPLICATION CONTAINER MARKET, BY ORGANIZATION SIZE, 2016-2025 ($MILLION)
TABLE 35. UK APPLICATION CONTAINER MARKET, BY INDUSTRY VERTICAL, 2016-2025 ($MILLION)
TABLE 36. GERMANY APPLICATION CONTAINER MARKET, BY DEPLOYMENT MODEL, 2016-2025 ($MILLION)
TABLE 37. GERMANY APPLICATION CONTAINER MARKET, BY ORGANIZATION SIZE, 2016-2025 ($MILLION)
TABLE 38. GERMANY APPLICATION CONTAINER MARKET, BY INDUSTRY VERTICAL, 2016-2025 ($MILLION)
TABLE 39. FRANCE APPLICATION CONTAINER MARKET, BY DEPLOYMENT MODEL, 2016-2025 ($MILLION)
TABLE 40. FRANCE APPLICATION CONTAINER MARKET, BY ORGANIZATION SIZE, 2016-2025 ($MILLION)
TABLE 41. FRANCE APPLICATION CONTAINER MARKET, BY INDUSTRY VERTICAL, 2016-2025 ($MILLION)
TABLE 42. ITALY APPLICATION CONTAINER MARKET, BY DEPLOYMENT MODEL, 2016-2025 ($MILLION)
TABLE 43. ITALY APPLICATION CONTAINER MARKET, BY ORGANIZATION SIZE, 2016-2025 ($MILLION)
TABLE 44. ITALY APPLICATION CONTAINER MARKET, BY INDUSTRY VERTICAL, 2016-2025 ($MILLION)
TABLE 45. REST OF EUROPE APPLICATION CONTAINER MARKET, BY DEPLOYMENT MODEL, 2016-2025 ($MILLION)
TABLE 46. REST OF EUROPE APPLICATION CONTAINER MARKET, BY ORGANIZATION SIZE, 2016-2025 ($MILLION)
TABLE 47. REST OF EUROPE APPLICATION CONTAINER MARKET, BY INDUSTRY VERTICAL, 2016-2025 ($MILLION)
TABLE 48. ASIA-PACIFIC APPLICATION CONTAINER MARKET, BY DEPLOYMENT MODEL, 2016-2025 ($MILLION)
TABLE 49. ASIA-PACIFIC APPLICATION CONTAINER MARKET, BY ORGANIZATION SIZE, 2016-2025 ($MILLION)
TABLE 50. ASIA-PACIFIC APPLICATION CONTAINER MARKET, BY INDUSTRY VERTICAL, 2016-2025 ($MILLION)
TABLE 51. ASIA-PACIFIC APPLICATION CONTAINER MARKET, BY COUNTRY, 2016-2025 ($MILLION)
TABLE 52. CHINA APPLICATION CONTAINER MARKET, BY DEPLOYMENT MODEL, 2016-2025 ($MILLION)
TABLE 53. CHINA APPLICATION CONTAINER MARKET, BY ORGANIZATION SIZE, 2016-2025 ($MILLION)
TABLE 54. CHINA APPLICATION CONTAINER MARKET, BY INDUSTRY VERTICAL, 2016-2025 ($MILLION)
TABLE 55. SINGAPORE APPLICATION CONTAINER MARKET, BY DEPLOYMENT MODEL, 2016-2025 ($MILLION)
TABLE 56. SINGAPORE APPLICATION CONTAINER MARKET, BY ORGANIZATION SIZE, 2016-2025 ($MILLION)
TABLE 57. SINGAPORE APPLICATION CONTAINER MARKET, BY INDUSTRY VERTICAL, 2016-2025 ($MILLION)
TABLE 58. JAPAN APPLICATION CONTAINER MARKET, BY DEPLOYMENT MODEL, 2016-2025 ($MILLION)
TABLE 59. JAPAN APPLICATION CONTAINER MARKET, BY ORGANIZATION SIZE, 2016-2025 ($MILLION)
TABLE 60. JAPAN APPLICATION CONTAINER MARKET, BY INDUSTRY VERTICAL, 2016-2025 ($MILLION)
TABLE 61. AUSTRALIA APPLICATION CONTAINER MARKET, BY DEPLOYMENT MODEL, 2016-2025 ($MILLION)
TABLE 62. AUSTRALIA APPLICATION CONTAINER MARKET, BY ORGANIZATION SIZE, 2016-2025 ($MILLION)
TABLE 63. AUSTRALIA APPLICATION CONTAINER MARKET, BY INDUSTRY VERTICAL, 2016-2025 ($MILLION)
TABLE 64. REST OF APAC APPLICATION CONTAINER MARKET, BY DEPLOYMENT MODEL, 2016-2025 ($MILLION)
TABLE 65. REST OF APAC APPLICATION CONTAINER MARKET, BY ORGANIZATION SIZE, 2016-2025 ($MILLION)
TABLE 66. REST OF APAC APPLICATION CONTAINER MARKET, BY INDUSTRY VERTICAL, 2016-2025 ($MILLION)
TABLE 67. LAMEA APPLICATION CONTAINER MARKET, BY DEPLOYMENT MODEL, 2016-2025 ($MILLION)
TABLE 68. LAMEA APPLICATION CONTAINER MARKET, BY ORGANIZATION SIZE, 2016-2025 ($MILLION)
TABLE 69. LAMEA APPLICATION CONTAINER MARKET, BY INDUSTRY VERTICAL, 2016-2025 ($MILLION)
TABLE 70. LAMEA APPLICATION CONTAINER MARKET, BY COUNTRY, 2016-2025 ($MILLION)
TABLE 71. LATIN AMERICA APPLICATION CONTAINER MARKET, BY DEPLOYMENT MODEL, 2016-2025 ($MILLION)
TABLE 72. LATIN AMERICA APPLICATION CONTAINER MARKET, BY ORGANIZATION SIZE, 2016-2025 ($MILLION)
TABLE 73. LATIN AMERICA APPLICATION CONTAINER MARKET, BY INDUSTRY VERTICAL, 2016-2025 ($MILLION)
TABLE 74. MIDDLE EAST APPLICATION CONTAINER MARKET, BY DEPLOYMENT MODEL, 2016-2025 ($MILLION)
TABLE 75. MIDDLE EAST APPLICATION CONTAINER MARKET, BY DEPLOYMENT MODEL, 2016-2025 ($MILLION)
TABLE 76. MIDDLE EAST APPLICATION CONTAINER MARKET, BY INDUSTRY VERTICAL, 2016-2025 ($MILLION)
TABLE 77. AFRICA APPLICATION CONTAINER MARKET, BY DEPLOYMENT MODEL, 2016-2025 ($MILLION)
TABLE 78. AFRICA APPLICATION CONTAINER MARKET, BY ORGANIZATION SIZE, 2016-2025 ($MILLION)
TABLE 79. AFRICA APPLICATION CONTAINER MARKET, BY INDUSTRY VERTICAL, 2016-2025 ($MILLION)
TABLE 80. AMAZON WEB SERVICES, INC: COMPANY SNAPSHOT
TABLE 81. AMAZON WEB SERVICES, INC: PRODUCT PORTFOLIO
TABLE 82. CA TECHNOLOGIES: COMPANY SNAPSHOT
TABLE 83. CA TECHNOLOGIES: OPERATING SEGMENTS
TABLE 84. CA TECHNOLOGIES: PRODUCT PORTFOLIO
TABLE 85. DOCKER, INC: COMPANY SNAPSHOT
TABLE 86. DOCKER, INC: PRODUCT PORTFOLIO
TABLE 87. GOOGLE LLC.: COMPANY SNAPSHOT
TABLE 88. GOOGLE LLC: PRODUCT PORTFOLIO
TABLE 89. IBM: COMPANY SNAPSHOT
TABLE 90. IBM: OPERATING SEGMENTS
TABLE 91. IBM: PRODUCT PORTFOLIO
TABLE 92. JOYENT, INC.: COMPANY SNAPSHOT
TABLE 93. JOYENT, INC: PRODUCT PORTFOLIO
TABLE 94. MESOSPHERE, INC.: COMPANY SNAPSHOT
TABLE 95. MESOSPHERE, INC: PRODUCT PORTFOLIO
TABLE 96. MICROSOFT CORPORATION: COMPANY SNAPSHOT
TABLE 97. MICROSOFT CORPORATION: OPERATING SEGMENTS
TABLE 98. MICROSOFT CORPORATION: PRODUCT PORTFOLIO
TABLE 99. RANCHER LABS, INC: COMPANY SNAPSHOT
TABLE 100. RANCHER LABS, INC: PRODUCT PORTFOLIO
TABLE 101. RED HAT, INC: COMPANY SNAPSHOT
TABLE 102. RED HAT, INC: BUSINESS SEGMENTS
TABLE 103. RED HAT, INC.: PRODUCT PORTFOLIO
TABLE 104. SAP SE: COMPANY SNAPSHOT
TABLE 105. SAP SE: OPERATING SEGMENTS
TABLE 106. SAP SE: PRODUCT PORTFOLIO

LIST OF FIGURES

FIGURE 01. GLOBAL APPLICATION CONTAINER MARKET, 2016-2025
FIGURE 02. APPLICATION CONTAINER MARKET, BY REGION, 2016-2025
FIGURE 03. GLOBAL APPLICATION CONTAINER MARKET: KEY PLAYERS
FIGURE 04. GLOBAL APPLICATION CONTAINER MARKET SEGMENTATION
FIGURE 05. APPLICATION CONTAINER MARKET: TOP IMPACTING FACTOR
FIGURE 06. APPLICATION CONTAINER MARKET: TOP INVESTMENT POCKETS
FIGURE 07. MODERATE-TO-HIGH BARGAINING POWER OF SUPPLIER
FIGURE 08. MODERATE BARGAINING POWER OF BUYER
FIGURE 09. HIGH THREAT OF SUBSTITUTES
FIGURE 10. MODERATE-TO-HIGH THREAT OF NEW ENTRANTS
FIGURE 11. MODERATE-TO-HIGH COMPETITIVE RIVALRY
FIGURE 12. APPLICATION CONTAINER MARKET: KEY PLAYER POSITIONING, 2016
FIGURE 13. DRIVERS, RESTRAINTS, AND OPPORTUNITIES
FIGURE 14. COMPARATIVE SHARE ANALYSIS OF APPLICATION CONTAINER MARKET FOR ON-PREMISE, BY COUNTRY, 2016 & 2025(%)
FIGURE 15. COMPARATIVE SHARE ANALYSIS OF APPLICATION CONTAINER MARKET FOR CLOUD-BASED, BY COUNTRY, 2016 & 2025(%)
FIGURE 16. COMPARATIVE SHARE ANALYSIS OF APPLICATION CONTAINER MARKET FOR SME’S, BY COUNTRY, 2016 & 2025(%)
FIGURE 17. COMPARATIVE SHARE ANALYSIS OF APPLICATION CONTAINER MARKET FOR LARGE ENTERPRISES, BY COUNTRY, 2016 & 2025(%)
FIGURE 18. COMPARATIVE SHARE ANALYSIS OF APPLICATION CONTAINER MARKET FOR TELECOM & IT, BY COUNTRY, 2016 & 2025(%)
FIGURE 19. COMPARATIVE SHARE ANALYSIS OF APPLICATION CONTAINER MARKET FOR GOVERNMENT, BY COUNTRY, 2016 & 2025(%)
FIGURE 20. COMPARATIVE SHARE ANALYSIS OF APPLICATION CONTAINER MARKET FOR HEALTHCARE, BY COUNTRY, 2016 & 2025(%)
FIGURE 21. COMPARATIVE SHARE ANALYSIS OF APPLICATION CONTAINER MARKET FOR GOVERNMENT, BY COUNTRY, 2016 & 2025(%)
FIGURE 22. COMPARATIVE SHARE ANALYSIS OF APPLICATION CONTAINER MARKET FOR RETAIL, BY COUNTRY, 2016 & 2025(%)
FIGURE 23. COMPARATIVE SHARE ANALYSIS OF APPLICATION CONTAINER MARKET FOR EDUCATION, BY COUNTRY, 2016 & 2025(%)
FIGURE 24. COMPARATIVE SHARE ANALYSIS OF APPLICATION CONTAINER MARKET FOR EDUCATION, BY COUNTRY, 2016 & 2025(%)
FIGURE 25. U.S. APPLICATION CONTAINER MARKET, 2016-2025 ($ MILLION)
FIGURE 26. CANADA APPLICATION CONTAINER MARKET, 2016-2025 ($ MILLION)
FIGURE 27. MEXICO APPLICATION CONTAINER MARKET, 2016-2025 ($ MILLION)
FIGURE 28. UK APPLICATION CONTAINER MARKET, 2016-2025 ($ MILLION)
FIGURE 29. GERMANY APPLICATION CONTAINER MARKET, 2016-2025 ($ MILLION)
FIGURE 30. FRANCE APPLICATION CONTAINER MARKET, 2016-2025 ($ MILLION)
FIGURE 31. FRANCE APPLICATION CONTAINER MARKET, 2016-2025 ($ MILLION)
FIGURE 32. REST OF EUROPE APPLICATION CONTAINER MARKET, 2016-2025 ($ MILLION)
FIGURE 33. CHINA APPLICATION CONTAINER MARKET, 2016-2025 ($ MILLION)
FIGURE 34. SINGAPORE APPLICATION CONTAINER MARKET, 2016-2025 ($ MILLION)
FIGURE 35. JAPAN APPLICATION CONTAINER MARKET, 2016-2025 ($ MILLION)
FIGURE 36. AUSTRALIA APPLICATION CONTAINER MARKET, 2016-2025 ($ MILLION)
FIGURE 37. REST OF APAC APPLICATION CONTAINER MARKET, 2016-2025 ($ MILLION)
FIGURE 38. LATIN AMERICA APPLICATION CONTAINER MARKET, 2016-2025 ($ MILLION)
FIGURE 39. MIDDLE EAST APPLICATION CONTAINER MARKET, 2016-2025 ($ MILLION)
FIGURE 40. AFRICA APPLICATION CONTAINER MARKET, 2016-2025 ($ MILLION)
FIGURE 41. AMAZON.COM, INC.: REVENUE, 2015-2017 ($MILLION)
FIGURE 42. AMAZON.COM, INC.: REVENUE SHARE BY SEGMENT, 2017 (%)
FIGURE 43. AMAZON.COM, INC.: REVENUE SHARE BY GEOGRAPHY, 2017 (%)
FIGURE 44. CA TECHNOLOGIES: REVENUE, 2016-2018 ($MILLION)
FIGURE 45. CA TECHNOLOGIES: REVENUE SHARE BY SEGMENT, 2018 (%)
FIGURE 46. CA TECHNOLOGIES: REVENUE SHARE BY GEOGRAPHY, 2018 (%)
FIGURE 47. ALPHABET INC.: NET SALES, 2015-2017 ($MILLION)
FIGURE 48. ALPHABET INC.: REVENUE SHARE BY SEGMENT, 2017 (%)
FIGURE 49. ALPHABET INC.: REVENUE SHARE BY GEOGRAPHY, 2017 (%)
FIGURE 50. IBM: NET SALES, 2015-2017 ($MILLION)
FIGURE 51. IBM: REVENUE SHARE BY SEGMENT, 2017 (%)
FIGURE 52. IBM: REVENUE SHARE BY GEOGRAPHY, 2017 (%)
FIGURE 53. MICROSOFT CORPORATION: REVENUE, 2015-2017 ($MILLION)
FIGURE 54. MICROSOFT CORPORATION: REVENUE SHARE BY SEGMENT, 2017 (%)
FIGURE 55. MICROSOFT CORPORATION: REVENUE SHARE BY GEOGRAPHY, 2017 (%)
FIGURE 56. RED HAT, INC.: REVENUE, 2016-2018 ($MILLION)
FIGURE 57. RED HAT, INC.: REVENUE SHARE BY GEOGRAPHY, 2018 (%)
FIGURE 58. SAP SE: REVENUE, 2015-2017 ($MILLION)
FIGURE 59. SAP SE: REVENUE SHARE BY SEGMENT, 2017 (%)
FIGURE 60. SAP SE: REVENUE SHARE BY GEOGRAPHY, 2017 (%)


Application containerization is an OS-level virtualization method, which is used to deploy and run distributed applications without launching an entire virtual machine (VM) for each app. Adoption of application container technology has increased over a period of time, as the use of multitenancy and cloud management platforms has increased. Furthermore, increase in volume of data generated by the adoption of Internet of Things (IoT) is expected to provide lucrative opportunities for the market. Emergence of ideas such as smart homes, connected cars, connected healthcare, and smart cities are gaining momentum over a period of time. This has enforced enterprises to adopt big data management systems with application containers to effectively analyze and manage large databases.

Increase in interest of enterprises in application container technology boosts the growth of the market. Moreover, presence of a large number of start-ups & established vendors in this market are adopting merger and acquisition as their key developmental strategies. Although there is intense innovation, competition and disruption in the application container market, it has already experienced some consolidation. For instance, in May 2016, Apprenda, a platform as a service (PaaS) cloud software company, acquired Kismatic, a start-up that provides commercial support for the open-source Docker and Kubernetes software for working with applications with code packaged up in containers. North America and Western Europe are continued to be the prime consumers of application container technology. However, Asia-Pacific is expected to experience robust growth, owing to major shift towards cloud computing and virtualization, which make investment in application container technology more attractive to SMEs and organizations in the emerging markets such as China, Japan.

Some of the key players profiled in the report include Amazon Web Services, Inc., CA Technologies, Docker Inc., Google, Inc., IBM Corporation, Joyent, Inc., Mesosphere, Inc., Microsoft Corporation, Rancher Labs, Inc., and Red Hat, Inc. These players have adopted various strategies to enhance their product offerings and to increase their market penetration. For instance, in May 2018, Alphabet Inc. launched gVisor, a sandboxed container runtime that aims to ensure a secure isolation between containers. Moreover, Docker, Inc. launched Docker Enterprise Edition (EE) 2.0 to manage and secure applications on Kubernetes in multi-Linux, multi-OS, and multi-cloud customer environments.

PURCHASE OPTIONS

Call or Email us

U.S.-Canada Toll-free: +1-800-792-5285
Int'l : +1-503-894-6022
Europe : +44-845-528-1300
Email : help@alliedmarketresearch.com

Looking for Customization?

 Customization Request

Have a Question?

 Speak with Analyst

Any Confusion?

 Inquire Before Buying

Have a glance of the Report

  Request Sample

Purchase Full Report of
Application Container Market

Start reading instantly.
This Report and over 66,804+ more Reports, Available with Avenue Library. T&C*.

  • Online Only
  • $3,456
  • Online cloud access only
  • Restricted print, copy, paste & download
  • Read only
  • Free industry update
    (Within 180 days)
  • Free report update in next update cycle
    (Jun 2019 - Jun 2020)
  • Data Pack
  • $3,840
  • Restricted to one authorized user
  • One print only
  • Available in
    Excel
  • Free industry update
    (Within 180 days)
  •   Free report update in next update cycle
    (Jun 2019 - Jun 2020)
  • Single User
  • $5,769
  • Restricted to one authorized user
  • One print only
  • Available in
    PDF
  • Free industry update
    (Within 180 days)
  •   Free report update in next update cycle
    (Jun 2019 - Jun 2020)
  • Five Users
  • $6,450
  • Limited to five authorized users
  • Print upto five copies
  • Available in
    PDF
  • Free industry update
    (Within 180 days)
  •   Free report update in next update cycle
    (Jun 2019 - Jun 2020)
  • Enterprise
    License/PDF

  • $10,995
  • Unlimited
    within
    company/enterprise
  • Available in Excel & PDF
  • Free industry update
    (Within 180 days)
  •   Free report update in next update cycle
    (Jun 2019 - Jun 2020)
  • Library
    Membership

  • $999 $ 1,175
    Per User/ Per month/ Billed annually
  • Published Content
    E-access
  • Company Profiles
    E-access
  • Newly Added Content Access
  • 10 PDF
    Downloads
  • 5 Excel Data
    Pack Downloads
  • 250 Company Profiles PDF Downloads
  • Buy Now

*Taxes/Fees, if applicable will be added during checkout. All prices in USD

RELATED REPORTS
 

Why Allied Market Research?


Infallible Methodology

To ensure high-level data integrity, accurate analysis, and impeccable forecasts

Analyst Support

For complete satisfaction

Customization

On-demand customization of scope of the report to exactly meet your needs

TARGETED MARKET VIEW

Targeted market view to provide pertinent information and save time of readers

Get fresh content delivered

Get insights on topics that are crucial for your business. Stay abreast of your interest areas.

Get Industry Data Alerts

Why Allied Market Research?

Infallible Methodology

To ensure high-level data integrity, accurate analysis, and impeccable forecasts

Analyst Support

For complete satisfaction

Customization

On-demand customization of scope of the report to exactly meet your needs

TARGETED MARKET VIEW

Targeted market view to provide pertinent information and save time of readers