0
2022
Application Delivery Controllers (adc) Market

Application Delivery Controllers (ADC) Market

by Deployment Model (On-Premise, Cloud), by Enterprise Size (Large Enterprises, Small And Medium-Sized Enterprises), by End User (It And Telecom, Retail, Bfsi, Healthcare, Government, Others): Global Opportunity Analysis and Industry Forecast, 2020-2030

✷  Report Code: A03732
Mar 2022 | Pages: 253
Tables: 136
Charts: 58
  • Formats*:

  • pdf

    Single User License, Five User
    License & Enterprise User License

  • xls

    Data Pack Excel License

  • ppt

    It comes with the additional cost
    of $2500.00 contact sales.


Application Delivery Controllers (ADC) Market Research, 2030

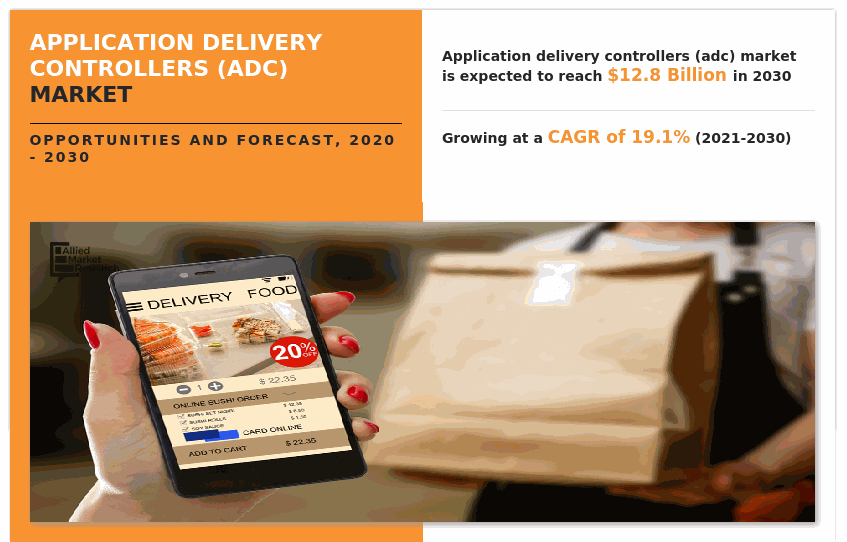
The global ADC market size was valued at $2.3 billion in 2020, and is projected to reach $12.8 billion by 2030, growing at a CAGR of 19.1% from 2021 to 2030.

The COVID-19 outbreak impacted the life & businesses of all the individuals across the globe. The ADC gained more prominence as employees work from home and businesses rapidly transform their environments to keep their staff productive from any location with the COVID-19 pandemic increase in infections. This could further promote growth of the market.

Application delivery controllers (ADC) is a computer networking device used as a part of application delivery network (ADN) in a data center. The emerging need to maintain uninterrupted communication channels among diversified business operations, increase in complications of the companies to communicate and coordinate with business units supported by increased internet traffics, and rise in the number of applications drive the implementation of ADCs.

Inclination toward cloud is expected to increase over the next few years. Increase in the usage rate of cloud gives rise to several network errors. Implementation of ADC in cloud networking helps to control such errors. Thus, increase in complications, due to rapid adaptation rate of cloud networking is expected to fuel the demand for app delivery controller. In addition, growth of SMEs and increase in adoption of ADC by IT and telecom sectors are the major factors that propel the growth of ADC market. However, implementation of government regulations limits the market application delivery controllers market growth. On the contrary, surge in shift from hardware ADC to software virtual delivery application controllers, increase in trend of bring your own device at workplace, and rise  in penetration of mobile-based applications at the workplace drive the growth of ADC market. Low setup and maintenance costs are other factors that encourage enterprises to opt for VDAC. Therefore, adoption of ADC is expected to grow tremendously in the future.

The report focuses on growth prospects, restraints, and trends of the ADC market analysis. The study provides Porter’s five forces analysis to understand the impact of various factors, such as bargaining power of suppliers, competitive intensity of competitors, threat of new entrants, threat of substitutes, and bargaining power of buyers on the ADC market.

The global application delivery controllers market analysis is segmented on the basis of deployment type, enterprise size, end user, and region. Depending on deployment type, the market is divided into software/virtual and hardware. According to enterprise size, it is bifurcated into SMEs and large enterprises. As per  end user, it is categorized into retail, IT & telecom, BFSI, healthcare, government, and others. Region wise, it is analyzed across North America, Europe, Asia-Pacific, and LAMEA.
Application Delivery Controllers (ADC) Market

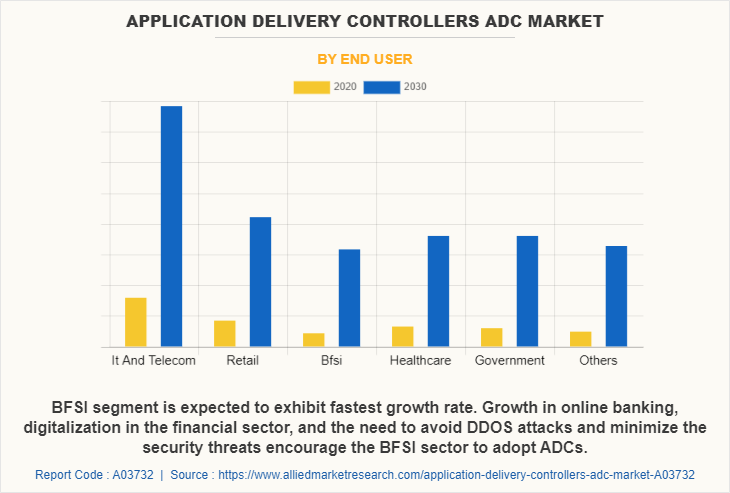
The end-user industries shift toward cloud networking. The IT & telecom sector segment is expected to grow at a notable rate during the application delivery controllers market forecast. The demand for the ADCs from  developing countries, due to high internet penetration. This, in turn, is expected to offer lucrative growth opportunities for the app delivery controller. The government segment is expected to grow during the forecast period.
Application Delivery Controllers (ADC) Market

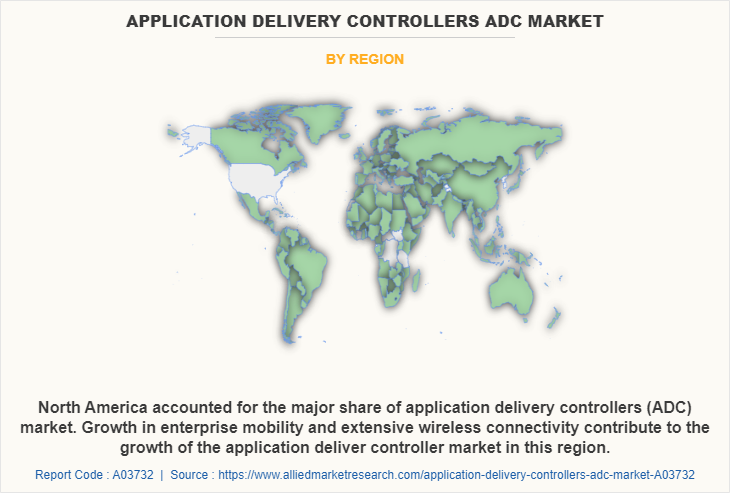
Emerging regions of Asia-Pacific are expected to witness maximum growth of ADCs. Factors such as rapid development of various industries, including IT and emergence of online transactions drive the growth of the ADC.  North America accounted for the highest ADC market share of 50% in 2020, and is expected to maintain its dominance throughout the forecast period, owing to existence of well-developed IT and various end-user industries.

Key players operating in the global application delivery controllers industry include A10 Networks Inc., Citrix Systems Inc., F5 Networks Inc., Array Networks, Inc., Webscale, Dell Inc., Barracuda Networks Inc., Fortinet Inc., Cisco Systems Inc., and KEMP Technologies Inc.

COVID-19 Impact Analysis

The COVID-19 outbreak impacted the life & businesses of all the individuals across the globe. This could further promote growth of the application delivery controllers market trends. Furthermore, according to  recent survey by the Ecological Momentary Assessment, application delivery infrastructure for multi-cloud enterprises used by 253 enterprises during the COVID-19 pandemic discovered that it changed users access applications in enterprises, compelling to adjust to that infrastructure.90% of enterprises made changes to their application delivery infrastructure in response to the COVID-19 pandemic, including strengthen security and increase in capacity.

Top Impacting Factors

Rapid Growth of Data Centers

Growth in dependence on web-based application of companies across the globe drives the data market. Most of the data center providers are offering data center as infrastructure as a service The data center market is rapidly growing, mainly, in the Asian region. For instance, International Business Machine and Nippon Telegraph and Telephone communication have set up their data centers in India. These factors, as a result promotes the application delivery controllers industry.

Growth of SMEs

Increase in adoption of cloud computing within the organization for various processes is anticipated to be a secondary factor that fuels the growth of the app delivery controller. The low infrastructure cost, low maintenance cost, flexibility, and scalability are few factors that attract SMEs to choose software/VADC.  

Major Shift from Hardware ADC to Software /VDAC

Organizations across the globe migrate from the hardware ADC toward virtual ADC (VDAC). Trend of the BYOD at the workplace and increase in penetration of mobile-based applications at the workplace drive the VDAC market. Low setup and maintenance costs are other factors that encourage enterprises to choose VDAC.

Key Benefits for Stakeholders

  • The study provides in-depth analysis of the global ADC market share along with current & future trends to illustrate the imminent investment pockets.
  • Information about key drivers, restrains, & opportunities and their impact analysis on the global ADC market size are provided in the report.
  • Porter’s five forces analysis illustrates the potency of buyers and suppliers operating in the application delivery controllers market forecast.
  • An extensive analysis of the key segments of the industry helps to understand the global application delivery controllers market trends.
  • The quantitative analysis of the global ADC market size from 2021 to 2030 is provided to determine the market potential.

Application Delivery Controllers (ADC) Market Report Highlights

Aspects Details
By Deployment Model
  • On-Premise
  • Cloud
By Enterprise Size
  • Large Enterprises
  • Small And Medium-Sized Enterprises
By End User
  • It And Telecom
  • Retail
  • Bfsi
  • Healthcare
  • Government
  • Others
By Region
  • North America  (U.S., Canada)
  • Europe  (Germany, United Kingdom, France, Italy, Rest of Europe)
  • Asia-Pacific  (China, India, Japan, Australia, Rest of Asia-Pacific)
  • LAMEA  (Latin America, Middle East, Africa)
Key Market Players Cisco Systems Inc., KEMP Technologies Inc., F5 Networks Inc., Citrix Systems Inc., Array Networks, Inc., Fortinet Inc., A10 Networks Inc., Barracuda Networks Inc., Webscale, Dell Technologies Inc.
 
  • CHAPTER 1:INTRODUCTION

    • 1.1.Report description

    • 1.2.Key market segments

    • 1.3.Key benefits to the stakeholders

    • 1.4.Research Methodology

      • 1.4.1.Secondary research

      • 1.4.2.Primary research

      • 1.4.3.Analyst tools and models

  • CHAPTER 2:EXECUTIVE SUMMARY

    • 2.1.Key findings of the study

    • 2.2.CXO Perspective

  • CHAPTER 3:MARKET OVERVIEW

    • 3.1.Market definition and scope

    • 3.2.Key findings

      • 3.2.1.Top investment pockets

    • 3.3.Porter’s five forces analysis

    • 3.4.Top player positioning

    • 3.5.Market dynamics

      • 3.5.1.Drivers

      • 3.5.2.Restraints

      • 3.5.3.Opportunities

    • 3.6.COVID-19 Impact Analysis on the market

    • 3.7.Regulatory Guidelines

    • 3.8.Patent Landscape

  • CHAPTER 4: APPLICATION DELIVERY CONTROLLERS (ADC) MARKET, BY DEPLOYMENT MODEL

    • 4.1 Overview

      • 4.1.1 Market size and forecast

    • 4.2 On-Premise

      • 4.2.1 Key market trends, growth factors and opportunities

      • 4.2.2 Market size and forecast, by region

      • 4.2.3 Market analysis by country

    • 4.3 Cloud

      • 4.3.1 Key market trends, growth factors and opportunities

      • 4.3.2 Market size and forecast, by region

      • 4.3.3 Market analysis by country

  • CHAPTER 5: APPLICATION DELIVERY CONTROLLERS (ADC) MARKET, BY ENTERPRISE SIZE

    • 5.1 Overview

      • 5.1.1 Market size and forecast

    • 5.2 Large Enterprises

      • 5.2.1 Key market trends, growth factors and opportunities

      • 5.2.2 Market size and forecast, by region

      • 5.2.3 Market analysis by country

    • 5.3 Small And Medium-Sized Enterprises

      • 5.3.1 Key market trends, growth factors and opportunities

      • 5.3.2 Market size and forecast, by region

      • 5.3.3 Market analysis by country

  • CHAPTER 6: APPLICATION DELIVERY CONTROLLERS (ADC) MARKET, BY END USER

    • 6.1 Overview

      • 6.1.1 Market size and forecast

    • 6.2 It And Telecom

      • 6.2.1 Key market trends, growth factors and opportunities

      • 6.2.2 Market size and forecast, by region

      • 6.2.3 Market analysis by country

    • 6.3 Retail

      • 6.3.1 Key market trends, growth factors and opportunities

      • 6.3.2 Market size and forecast, by region

      • 6.3.3 Market analysis by country

    • 6.4 Bfsi

      • 6.4.1 Key market trends, growth factors and opportunities

      • 6.4.2 Market size and forecast, by region

      • 6.4.3 Market analysis by country

    • 6.5 Healthcare

      • 6.5.1 Key market trends, growth factors and opportunities

      • 6.5.2 Market size and forecast, by region

      • 6.5.3 Market analysis by country

    • 6.6 Government

      • 6.6.1 Key market trends, growth factors and opportunities

      • 6.6.2 Market size and forecast, by region

      • 6.6.3 Market analysis by country

    • 6.7 Others

      • 6.7.1 Key market trends, growth factors and opportunities

      • 6.7.2 Market size and forecast, by region

      • 6.7.3 Market analysis by country

  • CHAPTER 7: APPLICATION DELIVERY CONTROLLERS (ADC) MARKET, BY REGION

    • 7.1 Overview

      • 7.1.1 Market size and forecast

    • 7.2 North America

      • 7.2.1 Key trends and opportunities

      • 7.2.2 North America Market size and forecast, by Deployment Model

      • 7.2.3 North America Market size and forecast, by Enterprise Size

      • 7.2.4 North America Market size and forecast, by End User

      • 7.2.5 North America Market size and forecast, by country

        • 7.2.5.1 U.S.
          • 7.2.5.1.1 Market size and forecast, by Deployment Model
          • 7.2.5.1.2 Market size and forecast, by Enterprise Size
          • 7.2.5.1.3 Market size and forecast, by End User
        • 7.2.5.2 Canada
          • 7.2.5.2.1 Market size and forecast, by Deployment Model
          • 7.2.5.2.2 Market size and forecast, by Enterprise Size
          • 7.2.5.2.3 Market size and forecast, by End User
    • 7.3 Europe

      • 7.3.1 Key trends and opportunities

      • 7.3.2 Europe Market size and forecast, by Deployment Model

      • 7.3.3 Europe Market size and forecast, by Enterprise Size

      • 7.3.4 Europe Market size and forecast, by End User

      • 7.3.5 Europe Market size and forecast, by country

        • 7.3.5.1 Germany
          • 7.3.5.1.1 Market size and forecast, by Deployment Model
          • 7.3.5.1.2 Market size and forecast, by Enterprise Size
          • 7.3.5.1.3 Market size and forecast, by End User
        • 7.3.5.2 United Kingdom
          • 7.3.5.2.1 Market size and forecast, by Deployment Model
          • 7.3.5.2.2 Market size and forecast, by Enterprise Size
          • 7.3.5.2.3 Market size and forecast, by End User
        • 7.3.5.3 France
          • 7.3.5.3.1 Market size and forecast, by Deployment Model
          • 7.3.5.3.2 Market size and forecast, by Enterprise Size
          • 7.3.5.3.3 Market size and forecast, by End User
        • 7.3.5.4 Italy
          • 7.3.5.4.1 Market size and forecast, by Deployment Model
          • 7.3.5.4.2 Market size and forecast, by Enterprise Size
          • 7.3.5.4.3 Market size and forecast, by End User
        • 7.3.5.5 Rest of Europe
          • 7.3.5.5.1 Market size and forecast, by Deployment Model
          • 7.3.5.5.2 Market size and forecast, by Enterprise Size
          • 7.3.5.5.3 Market size and forecast, by End User
    • 7.4 Asia-Pacific

      • 7.4.1 Key trends and opportunities

      • 7.4.2 Asia-Pacific Market size and forecast, by Deployment Model

      • 7.4.3 Asia-Pacific Market size and forecast, by Enterprise Size

      • 7.4.4 Asia-Pacific Market size and forecast, by End User

      • 7.4.5 Asia-Pacific Market size and forecast, by country

        • 7.4.5.1 China
          • 7.4.5.1.1 Market size and forecast, by Deployment Model
          • 7.4.5.1.2 Market size and forecast, by Enterprise Size
          • 7.4.5.1.3 Market size and forecast, by End User
        • 7.4.5.2 India
          • 7.4.5.2.1 Market size and forecast, by Deployment Model
          • 7.4.5.2.2 Market size and forecast, by Enterprise Size
          • 7.4.5.2.3 Market size and forecast, by End User
        • 7.4.5.3 Japan
          • 7.4.5.3.1 Market size and forecast, by Deployment Model
          • 7.4.5.3.2 Market size and forecast, by Enterprise Size
          • 7.4.5.3.3 Market size and forecast, by End User
        • 7.4.5.4 Australia
          • 7.4.5.4.1 Market size and forecast, by Deployment Model
          • 7.4.5.4.2 Market size and forecast, by Enterprise Size
          • 7.4.5.4.3 Market size and forecast, by End User
        • 7.4.5.5 Rest of Asia-Pacific
          • 7.4.5.5.1 Market size and forecast, by Deployment Model
          • 7.4.5.5.2 Market size and forecast, by Enterprise Size
          • 7.4.5.5.3 Market size and forecast, by End User
    • 7.5 LAMEA

      • 7.5.1 Key trends and opportunities

      • 7.5.2 LAMEA Market size and forecast, by Deployment Model

      • 7.5.3 LAMEA Market size and forecast, by Enterprise Size

      • 7.5.4 LAMEA Market size and forecast, by End User

      • 7.5.5 LAMEA Market size and forecast, by country

        • 7.5.5.1 Latin America
          • 7.5.5.1.1 Market size and forecast, by Deployment Model
          • 7.5.5.1.2 Market size and forecast, by Enterprise Size
          • 7.5.5.1.3 Market size and forecast, by End User
        • 7.5.5.2 Middle East
          • 7.5.5.2.1 Market size and forecast, by Deployment Model
          • 7.5.5.2.2 Market size and forecast, by Enterprise Size
          • 7.5.5.2.3 Market size and forecast, by End User
        • 7.5.5.3 Africa
          • 7.5.5.3.1 Market size and forecast, by Deployment Model
          • 7.5.5.3.2 Market size and forecast, by Enterprise Size
          • 7.5.5.3.3 Market size and forecast, by End User
  • CHAPTER 8: COMPANY LANDSCAPE

    • 8.1. Introduction

    • 8.2. Top winning strategies

    • 8.3. Product Mapping of Top 10 Player

    • 8.4. Competitive Dashboard

    • 8.5. Competitive Heatmap

    • 8.6. Key developments

  • CHAPTER 9: COMPANY PROFILES

    • 9.1 A10 Networks Inc.

      • 9.1.1 Company overview

      • 9.1.2 Company snapshot

      • 9.1.3 Operating business segments

      • 9.1.4 Product portfolio

      • 9.1.5 Business performance

      • 9.1.6 Key strategic moves and developments

    • 9.2 Citrix Systems Inc.

      • 9.2.1 Company overview

      • 9.2.2 Company snapshot

      • 9.2.3 Operating business segments

      • 9.2.4 Product portfolio

      • 9.2.5 Business performance

      • 9.2.6 Key strategic moves and developments

    • 9.3 F5 Networks Inc.

      • 9.3.1 Company overview

      • 9.3.2 Company snapshot

      • 9.3.3 Operating business segments

      • 9.3.4 Product portfolio

      • 9.3.5 Business performance

      • 9.3.6 Key strategic moves and developments

    • 9.4 Array Networks, Inc.

      • 9.4.1 Company overview

      • 9.4.2 Company snapshot

      • 9.4.3 Operating business segments

      • 9.4.4 Product portfolio

      • 9.4.5 Business performance

      • 9.4.6 Key strategic moves and developments

    • 9.5 Webscale

      • 9.5.1 Company overview

      • 9.5.2 Company snapshot

      • 9.5.3 Operating business segments

      • 9.5.4 Product portfolio

      • 9.5.5 Business performance

      • 9.5.6 Key strategic moves and developments

    • 9.6 Dell Technologies Inc.

      • 9.6.1 Company overview

      • 9.6.2 Company snapshot

      • 9.6.3 Operating business segments

      • 9.6.4 Product portfolio

      • 9.6.5 Business performance

      • 9.6.6 Key strategic moves and developments

    • 9.7 Barracuda Networks Inc.

      • 9.7.1 Company overview

      • 9.7.2 Company snapshot

      • 9.7.3 Operating business segments

      • 9.7.4 Product portfolio

      • 9.7.5 Business performance

      • 9.7.6 Key strategic moves and developments

    • 9.8 Fortinet Inc.

      • 9.8.1 Company overview

      • 9.8.2 Company snapshot

      • 9.8.3 Operating business segments

      • 9.8.4 Product portfolio

      • 9.8.5 Business performance

      • 9.8.6 Key strategic moves and developments

    • 9.9 Cisco Systems Inc.

      • 9.9.1 Company overview

      • 9.9.2 Company snapshot

      • 9.9.3 Operating business segments

      • 9.9.4 Product portfolio

      • 9.9.5 Business performance

      • 9.9.6 Key strategic moves and developments

    • 9.10 KEMP Technologies Inc.

      • 9.10.1 Company overview

      • 9.10.2 Company snapshot

      • 9.10.3 Operating business segments

      • 9.10.4 Product portfolio

      • 9.10.5 Business performance

      • 9.10.6 Key strategic moves and developments

  • LIST OF TABLES

  • TABLE 1. GLOBAL APPLICATION DELIVERY CONTROLLERS (ADC) MARKET, BY DEPLOYMENT MODEL, 2020-2030,($MILLION)
    TABLE 2. APPLICATION DELIVERY CONTROLLERS (ADC) MARKET REVENUE, FOR ON-PREMISE, BY REGION , 2020-2030,($MILLION)
    TABLE 3. APPLICATION DELIVERY CONTROLLERS (ADC) MARKET ON-PREMISE BY COUNTRY, 2020-2030,($MILLION)
    TABLE 4. APPLICATION DELIVERY CONTROLLERS (ADC) MARKET REVENUE, FOR CLOUD, BY REGION , 2020-2030,($MILLION)
    TABLE 5. APPLICATION DELIVERY CONTROLLERS (ADC) MARKET CLOUD BY COUNTRY, 2020-2030,($MILLION)
    TABLE 6. GLOBAL APPLICATION DELIVERY CONTROLLERS (ADC) MARKET, BY ENTERPRISE SIZE, 2020-2030,($MILLION)
    TABLE 7. APPLICATION DELIVERY CONTROLLERS (ADC) MARKET REVENUE, FOR LARGE ENTERPRISES, BY REGION , 2020-2030,($MILLION)
    TABLE 8. APPLICATION DELIVERY CONTROLLERS (ADC) MARKET LARGE ENTERPRISES BY COUNTRY, 2020-2030,($MILLION)
    TABLE 9. APPLICATION DELIVERY CONTROLLERS (ADC) MARKET REVENUE, FOR SMALL AND MEDIUM-SIZED ENTERPRISES, BY REGION , 2020-2030,($MILLION)
    TABLE 10. APPLICATION DELIVERY CONTROLLERS (ADC) MARKET SMALL AND MEDIUM-SIZED ENTERPRISES BY COUNTRY, 2020-2030,($MILLION)
    TABLE 11. GLOBAL APPLICATION DELIVERY CONTROLLERS (ADC) MARKET, BY END USER, 2020-2030,($MILLION)
    TABLE 12. APPLICATION DELIVERY CONTROLLERS (ADC) MARKET REVENUE, FOR IT AND TELECOM, BY REGION , 2020-2030,($MILLION)
    TABLE 13. APPLICATION DELIVERY CONTROLLERS (ADC) MARKET IT AND TELECOM BY COUNTRY, 2020-2030,($MILLION)
    TABLE 14. APPLICATION DELIVERY CONTROLLERS (ADC) MARKET REVENUE, FOR RETAIL, BY REGION , 2020-2030,($MILLION)
    TABLE 15. APPLICATION DELIVERY CONTROLLERS (ADC) MARKET RETAIL BY COUNTRY, 2020-2030,($MILLION)
    TABLE 16. APPLICATION DELIVERY CONTROLLERS (ADC) MARKET REVENUE, FOR BFSI, BY REGION , 2020-2030,($MILLION)
    TABLE 17. APPLICATION DELIVERY CONTROLLERS (ADC) MARKET BFSI BY COUNTRY, 2020-2030,($MILLION)
    TABLE 18. APPLICATION DELIVERY CONTROLLERS (ADC) MARKET REVENUE, FOR HEALTHCARE, BY REGION , 2020-2030,($MILLION)
    TABLE 19. APPLICATION DELIVERY CONTROLLERS (ADC) MARKET HEALTHCARE BY COUNTRY, 2020-2030,($MILLION)
    TABLE 20. APPLICATION DELIVERY CONTROLLERS (ADC) MARKET REVENUE, FOR GOVERNMENT, BY REGION , 2020-2030,($MILLION)
    TABLE 21. APPLICATION DELIVERY CONTROLLERS (ADC) MARKET GOVERNMENT BY COUNTRY, 2020-2030,($MILLION)
    TABLE 22. APPLICATION DELIVERY CONTROLLERS (ADC) MARKET REVENUE, FOR OTHERS, BY REGION , 2020-2030,($MILLION)
    TABLE 23. APPLICATION DELIVERY CONTROLLERS (ADC) MARKET OTHERS BY COUNTRY, 2020-2030,($MILLION)
    TABLE 24. APPLICATION DELIVERY CONTROLLERS (ADC) MARKET, BY REGION, 2020-2030,($MILLION)
    TABLE 25. NORTH AMERICA APPLICATION DELIVERY CONTROLLERS (ADC) MARKET, BY DEPLOYMENT MODEL, 2020-2030,($MILLION)
    TABLE 26. NORTH AMERICA APPLICATION DELIVERY CONTROLLERS (ADC) MARKET, BY ENTERPRISE SIZE, 2020-2030,($MILLION)
    TABLE 27. NORTH AMERICA APPLICATION DELIVERY CONTROLLERS (ADC) MARKET, BY END USER, 2020-2030,($MILLION)
    TABLE 28. NORTH AMERICA APPLICATION DELIVERY CONTROLLERS (ADC) MARKET, BY COUNTRY, 2020-2030,($MILLION)
    TABLE 29. U.S. APPLICATION DELIVERY CONTROLLERS (ADC) MARKET BY DEPLOYMENT MODEL 2020-2030,($MILLION)
    TABLE 30. U.S. APPLICATION DELIVERY CONTROLLERS (ADC) MARKET BY ENTERPRISE SIZE 2020-2030,($MILLION)
    TABLE 31. U.S. APPLICATION DELIVERY CONTROLLERS (ADC) MARKET BY END USER 2020-2030,($MILLION)
    TABLE 32. CANADA APPLICATION DELIVERY CONTROLLERS (ADC) MARKET BY DEPLOYMENT MODEL 2020-2030,($MILLION)
    TABLE 33. CANADA APPLICATION DELIVERY CONTROLLERS (ADC) MARKET BY ENTERPRISE SIZE 2020-2030,($MILLION)
    TABLE 34. CANADA APPLICATION DELIVERY CONTROLLERS (ADC) MARKET BY END USER 2020-2030,($MILLION)
    TABLE 35. EUROPE APPLICATION DELIVERY CONTROLLERS (ADC) MARKET, BY DEPLOYMENT MODEL, 2020-2030,($MILLION)
    TABLE 36. EUROPE APPLICATION DELIVERY CONTROLLERS (ADC) MARKET, BY ENTERPRISE SIZE, 2020-2030,($MILLION)
    TABLE 37. EUROPE APPLICATION DELIVERY CONTROLLERS (ADC) MARKET, BY END USER, 2020-2030,($MILLION)
    TABLE 38. EUROPE APPLICATION DELIVERY CONTROLLERS (ADC) MARKET, BY COUNTRY, 2020-2030,($MILLION)
    TABLE 39. GERMANY APPLICATION DELIVERY CONTROLLERS (ADC) MARKET BY DEPLOYMENT MODEL 2020-2030,($MILLION)
    TABLE 40. GERMANY APPLICATION DELIVERY CONTROLLERS (ADC) MARKET BY ENTERPRISE SIZE 2020-2030,($MILLION)
    TABLE 41. GERMANY APPLICATION DELIVERY CONTROLLERS (ADC) MARKET BY END USER 2020-2030,($MILLION)
    TABLE 42. UNITED KINGDOM APPLICATION DELIVERY CONTROLLERS (ADC) MARKET BY DEPLOYMENT MODEL 2020-2030,($MILLION)
    TABLE 43. UNITED KINGDOM APPLICATION DELIVERY CONTROLLERS (ADC) MARKET BY ENTERPRISE SIZE 2020-2030,($MILLION)
    TABLE 44. UNITED KINGDOM APPLICATION DELIVERY CONTROLLERS (ADC) MARKET BY END USER 2020-2030,($MILLION)
    TABLE 45. FRANCE APPLICATION DELIVERY CONTROLLERS (ADC) MARKET BY DEPLOYMENT MODEL 2020-2030,($MILLION)
    TABLE 46. FRANCE APPLICATION DELIVERY CONTROLLERS (ADC) MARKET BY ENTERPRISE SIZE 2020-2030,($MILLION)
    TABLE 47. FRANCE APPLICATION DELIVERY CONTROLLERS (ADC) MARKET BY END USER 2020-2030,($MILLION)
    TABLE 48. ITALY APPLICATION DELIVERY CONTROLLERS (ADC) MARKET BY DEPLOYMENT MODEL 2020-2030,($MILLION)
    TABLE 49. ITALY APPLICATION DELIVERY CONTROLLERS (ADC) MARKET BY ENTERPRISE SIZE 2020-2030,($MILLION)
    TABLE 50. ITALY APPLICATION DELIVERY CONTROLLERS (ADC) MARKET BY END USER 2020-2030,($MILLION)
    TABLE 51. REST OF EUROPE APPLICATION DELIVERY CONTROLLERS (ADC) MARKET BY DEPLOYMENT MODEL 2020-2030,($MILLION)
    TABLE 52. REST OF EUROPE APPLICATION DELIVERY CONTROLLERS (ADC) MARKET BY ENTERPRISE SIZE 2020-2030,($MILLION)
    TABLE 53. REST OF EUROPE APPLICATION DELIVERY CONTROLLERS (ADC) MARKET BY END USER 2020-2030,($MILLION)
    TABLE 54. ASIA-PACIFIC APPLICATION DELIVERY CONTROLLERS (ADC) MARKET, BY DEPLOYMENT MODEL, 2020-2030,($MILLION)
    TABLE 55. ASIA-PACIFIC APPLICATION DELIVERY CONTROLLERS (ADC) MARKET, BY ENTERPRISE SIZE, 2020-2030,($MILLION)
    TABLE 56. ASIA-PACIFIC APPLICATION DELIVERY CONTROLLERS (ADC) MARKET, BY END USER, 2020-2030,($MILLION)
    TABLE 57. ASIA-PACIFIC APPLICATION DELIVERY CONTROLLERS (ADC) MARKET, BY COUNTRY, 2020-2030,($MILLION)
    TABLE 58. CHINA APPLICATION DELIVERY CONTROLLERS (ADC) MARKET BY DEPLOYMENT MODEL 2020-2030,($MILLION)
    TABLE 59. CHINA APPLICATION DELIVERY CONTROLLERS (ADC) MARKET BY ENTERPRISE SIZE 2020-2030,($MILLION)
    TABLE 60. CHINA APPLICATION DELIVERY CONTROLLERS (ADC) MARKET BY END USER 2020-2030,($MILLION)
    TABLE 61. INDIA APPLICATION DELIVERY CONTROLLERS (ADC) MARKET BY DEPLOYMENT MODEL 2020-2030,($MILLION)
    TABLE 62. INDIA APPLICATION DELIVERY CONTROLLERS (ADC) MARKET BY ENTERPRISE SIZE 2020-2030,($MILLION)
    TABLE 63. INDIA APPLICATION DELIVERY CONTROLLERS (ADC) MARKET BY END USER 2020-2030,($MILLION)
    TABLE 64. JAPAN APPLICATION DELIVERY CONTROLLERS (ADC) MARKET BY DEPLOYMENT MODEL 2020-2030,($MILLION)
    TABLE 65. JAPAN APPLICATION DELIVERY CONTROLLERS (ADC) MARKET BY ENTERPRISE SIZE 2020-2030,($MILLION)
    TABLE 66. JAPAN APPLICATION DELIVERY CONTROLLERS (ADC) MARKET BY END USER 2020-2030,($MILLION)
    TABLE 67. AUSTRALIA APPLICATION DELIVERY CONTROLLERS (ADC) MARKET BY DEPLOYMENT MODEL 2020-2030,($MILLION)
    TABLE 68. AUSTRALIA APPLICATION DELIVERY CONTROLLERS (ADC) MARKET BY ENTERPRISE SIZE 2020-2030,($MILLION)
    TABLE 69. AUSTRALIA APPLICATION DELIVERY CONTROLLERS (ADC) MARKET BY END USER 2020-2030,($MILLION)
    TABLE 70. REST OF ASIA-PACIFIC APPLICATION DELIVERY CONTROLLERS (ADC) MARKET BY DEPLOYMENT MODEL 2020-2030,($MILLION)
    TABLE 71. REST OF ASIA-PACIFIC APPLICATION DELIVERY CONTROLLERS (ADC) MARKET BY ENTERPRISE SIZE 2020-2030,($MILLION)
    TABLE 72. REST OF ASIA-PACIFIC APPLICATION DELIVERY CONTROLLERS (ADC) MARKET BY END USER 2020-2030,($MILLION)
    TABLE 73. LAMEA APPLICATION DELIVERY CONTROLLERS (ADC) MARKET, BY DEPLOYMENT MODEL, 2020-2030,($MILLION)
    TABLE 74. LAMEA APPLICATION DELIVERY CONTROLLERS (ADC) MARKET, BY ENTERPRISE SIZE, 2020-2030,($MILLION)
    TABLE 75. LAMEA APPLICATION DELIVERY CONTROLLERS (ADC) MARKET, BY END USER, 2020-2030,($MILLION)
    TABLE 76. LAMEA APPLICATION DELIVERY CONTROLLERS (ADC) MARKET, BY COUNTRY, 2020-2030,($MILLION)
    TABLE 77. LATIN AMERICA APPLICATION DELIVERY CONTROLLERS (ADC) MARKET BY DEPLOYMENT MODEL 2020-2030,($MILLION)
    TABLE 78. LATIN AMERICA APPLICATION DELIVERY CONTROLLERS (ADC) MARKET BY ENTERPRISE SIZE 2020-2030,($MILLION)
    TABLE 79. LATIN AMERICA APPLICATION DELIVERY CONTROLLERS (ADC) MARKET BY END USER 2020-2030,($MILLION)
    TABLE 80. MIDDLE EAST APPLICATION DELIVERY CONTROLLERS (ADC) MARKET BY DEPLOYMENT MODEL 2020-2030,($MILLION)
    TABLE 81. MIDDLE EAST APPLICATION DELIVERY CONTROLLERS (ADC) MARKET BY ENTERPRISE SIZE 2020-2030,($MILLION)
    TABLE 82. MIDDLE EAST APPLICATION DELIVERY CONTROLLERS (ADC) MARKET BY END USER 2020-2030,($MILLION)
    TABLE 83. AFRICA APPLICATION DELIVERY CONTROLLERS (ADC) MARKET BY DEPLOYMENT MODEL 2020-2030,($MILLION)
    TABLE 84. AFRICA APPLICATION DELIVERY CONTROLLERS (ADC) MARKET BY ENTERPRISE SIZE 2020-2030,($MILLION)
    TABLE 85. AFRICA APPLICATION DELIVERY CONTROLLERS (ADC) MARKET BY END USER 2020-2030,($MILLION)
    TABLE 86.A10 NETWORKS INC.: COMPANY SNAPSHOT
    TABLE 87.A10 NETWORKS INC.: OPERATING SEGMENTS
    TABLE 88.A10 NETWORKS INC.: PRODUCT PORTFOLIO
    TABLE 89.A10 NETWORKS INC.: NET SALES,
    TABLE 90.A10 NETWORKS INC.: KEY STRATERGIES
    TABLE 91.CITRIX SYSTEMS INC.: COMPANY SNAPSHOT
    TABLE 92.CITRIX SYSTEMS INC.: OPERATING SEGMENTS
    TABLE 93.CITRIX SYSTEMS INC.: PRODUCT PORTFOLIO
    TABLE 94.CITRIX SYSTEMS INC.: NET SALES,
    TABLE 95.CITRIX SYSTEMS INC.: KEY STRATERGIES
    TABLE 96.F5 NETWORKS INC.: COMPANY SNAPSHOT
    TABLE 97.F5 NETWORKS INC.: OPERATING SEGMENTS
    TABLE 98.F5 NETWORKS INC.: PRODUCT PORTFOLIO
    TABLE 99.F5 NETWORKS INC.: NET SALES,
    TABLE 100.F5 NETWORKS INC.: KEY STRATERGIES
    TABLE 101.ARRAY NETWORKS, INC.: COMPANY SNAPSHOT
    TABLE 102.ARRAY NETWORKS, INC.: OPERATING SEGMENTS
    TABLE 103.ARRAY NETWORKS, INC.: PRODUCT PORTFOLIO
    TABLE 104.ARRAY NETWORKS, INC.: NET SALES,
    TABLE 105.ARRAY NETWORKS, INC.: KEY STRATERGIES
    TABLE 106.WEBSCALE: COMPANY SNAPSHOT
    TABLE 107.WEBSCALE: OPERATING SEGMENTS
    TABLE 108.WEBSCALE: PRODUCT PORTFOLIO
    TABLE 109.WEBSCALE: NET SALES,
    TABLE 110.WEBSCALE: KEY STRATERGIES
    TABLE 111.DELL TECHNOLOGIES INC.: COMPANY SNAPSHOT
    TABLE 112.DELL TECHNOLOGIES INC.: OPERATING SEGMENTS
    TABLE 113.DELL TECHNOLOGIES INC.: PRODUCT PORTFOLIO
    TABLE 114.DELL TECHNOLOGIES INC.: NET SALES,
    TABLE 115.DELL TECHNOLOGIES INC.: KEY STRATERGIES
    TABLE 116.BARRACUDA NETWORKS INC.: COMPANY SNAPSHOT
    TABLE 117.BARRACUDA NETWORKS INC.: OPERATING SEGMENTS
    TABLE 118.BARRACUDA NETWORKS INC.: PRODUCT PORTFOLIO
    TABLE 119.BARRACUDA NETWORKS INC.: NET SALES,
    TABLE 120.BARRACUDA NETWORKS INC.: KEY STRATERGIES
    TABLE 121.FORTINET INC.: COMPANY SNAPSHOT
    TABLE 122.FORTINET INC.: OPERATING SEGMENTS
    TABLE 123.FORTINET INC.: PRODUCT PORTFOLIO
    TABLE 124.FORTINET INC.: NET SALES,
    TABLE 125.FORTINET INC.: KEY STRATERGIES
    TABLE 126.CISCO SYSTEMS INC.: COMPANY SNAPSHOT
    TABLE 127.CISCO SYSTEMS INC.: OPERATING SEGMENTS
    TABLE 128.CISCO SYSTEMS INC.: PRODUCT PORTFOLIO
    TABLE 129.CISCO SYSTEMS INC.: NET SALES,
    TABLE 130.CISCO SYSTEMS INC.: KEY STRATERGIES
    TABLE 131.KEMP TECHNOLOGIES INC.: COMPANY SNAPSHOT
    TABLE 132.KEMP TECHNOLOGIES INC.: OPERATING SEGMENTS
    TABLE 133.KEMP TECHNOLOGIES INC.: PRODUCT PORTFOLIO
    TABLE 134.KEMP TECHNOLOGIES INC.: NET SALES,
    TABLE 135.KEMP TECHNOLOGIES INC.: KEY STRATERGIES
  • LIST OF FIGURES

  • FIGURE 1.APPLICATION DELIVERY CONTROLLERS (ADC) MARKET SEGMENTATION
    FIGURE 2.APPLICATION DELIVERY CONTROLLERS (ADC) MARKET,2020-2030
    FIGURE 3.APPLICATION DELIVERY CONTROLLERS (ADC) MARKET,2020-2030
    FIGURE 4. TOP INVESTMENT POCKETS, BY REGION
    FIGURE 5.PORTER FIVE-1
    FIGURE 6.PORTER FIVE-2
    FIGURE 7.PORTER FIVE-3
    FIGURE 8.PORTER FIVE-4
    FIGURE 9.PORTER FIVE-5
    FIGURE 10.TOP PLAYER POSITIONING
    FIGURE 11.APPLICATION DELIVERY CONTROLLERS (ADC) MARKET:DRIVERS, RESTRAINTS AND OPPORTUNITIES
    FIGURE 13.PATENT ANALYSIS BY COMPANY
    FIGURE 14.PATENT ANALYSIS BY COUNTRY
    FIGURE 14.APPLICATION DELIVERY CONTROLLERS (ADC) MARKET,BY DEPLOYMENT MODEL,2020(%)
    FIGURE 15.COMPARATIVE SHARE ANALYSIS OF ON-PREMISE APPLICATION DELIVERY CONTROLLERS (ADC) MARKET,2020-2030(%)
    FIGURE 16.COMPARATIVE SHARE ANALYSIS OF CLOUD APPLICATION DELIVERY CONTROLLERS (ADC) MARKET,2020-2030(%)
    FIGURE 17.APPLICATION DELIVERY CONTROLLERS (ADC) MARKET,BY ENTERPRISE SIZE,2020(%)
    FIGURE 18.COMPARATIVE SHARE ANALYSIS OF LARGE ENTERPRISES APPLICATION DELIVERY CONTROLLERS (ADC) MARKET,2020-2030(%)
    FIGURE 19.COMPARATIVE SHARE ANALYSIS OF SMALL AND MEDIUM-SIZED ENTERPRISES APPLICATION DELIVERY CONTROLLERS (ADC) MARKET,2020-2030(%)
    FIGURE 20.APPLICATION DELIVERY CONTROLLERS (ADC) MARKET,BY END USER,2020(%)
    FIGURE 21.COMPARATIVE SHARE ANALYSIS OF IT AND TELECOM APPLICATION DELIVERY CONTROLLERS (ADC) MARKET,2020-2030(%)
    FIGURE 22.COMPARATIVE SHARE ANALYSIS OF RETAIL APPLICATION DELIVERY CONTROLLERS (ADC) MARKET,2020-2030(%)
    FIGURE 23.COMPARATIVE SHARE ANALYSIS OF BFSI APPLICATION DELIVERY CONTROLLERS (ADC) MARKET,2020-2030(%)
    FIGURE 24.COMPARATIVE SHARE ANALYSIS OF HEALTHCARE APPLICATION DELIVERY CONTROLLERS (ADC) MARKET,2020-2030(%)
    FIGURE 25.COMPARATIVE SHARE ANALYSIS OF GOVERNMENT APPLICATION DELIVERY CONTROLLERS (ADC) MARKET,2020-2030(%)
    FIGURE 26.COMPARATIVE SHARE ANALYSIS OF OTHERS APPLICATION DELIVERY CONTROLLERS (ADC) MARKET,2020-2030(%)
    FIGURE 27.APPLICATION DELIVERY CONTROLLERS (ADC) MARKET BY REGION,2020
    FIGURE 28.U.S. APPLICATION DELIVERY CONTROLLERS (ADC) MARKET,2020-2030($MILLION)
    FIGURE 29.CANADA APPLICATION DELIVERY CONTROLLERS (ADC) MARKET,2020-2030($MILLION)
    FIGURE 30.GERMANY APPLICATION DELIVERY CONTROLLERS (ADC) MARKET,2020-2030($MILLION)
    FIGURE 31.UNITED KINGDOM APPLICATION DELIVERY CONTROLLERS (ADC) MARKET,2020-2030($MILLION)
    FIGURE 32.FRANCE APPLICATION DELIVERY CONTROLLERS (ADC) MARKET,2020-2030($MILLION)
    FIGURE 33.ITALY APPLICATION DELIVERY CONTROLLERS (ADC) MARKET,2020-2030($MILLION)
    FIGURE 34.REST OF EUROPE APPLICATION DELIVERY CONTROLLERS (ADC) MARKET,2020-2030($MILLION)
    FIGURE 35.CHINA APPLICATION DELIVERY CONTROLLERS (ADC) MARKET,2020-2030($MILLION)
    FIGURE 36.INDIA APPLICATION DELIVERY CONTROLLERS (ADC) MARKET,2020-2030($MILLION)
    FIGURE 37.JAPAN APPLICATION DELIVERY CONTROLLERS (ADC) MARKET,2020-2030($MILLION)
    FIGURE 38.AUSTRALIA APPLICATION DELIVERY CONTROLLERS (ADC) MARKET,2020-2030($MILLION)
    FIGURE 39.REST OF ASIA-PACIFIC APPLICATION DELIVERY CONTROLLERS (ADC) MARKET,2020-2030($MILLION)
    FIGURE 40.LATIN AMERICA APPLICATION DELIVERY CONTROLLERS (ADC) MARKET,2020-2030($MILLION)
    FIGURE 41.MIDDLE EAST APPLICATION DELIVERY CONTROLLERS (ADC) MARKET,2020-2030($MILLION)
    FIGURE 42.AFRICA APPLICATION DELIVERY CONTROLLERS (ADC) MARKET,2020-2030($MILLION)
    FIGURE 43. TOP WINNING STRATEGIES, BY YEAR
    FIGURE 44. TOP WINNING STRATEGIES, BY DEVELOPMENT
    FIGURE 45. TOP WINNING STRATEGIES, BY COMPANY
    FIGURE 46.PRODUCT MAPPING OF TOP 10 PLAYERS
    FIGURE 47.COMPETITIVE DASHBOARD
    FIGURE 48.COMPETITIVE HEATMAP OF TOP 10 KEY PLAYERS
    FIGURE 49.A10 NETWORKS INC..: NET SALES ,($MILLION)
    FIGURE 50.CITRIX SYSTEMS INC..: NET SALES ,($MILLION)
    FIGURE 51.F5 NETWORKS INC..: NET SALES ,($MILLION)
    FIGURE 52.ARRAY NETWORKS, INC..: NET SALES ,($MILLION)
    FIGURE 53.WEBSCALE.: NET SALES ,($MILLION)
    FIGURE 54.DELL TECHNOLOGIES INC..: NET SALES ,($MILLION)
    FIGURE 55.BARRACUDA NETWORKS INC..: NET SALES ,($MILLION)
    FIGURE 56.FORTINET INC..: NET SALES ,($MILLION)
    FIGURE 57.CISCO SYSTEMS INC..: NET SALES ,($MILLION)
    FIGURE 58.KEMP TECHNOLOGIES INC..: NET SALES ,($MILLION)


Increase in the installation of application delivery controllers (ADCs) is observed, owing to growth in data generation and complexities associated with network management. The market is estimated to depict a significant growth during the forecast period, due to increase in usage of wireless systems in various sectors, urbanization, and rise in adaptation of various networking devices significantly in developing counties such as India and China. Technical advancement across organizations, increase in trend of cloud computing services, Internet of Things(IoT), mobility services, and efficient management of big data encourage organizations for adoption of ADCs. End user implementing ADCs include IT, consumer goods & retail, BFSI, telecom, defense, and healthcare. IT & telecom industries segment are the major consumers of ADCs, owing to the increase in networking among companies, generation of huge amount of data, and cloud services.

Regional government initiatives, mainly in Asia-Pacific, encourage the small and medium enterprises and other users for digitization, which, in turn, supports the growth of the ADC market. Some of the key players profiled in the report include A10 Networks Inc., Citrix Systems Inc., F5 Networks Inc., Array Networks, Inc., Webscale, Dell Inc., Barracuda Networks Inc., Fortinet Inc., Cisco Systems Inc., and KEMP Technologies Inc. These players have adopted various strategies to increase their market penetration and strengthen their position in the industry.

PURCHASE OPTIONS

Call or Email us

U.S.-Canada Toll-free: +1-800-792-5285
Int'l : +1-503-894-6022
Europe : +44-845-528-1300
Email : help@alliedmarketresearch.com
 
FREQUENTLY ASKED QUESTIONS?

A. The demand for ADCs is driven by the emerging need for uninterrupted online communication system among the diversified business operations and increase in cyber-threats in business units, which leads to increase in internet traffic

A. The end-user industries shift toward cloud networking. The IT & telecom sector segment is expected to grow at a notable rate during the application delivery controllers market forecast. The demand for the ADCs from developing countries, due to high internet penetration.

A. North America accounted for the highest ADC market share in 2020, and is expected to maintain its dominance throughout the forecast period, owing to existence of well-developed IT and various end-user industries.

A. The global ADC market size was valued at $2,300.00 million in 2020, and is projected to reach $12,845.02 million by 2030, growing at a CAGR of 19.1% from 2021 to 2030.

A. Citrix Systems Inc., F5 Networks Inc., Fortinet Inc., and Cisco Systems Inc., hold the major share in the market and these players have adopted various strategies to increase their market penetration and strengthen their position in the application delivery controllers industry.

Looking for Customization?

 Customization Request

Have a Question?

 Speak with Analyst

Any Confusion?

 Inquire Before Buying

Have a glance of the Report

  Request Sample
RELATED TAGS

Purchase Full Report of
Application Delivery Controllers (adc) Market

Start reading instantly.
This Report and over 67,068+ more Reports, Available with Avenue Library. T&C*.

  • Online Only
  • $3,456
  • Online cloud access only
  • Restricted print, copy, paste & download
  • Read only
  • Free industry update
    (Within 180 days)
  • Free report update in next update cycle
    (Mar 2023 - Mar 2024)
  • Data Pack
  • $3,840
  • Restricted to one authorized user
  • One print only
  • Available in
    Excel
  • Free industry update
    (Within 180 days)
  •   Free report update in next update cycle
    (Mar 2023 - Mar 2024)
  • Single User
  • $5,769
  • Restricted to one authorized user
  • One print only
  • Available in
    PDF
  • Free industry update
    (Within 180 days)
  •   Free report update in next update cycle
    (Mar 2023 - Mar 2024)
  • Five Users
  • $6,450
  • Limited to five authorized users
  • Print upto five copies
  • Available in
    PDF
  • Free industry update
    (Within 180 days)
  •   Free report update in next update cycle
    (Mar 2023 - Mar 2024)
  • Enterprise
    License/PDF

  • $10,995
  • Unlimited
    within
    company/enterprise
  • Available in Excel & PDF
  • Free industry update
    (Within 180 days)
  •   Free report update in next update cycle
    (Mar 2023 - Mar 2024)
  • Library
    Membership

  • $999 $ 1,175
    Per User/ Per month/ Billed annually
  • Published Content
    E-access
  • Company Profiles
    E-access
  • Newly Added Content Access
  • 10 PDF
    Downloads
  • 5 Excel Data
    Pack Downloads
  • 250 Company Profiles PDF Downloads
  • Buy Now

*Taxes/Fees, if applicable will be added during checkout. All prices in USD

RELATED REPORTS
 

Why Allied Market Research?


Infallible Methodology

To ensure high-level data integrity, accurate analysis, and impeccable forecasts

Analyst Support

For complete satisfaction

Customization

On-demand customization of scope of the report to exactly meet your needs

TARGETED MARKET VIEW

Targeted market view to provide pertinent information and save time of readers

Get fresh content delivered

Get insights on topics that are crucial for your business. Stay abreast of your interest areas.

Get Industry Data Alerts

Why Allied Market Research?

Infallible Methodology

To ensure high-level data integrity, accurate analysis, and impeccable forecasts

Analyst Support

For complete satisfaction

Customization

On-demand customization of scope of the report to exactly meet your needs

TARGETED MARKET VIEW

Targeted market view to provide pertinent information and save time of readers