0
2019
Aroma Ingredients Market

Aroma Ingredients Market

by Type (Synthetic Ingredients and Natural Ingredients) and Application (Homecare, Personal Care, Fine Fragrances, and Perfumes, Others): Global Opportunity Analysis and Industry Forecast, 2019-2026

Report Code: A05276
Aug 2019 | Pages: 232
Tables: 115
Charts: 75
  • Formats*:

  • pdf

    Single User License, Five User
    License & Enterprise User License

  • xls

    Data Pack Excel License

  • ppt

    It comes with the additional cost
    of $2500.00 contact sales.


COVID-19

Pandemic disrupted the entire world and affected many industries.

Get detailed COVID-19 impact analysis on the Aroma Ingredients Market

Request Now !

Aroma Ingredients Market Outlook - 2026

The global aroma ingredients market size was valued at $11,391.0 million in 2018, and is expected to grow at a CAGR of 4.6% to reach $16,252.4 million by 2026. Aroma ingredients are complex compounds that are added to cosmetics and personal care & home care products to impart desired fragrance. Natural aroma ingredients include flower, fruit, wood, and spice, while synthetic aroma ingredients are produced from chemical compounds such as esters, aldehydes, alcohols, musk chemicals, and terpenes. 

Increase in applications of aroma ingredients in cosmetic & personal care industry is the key factor that has driven the growth of global aroma ingredients market. For instance, they are widely used in creams, body lotions, shampoos, hair oils, deodorants, and perfumes. Apart from soaps & detergents and cosmetics, aroma ingredients are majorly used in fine fragrances and household products. Thus, upsurge in demand for personal care & cosmetics products among consumers is driving the growth of market. In addition, rise in disposable income, increase in awareness for personal care & hygiene, and introduction of innovative products to cater to changing consumer demands & preferences are the other factors that are responsible for aroma ingredients market growth. Moreover, consumers have shifted their preference toward natural & bio-based products, due to rise in awareness about the harmful effects of synthetic chemicals. This growing preference for natural ingredients is one of the key trends positively impacting the growth of the market. However, high cost of production for natural & bio-based products hampers the growth of the market. In addition, stringent regulations related to the use of synthetic chemicals restrict the growth of the market. On the contrary, continuous technological advancements in cosmetics and personal care industry and strong innovations and investments in R&D are expected to provide lucrative opportunities for aroma ingredients market expansion.

Global Aroma Ingredients Market

The global aroma ingredients market is segmented based on type, application, and region. Depending on type, the aroma ingredients market is categorized into synthetic ingredients and natural ingredients. The applications covered in the study include homecare, personal care, fine fragrances and perfumes, others. Region wise, the market is analyzed across North America, Europe, Asia-Pacific, and LAMEA.

Global Aroma Ingredients Market By Type


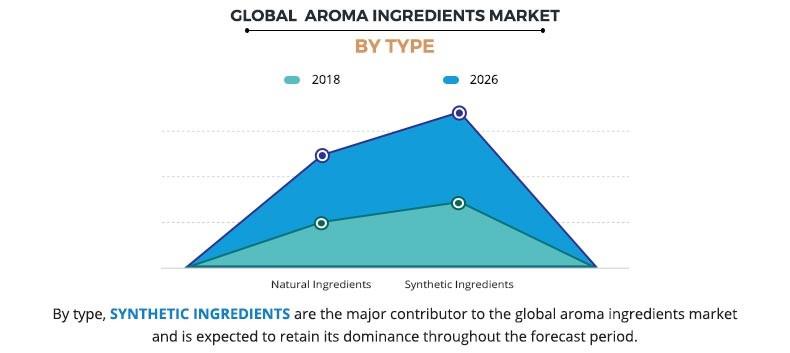
In 2018, the natural aroma ingredients segment accounted for $4,683.4 million, and is estimated to reach $6,993.1 million by 2026, at a CAGR of 5.2% during the forecast period. This is attributed to increase in customer tendency for natural & bio-based personal care & cosmetic products. The concerns related to harsh nature of chemicals such as allergies and others have enforced consumer to switch to natural products. However, upsurge in demand for homecare & personal care products such as detergents, deodorizers, aerosol sprays, room fresheners, vehicle deodorizers, floor cleaners, and others is expected to drive the growth for synthetic aroma ingredients. The homecare and personal care segments collectively accounted for about 73.7% aroma ingredients market share of the market in 2018, with the former constituting around 48.9% share.

Global Aroma Ingredients Market By Application

By application, the home care segment accounted for $5,575.7 million, and is estimated to reach $7,851.1 million by 2026, at a CAGR of 4.4% during the forecast period. Rise in healthcare awareness and increase in disposable income have boosted the demand for essential consumer products such as soaps, detergents, hand wash, sanitizers, and toiletries. Thus, the development of the personal care and home care industry majorly contributes toward the growth of the aroma ingredients market.

Global Aroma Ingredients Market By Region

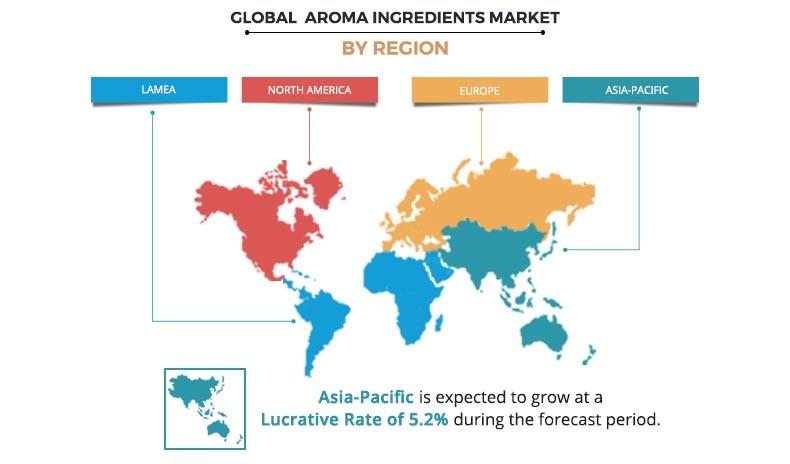
Region wise, Europe is estimated to grow at steady CAGR of 4.0% during forecast period. However, Asia-Pacific and LAMEA are anticipated to witness relatively faster growth in terms of both value and volume. This is attributed to the presence of huge consumer base, low cost & availability of raw materials, and rapid development of end-user industries such as personal care & home care industry. 
The leading players operating in the aroma ingredients market are BASF SE, Firmenich SA, Givaudan, International Flavors & Fragrances Inc. (IFF), Robertet SA, S H Kelkar and Company Limited., Sensient Technologies Corporation, Symrise, T. Hasegawa Co., Ltd., and Takasago International Corporation.

Key Benefits for Aroma Ingredients Market:

  • The report provides a quantitative analysis of the aroma ingredients market trends, estimations, and dynamics of the market size from 2018 to 2026 to identify the prevailing market opportunities.
  • The key countries in all the major regions are mapped based on their market share.
  • Porter’s five forces analysis highlights the potency of buyers and suppliers to enable stakeholders to make profit-oriented business decisions and strengthen their network.
  • In-depth analysis and the aroma ingredients market size and segmentation assists in determining the prevailing market opportunities.
  • Major countries in each region are mapped according to their revenue contribution to the global aroma ingredients industry. 
  • Market player positioning segment facilitates benchmarking and provides a clear understanding of the present position of market players.
  • The report includes revenue generated from the sales of aroma ingredients and aroma ingredients market forecast across North America, Europe, Asia-Pacific, and LAMEA.
  • The report includes the aroma ingredients market analysis at regional as well as the global level, key players, market segments, application areas, and growth strategies.

Aroma Ingredients Market Report Highlights

Aspects Details
By Type
  • Natural Ingredients
  • Synthetic Ingredients
By APPLICATION
  • Homecare
  • Personal Care
  • Fine Fragrances and Perfumes
  • Others
By Region
  • North America  (U.S, Canada, Mexico)
  • Europe  (UK, Germany, France, Italy, Spain, Rest of Europe)
  • Asia-Pacific  (China, Japan, India, South Korea, Australia, Rest of Asia-Pacific)
  • LAMEA  (Brazil, Saudi Arabia, South Africa, Rest of LAMEA)
Key Market Players Symrise AG, Givaudan International SA, Robertet SA, Sensient Technologies Corporation, Takasago International Corporation, Firmenich SA, International Flavors & Fragrances Inc, S H Kelkar and Company Limited, T. HASEGAWA CO., LTD, BASF SE (BASF)
 

CHAPTER 1:    INTRODUCTION

1.1.    Report Description
1.2.    Key Benefits for Stakeholders
1.3.    Key Market Segments
1.4.    Research Methodology

1.4.1.    Primary Research
1.4.2.    Secondary Research
1.4.3.    Analyst Tools and Models

CHAPTER 2:    EXECUTIVE SUMMARY

2.1.    Key findings of the study
2.2.    CXO perspective

CHAPTER 3:    MARKET OVERVIEW

3.1.    Market definition and scope
3.2.    Key findings

3.2.1.    Top investment pocket
3.2.2.    Top winning strategies

3.3.    Porter's five forces analysis

3.3.1.    Bargaining power of suppliers
3.3.2.    Bargaining power of buyers
3.3.3.    Threat of substitution
3.3.4.    Threat of new entrants
3.3.5.    Intensity of competitive rivalry

3.5.    Market dynamics

3.5.1.    Drivers

3.5.1.1.    Growing demand for consumer care and personal care products
3.5.1.2.    Increasing consumer inclination towards therapeutic uses of aroma ingredients

3.5.2.    Restraint

3.5.2.1.    Strict government regulation related to the use of aroma ingredients
3.5.2.2.    High price & short shelf life of natural aroma ingredients
3.5.2.3.    Harmful effects of synthetic aroma ingredients

3.5.3.    Opportunities

3.5.3.1.    Product innovations by the perfumery industry and cosmetics manufacturers
3.5.3.2.    Increasing consumer preferences for natural and bio-based aroma ingredients

CHAPTER 4:    GLOBAL AROMA INGREDIENTS MARKET, BY TYPE

4.1.    Overview

4.1.1.    Market size and forecast

4.2.    Natural Ingredients

4.2.1.    Key market trends, growth factors, and opportunities
4.2.2.    Market size and forecast
4.2.4.    Market analysis by country

4.3.    Synthetic Ingredients

4.3.1.    Key market trends, growth factors, and opportunities
4.3.2.    Market size and forecast
4.3.3.    Market analysis by country

CHAPTER 5:    GLOBAL AROMA INGREDIENTS MARKET, BY APPLICATION

5.1.    Overview

5.1.1.    Market size and forecast

5.2.    Homecare

5.2.1.    Key market trends, growth factors, and opportunities
5.2.2.    Market size and forecast
5.2.3.    Market analysis by country

5.3.    Personal care

5.3.1.    Key market trends, growth factors, and opportunities
5.3.2.    Market size and forecast
5.3.3.    Market analysis by country

5.4.    Fine Fragrances & Perfumes

5.4.1.    Key market trends, growth factors, and opportunities
5.4.2.    Market size and forecast
5.4.3.    Market analysis by country

5.5.    Others

5.5.1.    Key market trends, growth factors, and opportunities
5.5.2.    Market size and forecast
5.5.3.    Market analysis by country

CHAPTER 6:    GLOBAL  AROMA INGREDIENTS  MARKET, BY REGION

6.1.    Overview

6.1.1.    Market size and forecast

6.2.    North America

6.2.1.    Key market trends, growth factors and opportunities
6.2.2.    Market size and forecast by type
6.2.3.    Market size and forecast by application
6.2.4.    Market size and forecast by country
6.2.5.    U.S.

6.2.5.1.    Market size and forecast, by type
6.2.5.2.    Market size and forecast, by application

6.2.6.    Canada

6.2.6.1.    Market size and forecast, by type
6.2.6.2.    Market size and forecast, by application

6.2.7.    Mexico

6.2.7.1.    Market size and forecast, by type
6.2.7.2.    Market size and forecast, by application

6.3.    Europe

6.3.1.    Key market trends, growth factors and opportunities
6.3.2.    Market size and forecast by type
6.3.3.    Market size and forecast by application
6.3.4.    Market size and forecast by country
6.3.5.    UK

6.3.5.1.    Market size and forecast, by type
6.3.5.2.    Market size and forecast, by application

6.3.6.    Germany

6.3.6.1.    Market size and forecast, by type
6.3.6.2.    Market size and forecast, by application

6.3.7.    France

6.3.7.1.    Market size and forecast, by type
6.3.7.2.    Market size and forecast, by application

6.3.8.    Italy

6.3.8.1.    Market size and forecast, by type
6.3.8.2.    Market size and forecast, by application

6.3.9.    Spain

6.3.9.1.    Market size and forecast, by type
6.3.9.2.    Market size and forecast, by application

6.3.10.    Rest of Europe

6.3.10.1.    Market size and forecast, by type
6.3.10.2.    Market size and forecast, by application

6.4.    Asia-Pacific

6.4.1.    Key market trends, growth factors and opportunities
6.4.2.    Market size and forecast by type
6.4.3.    Market size and forecast by application
6.4.4.    Market size and forecast by country
6.4.5.    China

6.4.5.1.    Market size and forecast, by type
6.4.5.2.    Market size and forecast, by application

6.4.6.    Japan

6.4.6.1.    Market size and forecast, by type
6.4.6.2.    Market size and forecast, by application

6.4.7.    India

6.4.7.1.    Market size and forecast, by type
6.4.7.2.    Market size and forecast, by application

6.4.8.    South Korea

6.4.8.1.    Market size and forecast, by type
6.4.8.2.    Market size and forecast, by application

6.4.9.    Australia

6.4.9.1.    Market size and forecast, by type
6.4.9.2.    Market size and forecast, by application

6.4.10.    Rest of Asia-Pacific

6.4.10.1.    Market size and forecast, by type
6.4.10.2.    Market size and forecast, by application

6.5.    LAMEA

6.5.1.    Key market trends, growth factors and opportunities
6.5.2.    Market size and forecast by type
6.5.3.    Market size and forecast by application
6.5.4.    Market size and forecast by country
6.5.5.    Brazil

6.5.5.1.    Market size and forecast, by type
6.5.5.2.    Market size and forecast, by application

6.5.6.    Saudi Arabia

6.5.6.1.    Market size and forecast, by type
6.5.6.2.    Market size and forecast, by application

6.5.7.    South Africa

6.5.7.1.    Market size and forecast, by type
6.5.7.2.    Market size and forecast, by application

6.5.8.    Rest of LAMEA

6.5.8.1.    Market size and forecast, by type
6.5.8.2.    Market size and forecast, by application

CHAPTER 7:    COMPETITIVE LANDSCAPE

7.1.    Top winning strategies
7.2.    Product Mapping
7.3.    Competitive Dashboard
7.4.    Competitive Heatmap
7.5.    Key developments

7.5.1.    Acquisition
7.5.2.    Business Expansion
7.5.3.    Collaboration
7.5.4.    Merger
7.5.5.    Partnership
7.5.6.    Product Launch

CHAPTER 8:    COMPANY PROFILES

8.1.    BASF SE (BASF)

8.1.1.    Company overview
8.1.2.    Key Executive
8.1.3.    Company snapshot
8.1.4.    Operating business segments
8.1.5.    Product portfolio
8.1.6.    R&D Expenditure
8.1.7.    Business performance
8.1.8.    Key strategic moves and developments

8.2.    Firmenich SA

8.2.1.    Company overview
8.2.2.    Key Executive
8.2.3.    Company snapshot
8.2.4.    Operating business segments
8.2.5.    Product portfolio
8.2.6.    Business performance
8.2.7.    Key strategic moves and developments

8.3.    Givaudan International SA

8.3.1.    Company overview
8.3.2.    Key Executive
8.3.3.    Company snapshot
8.3.4.    Operating business segments
8.3.5.    Product portfolio
8.3.6.    R&D Expenditure
8.3.7.    Business performance
8.3.8.    Key strategic moves and developments

8.4.    International Flavors & Fragrances Inc.

8.4.1.    Company overview
8.4.2.    Key Executive
8.4.3.    Company snapshot
8.4.4.    Operating business segments
8.4.5.    Product portfolio
8.4.6.    R&D Expenditure
8.4.7.    Business performance
8.4.8.    Key strategic moves and developments

8.5.    Robertet SA

8.5.1.    Company overview
8.5.2.    Key Executive
8.5.3.    Company snapshot
8.5.4.    Operating business segments
8.5.5.    Product portfolio
8.5.6.    Business performance

8.6.    S H Kelkar and Company Limited.

8.6.1.    Company overview
8.6.2.    Key Executive
8.6.3.    Company snapshot
8.6.4.    Operating business segments
8.6.5.    Product portfolio
8.6.6.    R&D Expenditure
8.6.7.    Business performance
8.6.8.    Key strategic moves and developments

8.7.    Sensient Technologies Corporation

8.7.1.    Company overview
8.7.2.    Key Executive
8.7.3.    Company snapshot
8.7.4.    Operating business segments
8.7.5.    Product portfolio
8.7.6.    R&D Expenditure
8.7.7.    Business performance
8.7.8.    Key strategic moves and developments

8.8.    Symrise AG

8.8.1.    Company overview
8.8.2.    Key Executive
8.8.3.    Company snapshot
8.8.4.    Operating business segments
8.8.5.    Product portfolio
8.8.6.    R&D Expenditure
8.8.7.    Business performance
8.8.8.    Key strategic moves and developments

8.9.    T. HASEGAWA CO., LTD.

8.9.1.    Company overview
8.9.2.    Key Executive
8.9.3.    Company snapshot
8.9.4.    Operating business segments
8.9.5.    Product portfolio
8.9.6.    Business performance

8.10.    Takasago International Corporation

8.10.1.    Company overview
8.10.2.    Key Executive
8.10.3.    Company snapshot
8.10.4.    Operating business segments
8.10.5.    Product portfolio
8.10.6.    Business performance
8.10.7.    Key strategic moves and developments

LIST OF TABLES

TABLE 01.    GLOBAL AROMA INGREDIENTS MARKET, BY TYPE, 2018–2026 ($MILLION)
TABLE 02.    NATURAL AROMA INGREDIENTS MARKET, BY REGION, 2018–2026 ($MILLION)
TABLE 03.    SYNTHETIC AROMA INGREDIENTS MARKET, BY REGION, 2018–2026 ($MILLION)
TABLE 04.    GLOBAL AROMA INGREDIENTS  MARKET, BY APPLICATION, 2018–2026 ($MILLION)
TABLE 05.    AROMA INGREDIENTS MARKET FOR HOMECARE, BY REGION, 2018–2026 ($MILLION)
TABLE 06.    AROMA INGREDIENTS MARKET FOR PERSONAL CARE, BY REGION, 2018–2026 ($MILLION)
TABLE 07.    AROMA INGREDIENTS MARKET FOR FINE FRAGRANCES & PERFUMES, BY REGION, 2018–2026 ($MILLION)
TABLE 08.    AROMA INGREDIENTS MARKET FOR OTHER APPLICATIONS, BY REGION, 2018–2026 ($MILLION)
TABLE 09.    GLOBAL AROMA INGREDIENTS MARKET, BY REGION, 2018–2026 ($MILLION)
TABLE 10.    NORTH AMERICA AROMA INGREDIENTS MARKET, BY TYPE , 2018–2026($MILLION)
TABLE 11.    NORTH AMERICA AROMA INGREDIENTS MARKET, BY APPLICATION, 2018–2026 ($MILLION)
TABLE 12.    NORTH AMERICA AROMA INGREDIENTS MARKET, BY COUNTRY, 2018–2026 ($MILLION)
TABLE 13.    U.S. AROMA INGREDIENTS MARKET, BY TYPE , 2018–2026 ($MILLION)
TABLE 14.    U.S.  AROMA INGREDIENTS MARKET, BY APPLICATION, 2018–2026 ($MILLION)
TABLE 15.    CANADA AROMA INGREDIENTS MARKET, BY TYPE , 2018–2026 ($MILLION)
TABLE 16.    CANADA AROMA INGREDIENTS MARKET, BY APPLICATION, 2018–2026 ($MILLION)
TABLE 17.    MEXICO AROMA INGREDIENTS MARKET, BY TYPE, 2018–2026 ($MILLION)
TABLE 18.    MEXICO AROMA INGREDIENTS MARKET, BY APPLICATION, 2018–2026 ($MILLION)
TABLE 19.    EUROPE AROMA INGREDIENTS MARKET, BY TYPE , 2018–2026($MILLION)
TABLE 20.    EUROPE AROMA INGREDIENTS MARKET, BY APPLICATION, 2018–2026 ($MILLION)
TABLE 21.    EUROPE AROMA INGREDIENTS MARKET, BY COUNTRY, 2018–2026 ($MILLION)
TABLE 22.    UK AROMA INGREDIENTS MARKET, BY TYPE , 2018–2026 ($MILLION)
TABLE 23.    UK AROMA INGREDIENTS MARKET, BY APPLICATION, 2018–2026 ($MILLION)
TABLE 24.    GERMANY AROMA INGREDIENTS MARKET, BY TYPE , 2018–2026 ($MILLION)
TABLE 25.    GERMANY AROMA INGREDIENTS MARKET, BY APPLICATION, 2018–2026 ($MILLION)
TABLE 26.    FRANCE AROMA INGREDIENTS MARKET, BY TYPE, 2018–2026 ($MILLION)
TABLE 27.    FRANCE AROMA INGREDIENTS MARKET, BY APPLICATION, 2018–2026 ($MILLION)
TABLE 28.    ITALY AROMA INGREDIENTS MARKET, BY TYPE , 2018–2026 ($MILLION)
TABLE 29.    ITALY AROMA INGREDIENTS MARKET, BY APPLICATION, 2018–2026 ($MILLION)
TABLE 30.    SPAIN AROMA INGREDIENTS MARKET, BY TYPE , 2018–2026 ($MILLION)
TABLE 31.    SPAIN AROMA INGREDIENTS MARKET, BY APPLICATION, 2018–2026 ($MILLION)
TABLE 32.    REST OF EUROPE AROMA INGREDIENTS MARKET, BY TYPE, 2018–2026 ($MILLION)
TABLE 33.    REST OF EUROPE AROMA INGREDIENTS MARKET, BY APPLICATION, 2018–2026 ($MILLION)
TABLE 34.    ASIA-PACIFIC AROMA INGREDIENTS MARKET, BY TYPE , 2018–2026($MILLION)
TABLE 35.    ASIA-PACIFIC AROMA INGREDIENTS MARKET, BY APPLICATION, 2018–2026 ($MILLION)
TABLE 36.    ASIA-PACIFIC AROMA INGREDIENTS MARKET, BY COUNTRY, 2018–2026 ($MILLION)
TABLE 37.    CHINA AROMA INGREDIENTS MARKET, BY TYPE , 2018–2026 ($MILLION)
TABLE 38.    CHINA  AROMA INGREDIENTS MARKET, BY APPLICATION, 2018–2026 ($MILLION)
TABLE 39.    JAPAN AROMA INGREDIENTS MARKET, BY TYPE , 2018–2026 ($MILLION)
TABLE 40.    JAPAN AROMA INGREDIENTS MARKET, BY APPLICATION, 2018–2026 ($MILLION)
TABLE 41.    INDIA AROMA INGREDIENTS MARKET, BY TYPE, 2018–2026 ($MILLION)
TABLE 42.    INDIA AROMA INGREDIENTS MARKET, BY APPLICATION, 2018–2026 ($MILLION)
TABLE 43.    SOUTH KOREA AROMA INGREDIENTS MARKET, BY TYPE , 2018–2026 ($MILLION)
TABLE 44.    SOUTH KOREA  AROMA INGREDIENTS MARKET, BY APPLICATION, 2018–2026 ($MILLION)
TABLE 45.    AUSTRALIA AROMA INGREDIENTS MARKET, BY TYPE , 2018–2026 ($MILLION)
TABLE 46.    AUSTRALIA AROMA INGREDIENTS MARKET, BY APPLICATION, 2018–2026 ($MILLION)
TABLE 47.    REST OF ASIA-PACIFIC AROMA INGREDIENTS MARKET, BY TYPE, 2018–2026 ($MILLION)
TABLE 48.    REST OF ASIA-PACIFIC AROMA INGREDIENTS MARKET, BY APPLICATION, 2018–2026 ($MILLION)
TABLE 49.    LAMEA AROMA INGREDIENTS MARKET, BY TYPE , 2018–2026($MILLION)
TABLE 50.    LAMEA AROMA INGREDIENTS MARKET, BY APPLICATION, 2018–2026 ($MILLION)
TABLE 51.    LAMEA AROMA INGREDIENTS MARKET, BY COUNTRY, 2018–2026 ($MILLION)
TABLE 52.    BRAZIL AROMA INGREDIENTS MARKET, BY TYPE , 2018–2026 ($MILLION)
TABLE 53.    BRAZIL AROMA INGREDIENTS MARKET, BY APPLICATION, 2018–2026 ($MILLION)
TABLE 54.    SAUDI ARABIA AROMA INGREDIENTS MARKET, BY TYPE , 2018–2026 ($MILLION)
TABLE 55.    SAUDI ARABIA AROMA INGREDIENTS MARKET, BY APPLICATION, 2018–2026 ($MILLION)
TABLE 56.    SOUTH AFRICA AROMA INGREDIENTS MARKET, BY TYPE, 2018–2026 ($MILLION)
TABLE 57.    SOUTH AFRICA AROMA INGREDIENTS MARKET, BY APPLICATION, 2018–2026 ($MILLION)
TABLE 58.    REST OF LAMEA AROMA INGREDIENTS MARKET, BY TYPE, 2018–2026 ($MILLION)
TABLE 59.    REST OF LAMEA AROMA INGREDIENTS MARKET, BY APPLICATION, 2018–2026 ($MILLION)
TABLE 60.    BASF: KEY EXECUTIVES
TABLE 61.    BASF: COMPANY SNAPSHOT
TABLE 62.    BASF: OPERATING SEGMENTS
TABLE 63.    BASF: PRODUCT PORTFOLIO
TABLE 64.    BASF: R&D EXPENDITURE, 2016–2018 ($MILLION)
TABLE 65.    BASF: NET SALES, 2016–2018 ($MILLION)
TABLE 66.    FIRMENICH SA: KEY EXECUTIVES
TABLE 67.    FIRMENICH SA: COMPANY SNAPSHOT
TABLE 68.    FIRMENICH SA: OPERATING SEGMENTS
TABLE 69.    FIRMENICH SA: PRODUCT PORTFOLIO
TABLE 70.    FIRMENICH SA: NET SALES, 2016–2018 ($MILLION)
TABLE 71.    GIVAUDAN: KEY EXECUTIVES
TABLE 72.    GIVAUDAN: COMPANY SNAPSHOT
TABLE 73.    GIVAUDAN: OPERATING SEGMENTS
TABLE 74.    GIVAUDAN: PRODUCT PORTFOLIO
TABLE 75.    GIVAUDAN: R&D EXPENDITURE, 2016–2018 ($MILLION)
TABLE 76.    GIVAUDAN: NET SALES, 2016–2018 ($MILLION)
TABLE 77.    IFF: KEY EXECUTIVES
TABLE 78.    IFF: COMPANY SNAPSHOT
TABLE 79.    IFF: OPERATING SEGMENTS
TABLE 80.    IFF: PRODUCT PORTFOLIO
TABLE 81.    IFF: R&D EXPENDITURE, 2016–2018 ($MILLION)
TABLE 82.    IFF: NET SALES, 2016–2018 ($MILLION)
TABLE 83.    ROBERTET: KEY EXECUTIVES
TABLE 84.    ROBERTET: COMPANY SNAPSHOT
TABLE 85.    ROBERTET: OPERATING SEGMENTS
TABLE 86.    ROBERTET: PRODUCT PORTFOLIO
TABLE 87.    ROBERTET: NET SALES, 2016–2018 ($MILLION)
TABLE 88.    S H KELKAR AND COMPANY LIMITED.: KEY EXECUTIVES
TABLE 89.    S H KELKAR AND COMPANY LIMITED.: COMPANY SNAPSHOT
TABLE 90.    S H KELKAR AND COMPANY LIMITED.: OPERATING SEGMENTS
TABLE 91.    S H KELKAR AND COMPANY LIMITED.: PRODUCT PORTFOLIO
TABLE 92.    S H KELKAR AND COMPANY LIMITED.: R&D EXPENDITURE, 2016–2018 ($MILLION)
TABLE 93.    S H KELKAR AND COMPANY LIMITED.: NET SALES, 2016–2018 ($MILLION)
TABLE 94.    SENSIENT: KEY EXECUTIVES
TABLE 95.    SENSIENT: COMPANY SNAPSHOT
TABLE 96.    SENSIENT: OPERATING SEGMENTS
TABLE 97.    SENSIENT: PRODUCT PORTFOLIO
TABLE 98.    SENSIENT: R&D EXPENDITURE, 2016–2018 ($MILLION)
TABLE 99.    SENSIENT: NET SALES, 2016–2018 ($MILLION)
TABLE 100.    SYMRISE: KEY EXECUTIVES
TABLE 101.    SYMRISE: COMPANY SNAPSHOT
TABLE 102.    SYMRISE: OPERATING SEGMENTS
TABLE 103.    SYMRISE: PRODUCT PORTFOLIO
TABLE 104.    SYMRISE: R&D EXPENDITURE, 2016–2018 ($MILLION)
TABLE 105.    SYMRISE: NET SALES, 2016–2018 ($MILLION)
TABLE 106.    T. HASEGAWA CO., LTD.: KEY EXECUTIVES
TABLE 107.    T. HASEGAWA CO., LTD.: COMPANY SNAPSHOT
TABLE 108.    T. HASEGAWA CO., LTD.: OPERATING SEGMENTS
TABLE 109.    T. HASEGAWA CO., LTD.: PRODUCT PORTFOLIO
TABLE 110.    T. HASEGAWA CO., LTD.: NET SALES, 2016–2018 ($MILLION)
TABLE 111.    TAKASAGO: KEY EXECUTIVES
TABLE 112.    TAKASAGO: COMPANY SNAPSHOT
TABLE 113.    TAKASAGO: OPERATING SEGMENTS
TABLE 114.    TAKASAGO: PRODUCT PORTFOLIO
TABLE 115.    TAKASAGO: NET SALES, 2016–2018 ($MILLION)

LIST OF FIGURES

FIGURE 01.    KEY MARKET SEGMENTS
FIGURE 02.    GLOBAL AROMA INGREDIENTS MARKET SNAPSHOT
FIGURE 03.    TOP INVESTMENT POCKETS
FIGURE 04.    MODERATE BARGAINING POWER OF SUPPLIERS
FIGURE 05.    HIGH BARGAINING POWER OF BUYERS
FIGURE 06.    MODERATE THREAT OF SUBSTITUTION
FIGURE 07.    MODERATE THREAT OF NEW ENTRANTS
FIGURE 08.    MODERATE INTENSITY OF COMPETITIVE RIVALRY
FIGURE 09.    GLOBAL AROMA INGREDIENTS MARKET SHARE, BY TYPE, 2018(%)
FIGURE 10.    COMPARATIVE SHARE ANALYSIS OF NATURAL AROMA INGREDIENTS MARKET, BY COUNTRY, 2018 & 2026 (%)
FIGURE 11.    COMPARATIVE SHARE ANALYSIS OF SYNTHETIC AROMA INGREDIENTS MARKET, BY COUNTRY, 2018 & 2026 (%)
FIGURE 12.    GLOBAL AROMA INGREDIENTS MARKET SHARE, BY APPLICATION, 2018(%)
FIGURE 13.    COMPARATIVE SHARE ANALYSIS OF AROMA INGREDIENTS MARKET FOR HOMECARE, BY COUNTRY, 2018 & 2026 (%)
FIGURE 14.    COMPARATIVE SHARE ANALYSIS OF AROMA INGREDIENTS MARKET FOR PERSONAL CARE, BY COUNTRY, 2018 & 2026 (%)
FIGURE 15.    COMPARATIVE SHARE ANALYSIS OF AROMA INGREDIENTS MARKET FOR FINE FRAGRANCES & PERFUMES, BY COUNTRY, 2018 & 2026 (%)
FIGURE 16.    COMPARATIVE SHARE ANALYSIS OF AROMA INGREDIENTS MARKET FOR OTHER APPLICATIONS, BY COUNTRY, 2018 & 2026 (%)
FIGURE 17.    GLOBAL AROMA INGREDIENTS MARKET SHARE BY REGION, 2018(%)
FIGURE 18.    U.S. AROMA INGREDIENTS MARKET, 2018–2026 ($MILLION)
FIGURE 19.    CANADA AROMA INGREDIENTS MARKET, 2018–2026 ($MILLION)
FIGURE 20.    MEXICO  AROMA INGREDIENTS MARKET, 2018–2026 ($MILLION)
FIGURE 21.    UK AROMA INGREDIENTS MARKET, 2018–2026 ($MILLION)
FIGURE 22.    GERMANY AROMA INGREDIENTS MARKET, 2018–2026 ($MILLION)
FIGURE 23.    FRANCE  AROMA INGREDIENTS MARKET, 2018–2026 ($MILLION)
FIGURE 24.    ITALY AROMA INGREDIENTS MARKET, 2018–2026 ($MILLION)
FIGURE 25.    SPAIN AROMA INGREDIENTS MARKET, 2018–2026 ($MILLION)
FIGURE 26.    REST OF EUROPE  AROMA INGREDIENTS MARKET, 2018–2026 ($MILLION)
FIGURE 27.    CHINA AROMA INGREDIENTS MARKET, 2018–2026 ($MILLION)
FIGURE 28.    JAPAN AROMA INGREDIENTS MARKET, 2018–2026 ($MILLION)
FIGURE 29.    INDIA AROMA INGREDIENTS MARKET, 2018–2026 ($MILLION)
FIGURE 30.    SOUTH KOREA AROMA INGREDIENTS MARKET, 2018–2026 ($MILLION)
FIGURE 31.    AUSTRALIA AROMA INGREDIENTS MARKET, 2018–2026 ($MILLION)
FIGURE 32.    REST OF ASIA-PACIFIC  AROMA INGREDIENTS MARKET, 2018–2026 ($MILLION)
FIGURE 33.    BRAZIL AROMA INGREDIENTS MARKET, 2018–2026 ($MILLION)
FIGURE 34.    SAUDI ARABIA AROMA INGREDIENTS MARKET, 2018–2026 ($MILLION)
FIGURE 35.    SOUTH AFRICA  AROMA INGREDIENTS MARKET, 2018–2026 ($MILLION)
FIGURE 36.    REST OF LAMEA AROMA INGREDIENTS MARKET, 2018–2026 ($MILLION)
FIGURE 37.    TOP WINNING STRATEGIES, BY YEAR, 2016–2019*
FIGURE 38.    TOP WINNING STRATEGIES, BY DEVELOPMENT, 2016–2019* (%)
FIGURE 39.    TOP WINNING STRATEGIES, BY COMPANY, 2016–2019*
FIGURE 40.    PRODUCT MAPPING OF TOP 10 KEY PLAYERS
FIGURE 41.    COMPETITIVE DASHBOARD OF TOP 10 KEY PLAYERS
FIGURE 42.    COMPETITIVE HEATMAP OF TOP 10 KEY PLAYERS
FIGURE 43.    BASF: R&D EXPENDITURE, 2016–2018 ($MILLION)
FIGURE 44.    BASF: NET SALES, 2016–2018 ($MILLION)
FIGURE 45.    BASF: REVENUE SHARE BY SEGMENT, 2018 (%)
FIGURE 46.    BASF: REVENUE SHARE BY REGION, 2018 (%)
FIGURE 47.    FIRMENICH SA: NET SALES, 2016–2018 ($MILLION)
FIGURE 48.    GIVAUDAN: R&D EXPENDITURE, 2016–2018 ($MILLION)
FIGURE 49.    GIVAUDAN: NET SALES, 2016–2018 ($MILLION)
FIGURE 50.    GIVAUDAN: REVENUE SHARE BY SEGMENT, 2018 (%)
FIGURE 51.    GIVAUDAN: REVENUE SHARE BY REGION, 2018 (%)
FIGURE 52.    IFF: R&D EXPENDITURE, 2016–2018 ($MILLION)
FIGURE 53.    IFF: NET SALES, 2016–2018 ($MILLION)
FIGURE 54.    IFF: REVENUE SHARE BY SEGMENT, 2018 (%)
FIGURE 55.    IFF: REVENUE SHARE BY REGION, 2018 (%)
FIGURE 56.    ROBERTET: NET SALES, 2016–2018 ($MILLION)
FIGURE 57.    ROBERTET: REVENUE SHARE BY SEGMENT, 2018 (%)
FIGURE 58.    ROBERTET: REVENUE SHARE BY REGION, 2018 (%)
FIGURE 59.    S H KELKAR AND COMPANY LIMITED.: R&D EXPENDITURE, 2016–2018 ($MILLION)
FIGURE 60.    S H KELKAR AND COMPANY LIMITED.: NET SALES, 2016–2018 ($MILLION)
FIGURE 61.    S H KELKAR AND COMPANY LIMITED.: REVENUE SHARE BY SEGMENT, 2018 (%)
FIGURE 62.    S H KELKAR AND COMPANY LIMITED.: REVENUE SHARE BY REGION, 2018 (%)
FIGURE 63.    SENSIENT: R&D EXPENDITURE, 2016–2018 ($MILLION)
FIGURE 64.    SENSIENT: NET SALES, 2016–2018 ($MILLION)
FIGURE 65.    SENSIENT: REVENUE SHARE BY SEGMENT, 2018 (%)
FIGURE 66.    SENSIENT: REVENUE SHARE BY REGION, 2018 (%)
FIGURE 67.    SYMRISE: R&D EXPENDITURE, 2016–2018 ($MILLION)
FIGURE 68.    SYMRISE: NET SALES, 2016–2018 ($MILLION)
FIGURE 69.    SYMRISE: REVENUE SHARE BY SEGMENT, 2018 (%)
FIGURE 70.    SYMRISE: REVENUE SHARE BY REGION, 2018 (%)
FIGURE 71.    T. HASEGAWA CO., LTD.: NET SALES, 2016–2018 ($MILLION)
FIGURE 72.    T. HASEGAWA CO., LTD.: REVENUE SHARE BY SEGMENT, 2018 (%)
FIGURE 73.    TAKASAGO: NET SALES, 2016–2018 ($MILLION)
FIGURE 74.    TAKASAGO: REVENUE SHARE BY SEGMENT, 2018 (%)
FIGURE 75.    TAKASAGO: REVENUE SHARE BY REGION, 2018 (%)


Upsurge in demand for natural and unique fragrances from cosmetic and personal care & home care industries, owing to the changing consumer demand drives the growth of the global aroma ingredients industry. This is attributed to the fact that aroma ingredients are widely used in soaps, creams, lotions, shampoos, and other cosmetic & personal care essential products. Presently, consumer are more concerned about personal appearance and hygiene, and thus seek for new & improved options, which has boosted the demand for aroma ingredients. Moreover, products imparting gentle, exotic fragrance uplifts the mood of consumers, attracting a large customer base. In addition, aroma ingredients used in cosmetic or personal care products provide exotic fragrance; hence, the demand for aroma ingredients is increasing at a significant rate. Moreover, the demand for natural & bio-based products among consumer is increasing as compared to conventional products, thus driving the market growth.

In addition, surge in demand for homecare product accelerates the growth of the global aroma ingredients market. Furthermore, rise in disposable income and better access to quality brands of consumers, due to an effective supply chain, supplement the market growth. However, high cost involved in the preparation of natural & bio-based products impedes the growth of the overall market, as the prices for natural aroma ingredients are comparatively high. Furthermore, key companies in the aroma ingredients market are adopting different strategies such as innovation and acquisition to strengthen their foothold in the market and increase profitability. Demand from developing nations and significant technological advancements in production and extraction process of aroma ingredients to meet the consumer expectations are anticipated to provide lucrative opportunities for market expansion.


PURCHASE OPTIONS

Call or Email us

U.S.-Canada Toll-free: +1-800-792-5285
Int'l : +1-503-894-6022
Europe : +44-845-528-1300
Email : help@alliedmarketresearch.com

Looking for Customization?

 Customization Request

Have a Question?

 Speak with Analyst

Any Confusion?

 Inquire Before Buying

Have a glance of the Report

  Request Sample
RELATED TAGS

Purchase Full Report of
Aroma Ingredients Market

Start reading instantly.
This Report and over 67,068+ more Reports, Available with Avenue Library. T&C*.

  • Online Only
  • $3,456
  • Online cloud access only
  • Restricted print, copy, paste & download
  • Read only
  • Free industry update
    (Within 180 days)
  • Free report update in next update cycle
    (Aug 2020 - Aug 2021)
  • Data Pack
  • $3,840
  • Restricted to one authorized user
  • One print only
  • Available in
    Excel
  • Free industry update
    (Within 180 days)
  •   Free report update in next update cycle
    (Aug 2020 - Aug 2021)
  • Single User
  • $5,769
  • Restricted to one authorized user
  • One print only
  • Available in
    PDF
  • Free industry update
    (Within 180 days)
  •   Free report update in next update cycle
    (Aug 2020 - Aug 2021)
  • Five Users
  • $6,450
  • Limited to five authorized users
  • Print upto five copies
  • Available in
    PDF
  • Free industry update
    (Within 180 days)
  •   Free report update in next update cycle
    (Aug 2020 - Aug 2021)
  • Enterprise
    License/PDF

  • $10,995
  • Unlimited
    within
    company/enterprise
  • Available in Excel & PDF
  • Free industry update
    (Within 180 days)
  •   Free report update in next update cycle
    (Aug 2020 - Aug 2021)
  • Library
    Membership

  • $999 $ 1,175
    Per User/ Per month/ Billed annually
  • Published Content
    E-access
  • Company Profiles
    E-access
  • Newly Added Content Access
  • 10 PDF
    Downloads
  • 5 Excel Data
    Pack Downloads
  • 250 Company Profiles PDF Downloads
  • Buy Now

*Taxes/Fees, if applicable will be added during checkout. All prices in USD

RELATED REPORTS
 

Why Allied Market Research?


Infallible Methodology

To ensure high-level data integrity, accurate analysis, and impeccable forecasts

Analyst Support

For complete satisfaction

Customization

On-demand customization of scope of the report to exactly meet your needs

TARGETED MARKET VIEW

Targeted market view to provide pertinent information and save time of readers

Get fresh content delivered

Get insights on topics that are crucial for your business. Stay abreast of your interest areas.

Get Industry Data Alerts

Why Allied Market Research?

Infallible Methodology

To ensure high-level data integrity, accurate analysis, and impeccable forecasts

Analyst Support

For complete satisfaction

Customization

On-demand customization of scope of the report to exactly meet your needs

TARGETED MARKET VIEW

Targeted market view to provide pertinent information and save time of readers