
Aromatherapy Diffusers Market Research, 2034
Market Introduction and Definition
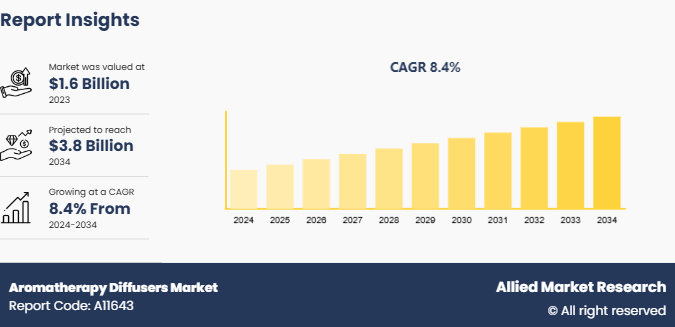
The global aromatherapy diffusers market size was valued at $1.6 billion in 2023, and is projected to reach $3.8 billion by 2034, growing at a CAGR of 8.4% from 2024 to 2034. Aromatherapy diffusers are devices designed to disperse essential oils into the air, filling a space with pleasant and therapeutic aromas. These devices help create an ambient environment that promotes relaxation, improves mood, and provides various health benefits. Aromatherapy diffusers work by using different methods to break essential oils into small particles, which are then emitted as fine mist or vapor. Common types include ultrasonic diffusers, which use water and ultrasonic waves to create a cool mist, and nebulizing diffusers, which do not use water and disperse pure oil particles through pressurized air. The benefits of using aromatherapy diffusers include stress reduction, improved sleep quality, better focus, and a boosted immune system. In addition, the therapeutic properties of essential oils may aid in relieving headaches and promoting respiratory health.
Key Takeaways
The aromatherapy diffusers market study covers 20 countries. The research includes a segment analysis of each country in terms of value ($Billion) for the projected period 2024-2034.
More than 1, 500 product literatures, industry releases, annual reports, and other such documents of major aromatherapy diffusers industry participants along with authentic industry journals, trade associations' releases, and government websites have been reviewed for generating high-value industry insights.
The study integrated high-quality data, professional opinions and analysis, and critical independent perspectives. The research approach is intended to provide a balanced view of global markets and to assist stakeholders in making educated decisions in order to achieve their most ambitious growth objectives.
Key Market Dynamics
Increased awareness of the benefits of essential oils has significantly boosted the market demand for aromatherapy diffusers. Consumers have gained awareness regarding the therapeutic effects of essential oils, such as stress relief, relaxation, and better sleep. Growing knowledge about essential oils has driven a shift toward holistic health practices, with many individuals seeking natural solutions to improve overall well-being. Aromatherapy diffusers offer a simple and convenient way to incorporate essential oils into daily routines, allowing users to experience stress reduction, relaxation, and improved sleep. Moreover, endorsements from health and wellness influencers, along with educational content on aromatherapy, have contributed to greater consumer interest. As a result, aromatherapy diffusers market demand has increased, and manufacturers are responding with innovations such as smart controls and portable designs to meet evolving consumer preferences in recent years.
However, the high cost of premium-quality essential oils and diffusers restricts market demand for aromatherapy diffusers. Premium essential oils, such as pure lavender, frankincense, and rose oil, may range from $30 to $150 per 10 ml bottle, depending on the rarity and quality of the oil. When combined with high-end diffusers, the cost of aromatic diffusers may range between $50 and $200, which in turn becomes a barrier for many potential buyers. The high price is anticipated to limit access to those who are more price-sensitive or new to aromatherapy, hindering the market adoption. Moreover, consumers in emerging markets, where affordability is a key consideration, are less likely to invest in premium products. As a result, many consumers opt for more affordable alternatives or choose not to purchase premium aromatherapy diffusers, thus hampering the aromatherapy diffusers market growth.
The expanding use of aromatherapy in the hospitality and spa industries has created new opportunities for growth in the aromatherapy diffusers market. Hotels, resorts, and wellness centers are increasingly adopting aromatherapy to improve the atmosphere of guest spaces, supporting mental clarity, better sleep, and mood improvement. Aromatherapy diffusers are used to create an immersive sensory environment that complements various wellness treatments, such as massages and facials in spas. As wellness tourism continues to rise, more resorts and hotels may offer personalized aromatherapy experiences, including in-room diffusers with customizable scents. The increase in demand from hospitality and spa industries for diffusers with features such as multi-scent diffusion, extended runtime, and stylish designs that suit high-end settings, are anticipated to drive aromatherapy diffusers market expansion. Thus, manufacturers have an opportunity to expand product lines and develop new diffuser models that cater specifically to the needs of the hospitality industry, driving further aromatherapy diffusers market share.
Value Chain of Global Aromatherapy Diffusers Market

The value chain of aromatherapy diffusers begins with raw material sourcing, including essential oils, plastics, glass, and electronic components. Suppliers provide high-quality essential oils, while manufacturers source durable materials for diffuser bodies and misting mechanisms. In the next step, manufacturers design and assemble the diffusers, incorporating features such as ultrasonic or nebulizing technology, timers, and smart functionalities. Once assembled, the diffusers are packaged and distributed through various channels, including retailers, online platforms, and wellness-focused stores. Marketing and branding efforts play a crucial role in promoting diffusers to target consumers. Finally, consumers purchase and use the diffusers, while feedback and demand trends influence future product development. Throughout the value chain, quality control ensures the final product meets safety and performance standards.
Market Segmentation
The aromatherapy diffusers market is segmented on the basis of product type, application, distribution channel, and region. By product type, the market is classified into ultrasonic diffusers, nebulizing diffusers, and others. By end-user, the market is divided into residential and commercial. By distribution channel, it is categorized into B2B and B2C. Region wise, the market is analyzed across North America, Europe, Asia-Pacific, and LAMEA.
Regional/Country Market Outlook
The growth of aromatherapy diffusers in North America is driven by a rise in awareness of the benefits of aromatherapy for mental well-being, stress relief, and improved sleep. Consumers in North America increasingly seek natural, holistic solutions for health issues, fueling demand for aromatherapy diffusers. The popularity of wellness and self-care routines, along with the growth of wellness tourism, also contributes to the aromatherapy diffusers market growth in North America. In addition, advancements in smart home technology have led to the development of tech-enabled diffusers with features such as app control and voice integration. Moreover, increased disposable income and targeted marketing from leading brands further boosts the market expansion.
In the Asia-Pacific region, the increase in integration of traditional practices such as Ayurveda, aromatherapy, and acupuncture into modern wellness routines is driving the demand for aromatherapy diffusers. Countries such as India, Japan, and South Korea have experienced a shift toward wellness-focused lifestyles, where consumers seek products that align with these cultural practices. For instance, in Japan, there is a strong interest in creating peaceful home environments, leading to higher sales of aromatherapy diffusers. Furthermore, the rise of eco-conscious consumer behavior in the region has encouraged the demand for sustainable, eco-friendly aromatherapy diffusers made from natural materials.
Industry Trends:
There is a shift toward the integration of smart technology in aromatherapy diffusers. Manufacturers are developing diffusers with advanced features such as app connectivity, voice control, and customizable scent schedules, catering to the growing demand for convenience and personalization. For instance, in March 2023, Young Living launched Aria 2.0, a smart diffuser with app integration that allows users to control mist intensity and light settings remotely. In May 2024, doTERRA introduced its Petal Smart Diffuser, which offers voice control through Amazon Alexa and Google Assistant, enabling users to manage scent intensity and timer settings hands-free. These technological advancements are helping aromatherapy diffusers attract a wider audience, which is expected to drive adoption in both residential and commercial spaces during the aromatherapy diffusers market forecast.
Competitive Landscape
The major players operating in the aromatherapy diffusers market include Young Living, doTERRA, InnoGear, Vitruvi, URPOWER, Stadler Form, Saje Natural Wellness, ArtNaturals, Muji, and Asakuki.
Recent Key Strategies and Developments
In April 2022, WoodWick Candle Brand launched the woodwick radiance diffuser, a battery-operated, refillable device reflecting its signature hourglass shape, offering a convenient and waterless fragrance experience.
In March 2022, Saje Natural Wellness partnered with The Little Market to launch the limited-edition aroma mosaic diffuser featuring an artisan hexagon-dash design inspired by fair-trade craftsmanship.
Key Benefits For Stakeholders
- This report provides a quantitative analysis of the market segments, current trends, estimations, and dynamics of the aromatherapy diffusers market analysis from 2024 to 2034 to identify the prevailing aromatherapy diffusers market opportunities.
- The market research is offered along with information related to key drivers, restraints, and opportunities.
- Porter's five forces analysis highlights the potency of buyers and suppliers to enable stakeholders make profit-oriented business decisions and strengthen their supplier-buyer network.
- In-depth analysis of the aromatherapy diffusers market segmentation assists to determine the prevailing market opportunities.
- Major countries in each region are mapped according to their revenue contribution to the global market.
- Market player positioning facilitates benchmarking and provides a clear understanding of the present position of the market players.
- The report includes the analysis of the regional as well as global aromatherapy diffusers market trends, key players, market segments, application areas, and market growth strategies.
Aromatherapy Diffusers Market Report Highlights
| Aspects | Details |
| Market Size By 2034 | USD 3.8 Billion |
| Growth Rate | CAGR of 8.4% |
| Forecast period | 2024 - 2034 |
| Report Pages | 376 |
| By Product Type |
|
| By End-User |
|
| By Distribution Channel |
|
| By Region |
|
| Key Market Players | Muji, Young Living Essential oils, Stadler Form AG, Saje Natural Wellness, Vitruvi, InnoGear, doTERRA International, LLC, Asakuki, URPOWER, ArtNaturals |
The global aromatherapy diffusers market was valued at $1.6 billion in 2023.
Growing demand for smart, eco-friendly, and customizable aromatherapy diffusers are some of the upcoming trends of Aromatherapy Diffusers Market.
The leading application of the aromatherapy diffusers market is wellness and stress relief. These diffusers are used to create a calming environment by dispersing essential oils, helping users reduce stress, anxiety, and improve mental well-being.
Based on region, North America held the highest market share in terms of revenue in 2023.
The major players operating in the aromatherapy diffusers market include Young Living, doTERRA, InnoGear, Vitruvi, URPOWER, Stadler Form, Saje Natural Wellness, ArtNaturals, Muji, and Asakuki.
Loading Table Of Content...

