0
New
New
2023
Artificial Joints Market

Artificial Joints Market

by Type (Cemented artificial joints, Non-cemented artificial joints), by Application (Artificial knee joints, Artificial hip joints, Others), by Material (Ceramics, Alloy, Others), by End user (Hospitals, Other): Global Opportunity Analysis and Industry Forecast, 2023-2032

Report Code: A04008
Jun 2023 | Pages: 447
Tables: 152
Charts: 66
  • Formats*:

  • pdf

    Single User License, Five User
    License & Enterprise User License

  • xls

    Data Pack Excel License

  • ppt

    It comes with the additional cost
    of $2500.00 contact sales.


Artificial Joints Market Research, 2032

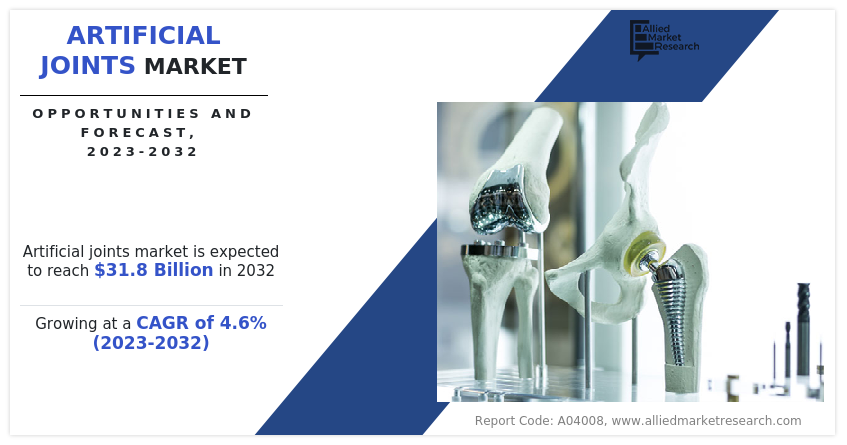
The global artificial joints market size was valued at $20.2 billion in 2022, and is projected to reach $31.8 billion by 2032, growing at a CAGR of 4.6% from 2023 to 2032. Artificial joints, commonly referred to as prosthetic joints or joint implants, are medical devices created to replace a human body joint that has been injured or undergoes degenerative changes. These tools are designed to act similarly to a natural joint, improving joint mobility, relieving pain, and regaining physical function. Artificial joints are typically used in orthopedic surgeries, such as joint replacement surgeries, to replace joints that have been severely damaged due to conditions such as osteoarthritis, rheumatoid arthritis, joint degeneration, or joint trauma.

Artificial joints are constructed using biocompatible materials, such as metal alloys, high-density plastics, ceramics, or a combination of these materials. These materials are chosen for their durability, strength, biocompatibility, and ability to withstand the mechanical stress and movements of the joint.

The artificial joints market was slightly negative during the lockdown period owing to cancelation of non-emergency orthopedic surgeries and decrease in number of surgeries.

Artificial Joints Market

Historical Overview

The artificial joints market share is analyzed qualitatively and quantitatively from 2022 to 2032. The artificial joints market experienced growth at a CAGR of around 4.6% from 2022 to 2032. Most of the growth during this period is  derived from North America owing to rise in the number of market players for artificial joints and increase in the number of populations suffering from orthopedic diseases such as osteoarthritis.   

Market Dynamics

Growth of the global artificial joints market forecast is majorly driven by high presence of market players artificial joints, increase in prevalence of osteoarthritis, and technological advancements for development of artificial joints. Moreover, rise in prevalence of osteoarthritis is anticipated to increase the number of surgical procedures such as knee replacement and hip replacement. Thus, this factor is anticipated to drive the demand for artificial joints and boost the growth of the market. Osteoarthritis is a degenerative joint disease that can cause significant pain, stiffness, and functional limitations in the affected joint. Thus, this factor is anticipated to boost the demand for artificial joints and drive the growth of the market.

For instance, according to the Centers for Disease Control and Prevention (CDC), in 2021, osteoarthritis was the most common form of arthritis and about 58.5 million people suffered from arthritis in the U.S. Thus, rise in prevalence of osteoarthritis cases is expected to drive the growth of artificial joints market. In addition, surge in incidences of knee osteoarthritis further increases the demand for artificial knee joints. For instance, according to the data published by National Center for Biomedical Information (NCBI), in November 2020, around 86.7 million individuals were suffering from knee osteoarthritis, globally. Therefore, increase in incidence rate of knee osteoarthritis is expected to increase the number of knee replacement surgeries and boost the artificial joints market growth.

Moreover, rise in the number of orthopedic surgeries such as knee replacement, knee arthroplasty, and hip replacement is anticipated to drive the demand for artificial knee and hip joints. Thus, this factor is expected to drive the growth of the market. For instance, according to annual report of The Swedish Arthroplasty Register, 222,249 individuals had at least one hip replacement and 155,041 individuals had at least one knee replacement in Sweden at the end of 2021.

Moreover, according to, National Library of Medicine, in 2022, the demand for total knee arthroplasty (TKA) in the U.S. was anticipated to increase 673% from 2005 to 2030, with 5.28 million TKAs to be done annually. In addition, American Joint Replacement Registry Annual Report, in 2022 reported that, over 2.8 million hip and knee procedures were performed in 1,250 institutions  of Columbia. Thus, rise in the number of knee replacement, knee arthroplasty, and hip replacement is anticipated to fuel the demand for artificial joints and drive the growth of the market.

Rise in the number of geriatric populations is anticipated to increase the number of populations suffering from osteoarthritis, which is expected to increase the number of surgical procedures and increase the demand for artificial joint. Therefore, fueling the growth of the market. For instance, according to National Poll of Healthy Aging, in 2022, three in five adults of age group 50 years to 80 years (60%) reported that they have arthritis, with 30% reporting a diagnosis of osteoarthritis, that is, “wear and tear,” “bone-on-bone,” or degenerative arthritis. Less commonly reported types of arthritis were rheumatoid arthritis (8%), gout or pseudogout (7%), or another kind of arthritis (5%).

Moreover, the Swedish Arthroplasty Register, in 2021, reported that around 46,777 population of age group 65 years to 74 years, and around 58,020 population of 75 year to 84 years have undergone knee replacement surgery in Sweden. Thus, rise in prevalence of osteoarthritis in geriatric population is anticipated to increase the number of arthroplasty surgeries. Thus, this factor is anticipated to fuel the needs for artificial joints in aging population and boost the artificial joints market share.

Increase in prevalence of sports injuries is anticipated to increase the prevalence of osteoarthritis, thus, expected to rise the demand for surgical intervention and fuel the demand for artificial joints. Therefore, boosting the growth of the market. Injuries to the joints, such as sports-related injuries, repetitive stress injuries, or accidents, are predicted to increase the risk of developing osteoarthritis. Joint trauma can damage the protective cartilage within the joint, leading to accelerated joint degeneration and the onset of osteoarthritis. For instance, according to report published by National Safety Council of U.S, in 2021, 20% rise in sports and recreational injuries was observed as compared to 2020.  Thus, increase in the number of sports injuries boosts the growth of the market.

On the other hand, side effects associated to surgical intervention, in which artificial joints are used, is expected to hamper the growth of the market. For instance, side effects of surgical intervention include risk of infection at the surgical site or in the joint following arthroplasty surgery and risk of blood clots forming in the legs (deep vein thrombosis) or traveling to the lungs (pulmonary embolism). Moreover, it also includes issues with the artificial joint itself can occur, such as joint dislocation, loosening, or wear and tear over time, alleviate pain, allergic reaction, and others. Thus, this factor anticipated to decrease in number of surgical procedures and expected to hamper the growth of artificial joints market.  

COVID-19 had a significant impact on the artificial joints market. Several clinical trials have been disrupted due to the pandemic and social distancing regulations. The shortage of healthcare workers, financial constraints, and lockdowns have led to increase in the number of patients who are unable to access timely treatments. Thus, these factors are anticipated to restrain the growth of the market. In addition, decrease in the number of orthopedic surgeries such as total joint arthroplasty (TJA) and total knee arthroplasty (TKA) is anticipated decrease the demand for artificial joints and restrain the growth of the market.

For instance, according to National Library of Medicine, in 2021, there was 30.1% decrease in revision TKA surgery and a 6.80% decrease in revision total hip replacement surgery in the U.S. Moreover, Springer Journal of Experimental Orthopedics reported that, there was drop of 54% and 42%, in the rate of joint replacements and arthroscopies, respectively, in April 2020. Thus, cancelation of elective surgeries, decrease in the number of consultations in orthopedic diseases, and financial constraints were anticipated to hinder the growth of the market during the COVID-19 pandemic. 

Segmental Overview

The artificial joints market size is segmented on the basis of type, application, material, end user, and region. On the basis of type, the market is bifurcated into cemented artificial joints and non-cemented artificial joints. On the basis of application, the market is divided into artificial knee joints, artificial hip joints, and others. Others includes shoulder artificial joint and ankle artificial joint. On the basis of material, the market is segmented into ceramics, alloy, and others. Others includes high-density plastics and oxinium. On the basis of end user, the market is bifurcated into hospitals and ambulatory surgical center.  Region-wise, the market is analyzed across North America, Europe, Asia-Pacific, and LAMEA.

By Type

The artificial joints industry is classified into cemented artificial joints and non-cemented artificial joints. The cemented artificial joints segment is expected to be the fastest growing segment during the forecast period, as cemented fixation has been widely used in joint replacement surgeries for several decades and has shown good long-term clinical outcomes. The technique has a well-established track record of success, particularly in older patients with compromised bone quality.

Artificial Joints Market

By Application

The artificial joints industry is classified into artificial knee joints, artificial hip joints and others. Others include shoulder artificial joint and ankle artificial joint. The artificial knee joints segment is projected to be the fastest growing segment during the forecast period owing to rise in prevalence of knee osteoarthritis and increase in number of knee replacement surgeries.

Artificial Joints Market

By Material

The market is classified into ceramics, alloy, and others. Others includes high-density plastics and oxinium. The ceramic segment is projected to be the fastest growing segment during the forecast period, owing to high provision of ceramic artificial joints and ceramic materials are biocompatible and can reduce friction and wear on the joint.

Artificial Joints Market

By End User

The market is classified into hospitals and ambulatory surgical center. The hospitals segment is projected to be the fastest growing segment during the forecast period, owing to rise in adoption of orthopedic surgical in hospital and increase in development in healthcare infrastructure.

Artificial Joints Market

By Region

The North America artificial joints market opportunity is expected to grow during the forecast period, owing to rise in the number of adoptions of key strategies such as agreement and others and increase in the number of product approval and product launch for artificial joints. For instance, in September 2022, Conformis, Inc, a leading medical technology company featuring personalized knee and hip replacement products, announced that it has received 510(k) clearance from the U.S. Food and Drug Administration for its Actera Hip System. The artificial joint used in hip arthroplasty surgery.

Moreover, in August 2022, Conformis, Inc., a leading medical device company that features personalized knee and hip replacement products, announced it has entered into a multi-year agreement with Vizient, Inc., the nation's largest member-driven healthcare performance improvement company. It offers personalized orthopedic implants to Vizient’s large membership of healthcare facilities through this contract.

In addition, in May 2022, Johnson & Johnson MedTech, announced that the INHANCE shoulder system from DePuy Synthes, the orthopedics company of Johnson & Johnson, has received 510(k) clearance from the U.S. Food and Drug Administration (FDA) for use in reverse total shoulder arthroplasty procedures. Thus, rise in the number of product approvals for artificial joints and increase in the number of adoptions of key strategies by market players are anticipated to boost the growth of the market in North America.

However, the Asia-Pacific artificial joints market is expected to grow during the forecast period, owing to rise in prevalence of osteoarthritis and increase in the number of geriatric populations. Population suffering from osteoarthritis is anticipated to boost the number of arthroplasty surgeries and increase the demand for artificial joints. Thus, this factor is anticipated to drive the growth of the artificial joints market in Asia-Pacific. According to Eva Hospital, in 2021, osteoarthritis affects more than 15 million adults annually in India. Thus, rise in prevalence of osteoarthritis, increase in the number of knee replacement surgeries, and rise in the number of geriatric populations are anticipated boost the growth of the artificial joints market. 

Artificial Joints Market

Competition Analysis

Some of the major companies that operate in the global artificial joints market include Zimmer Biomet, Smith & Nephew, Stryker Corporation, DePuy Synthes, B. Braun, Aesculap, Medtronic, Medacta International, Exactech, and MicroPort Orthopedics Inc.  

Product Approval in the Artificial Joints Market

In June 2023, Smith & Nephew, one of the leading medical technology companies, announced that it has received 510(k) clearance from the U.S. food and drug administration (FDA) for its Aetos shoulder system. This system is used in surgical procedure of shoulder arthroplasty.

Key Benefits for Stakeholders

  • This report provides a quantitative analysis of the market segments, current trends, estimations, and dynamics of the artificial joints market analysis from 2022 to 2032 to identify the prevailing artificial joints market opportunities.
  • The market research is offered along with information related to key drivers, restraints, and opportunities.
  • Porter's five forces analysis highlights the potency of buyers and suppliers to enable stakeholders make profit-oriented business decisions and strengthen their supplier-buyer network.
  • In-depth analysis of the artificial joints market segmentation assists to determine the prevailing market opportunities.
  • Major countries in each region are mapped according to their revenue contribution to the global market.
  • Market player positioning facilitates benchmarking and provides a clear understanding of the present position of the market players.
  • The report includes the analysis of the regional as well as global artificial joints market trends, key players, market segments, application areas, and market growth strategies.

Artificial Joints Market Report Highlights

Aspects Details
Market Size By 2032 USD 31.8 billion
Growth Rate CAGR of 4.6%
Forecast period 2022 - 2032
Report Pages 447
By Type
  • Cemented artificial joints
  • Non-cemented artificial joints
By End user
  • Hospitals
  • Other
By Application
  • Artificial knee joints
  • Artificial hip joints
  • Others
By Material
  • Ceramics
  • Alloy
  • Others
By Region
  • North America  (U.S., Canada, Mexico)
  • Europe  (Germany, France, UK, Italy, Spain, Rest of Europe)
  • Asia-Pacific  (Japan, China, India, Australia, Rest of Asia-Pacific)
  • LAMEA  (Brazil, Saudi Arabia, South Africa, Rest of LAMEA)
Key Market Players Exactech, Stryker Corporation., B. Braun Melsungen AG, MicroPort Orthopedics Inc, Johnson and Johnson (DePuy Synthes), Smith & Nephew plc, Medtronic plc, Zimmer Biomet Holding Inc., Medacta International SA, Conformis Inc.

Analyst Review

Artificial joints are orthopedic prostheses that are frequently made of metal, oxonium, ceramics, and other materials. An arthritic or damaged joint surface is replaced using prosthetic joints during an orthopedic surgery procedure. Increase in the number of market players who manufacture artificial joints and rise in the number of adoptions of key strategies such as acquisition, agreement, product launch, and product approvals are anticipated to boost the growth of the market. For instance, in June 2023, Smith+Nephew, one of the leading medical technologies companies, announced that it has received  clearance from the U.S. food and drug administration (FDA) for its Aetos shoulder system. This system is used in surgical procedure of shoulder arthroplasty.

In addition, in November 2022, Smith+Nephew, one of the leading medical technologies companies, announced the introduction of its Journy II Rox total knee solution, a reverse hybrid construct for total knee arthroplasty. This product solution aims to provide surgeons with the clinical advantage of an advanced bearing material and anatomic design, combined with the efficiency and potential long-term tibia fixation of a cementless knee.

 
  • CHAPTER 1: INTRODUCTION

    • 1.1. Report description

    • 1.2. Key market segments

    • 1.3. Key benefits to the stakeholders

    • 1.4. Research Methodology

      • 1.4.1. Primary research

      • 1.4.2. Secondary research

      • 1.4.3. Analyst tools and models

  • CHAPTER 2: EXECUTIVE SUMMARY

    • 2.1. CXO Perspective

  • CHAPTER 3: MARKET OVERVIEW

    • 3.1. Market definition and scope

    • 3.2. Key findings

      • 3.2.1. Top impacting factors

      • 3.2.2. Top investment pockets

    • 3.3. Porter’s five forces analysis

      • 3.3.1. Low bargaining power of suppliers

      • 3.3.2. Low threat of new entrants

      • 3.3.3. Low threat of substitutes

      • 3.3.4. Low intensity of rivalry

      • 3.3.5. Low bargaining power of buyers

    • 3.4. Market dynamics

      • 3.4.1. Drivers

        • 3.4.1.1. Rise in prevalence of osteoarthritis
        • 3.4.1.2. Increase in number of geriatric populations
        • 3.4.1.3. Rise in number of sports injuries

      • 3.4.2. Restraints

        • 3.4.2.1. Side effects of surgical procedures

      • 3.4.3. Opportunities

        • 3.4.3.1. High presence of market players
        • 3.4.3.2. Rise in number of adoptions of key strategies by market players

    • 3.5. COVID-19 Impact Analysis on the market

  • CHAPTER 4: ARTIFICIAL JOINTS MARKET, BY TYPE

    • 4.1. Overview

      • 4.1.1. Market size and forecast

    • 4.2. Cemented artificial joints

      • 4.2.1. Key market trends, growth factors and opportunities

      • 4.2.2. Market size and forecast, by region

      • 4.2.3. Market share analysis by country

    • 4.3. Non-cemented artificial joints

      • 4.3.1. Key market trends, growth factors and opportunities

      • 4.3.2. Market size and forecast, by region

      • 4.3.3. Market share analysis by country

  • CHAPTER 5: ARTIFICIAL JOINTS MARKET, BY APPLICATION

    • 5.1. Overview

      • 5.1.1. Market size and forecast

    • 5.2. Artificial knee joints

      • 5.2.1. Key market trends, growth factors and opportunities

      • 5.2.2. Market size and forecast, by region

      • 5.2.3. Market share analysis by country

    • 5.3. Artificial hip joints

      • 5.3.1. Key market trends, growth factors and opportunities

      • 5.3.2. Market size and forecast, by region

      • 5.3.3. Market share analysis by country

    • 5.4. Others

      • 5.4.1. Key market trends, growth factors and opportunities

      • 5.4.2. Market size and forecast, by region

      • 5.4.3. Market share analysis by country

  • CHAPTER 6: ARTIFICIAL JOINTS MARKET, BY MATERIAL

    • 6.1. Overview

      • 6.1.1. Market size and forecast

    • 6.2. Ceramics

      • 6.2.1. Key market trends, growth factors and opportunities

      • 6.2.2. Market size and forecast, by region

      • 6.2.3. Market share analysis by country

    • 6.3. Alloy

      • 6.3.1. Key market trends, growth factors and opportunities

      • 6.3.2. Market size and forecast, by region

      • 6.3.3. Market share analysis by country

    • 6.4. Others

      • 6.4.1. Key market trends, growth factors and opportunities

      • 6.4.2. Market size and forecast, by region

      • 6.4.3. Market share analysis by country

  • CHAPTER 7: ARTIFICIAL JOINTS MARKET, BY END USER

    • 7.1. Overview

      • 7.1.1. Market size and forecast

    • 7.2. Hospitals

      • 7.2.1. Key market trends, growth factors and opportunities

      • 7.2.2. Market size and forecast, by region

      • 7.2.3. Market share analysis by country

    • 7.3. Other

      • 7.3.1. Key market trends, growth factors and opportunities

      • 7.3.2. Market size and forecast, by region

      • 7.3.3. Market share analysis by country

  • CHAPTER 8: ARTIFICIAL JOINTS MARKET, BY REGION

    • 8.1. Overview

      • 8.1.1. Market size and forecast By Region

    • 8.2. North America

      • 8.2.1. Key trends and opportunities

      • 8.2.2. Market size and forecast, by Type

      • 8.2.3. Market size and forecast, by Application

      • 8.2.4. Market size and forecast, by Material

      • 8.2.5. Market size and forecast, by End user

      • 8.2.6. Market size and forecast, by country

        • 8.2.6.1. U.S.
          • 8.2.6.1.1. Key market trends, growth factors and opportunities
          • 8.2.6.1.2. Market size and forecast, by Type
          • 8.2.6.1.3. Market size and forecast, by Application
          • 8.2.6.1.4. Market size and forecast, by Material
          • 8.2.6.1.5. Market size and forecast, by End user
        • 8.2.6.2. Canada
          • 8.2.6.2.1. Key market trends, growth factors and opportunities
          • 8.2.6.2.2. Market size and forecast, by Type
          • 8.2.6.2.3. Market size and forecast, by Application
          • 8.2.6.2.4. Market size and forecast, by Material
          • 8.2.6.2.5. Market size and forecast, by End user
        • 8.2.6.3. Mexico
          • 8.2.6.3.1. Key market trends, growth factors and opportunities
          • 8.2.6.3.2. Market size and forecast, by Type
          • 8.2.6.3.3. Market size and forecast, by Application
          • 8.2.6.3.4. Market size and forecast, by Material
          • 8.2.6.3.5. Market size and forecast, by End user
    • 8.3. Europe

      • 8.3.1. Key trends and opportunities

      • 8.3.2. Market size and forecast, by Type

      • 8.3.3. Market size and forecast, by Application

      • 8.3.4. Market size and forecast, by Material

      • 8.3.5. Market size and forecast, by End user

      • 8.3.6. Market size and forecast, by country

        • 8.3.6.1. Germany
          • 8.3.6.1.1. Key market trends, growth factors and opportunities
          • 8.3.6.1.2. Market size and forecast, by Type
          • 8.3.6.1.3. Market size and forecast, by Application
          • 8.3.6.1.4. Market size and forecast, by Material
          • 8.3.6.1.5. Market size and forecast, by End user
        • 8.3.6.2. France
          • 8.3.6.2.1. Key market trends, growth factors and opportunities
          • 8.3.6.2.2. Market size and forecast, by Type
          • 8.3.6.2.3. Market size and forecast, by Application
          • 8.3.6.2.4. Market size and forecast, by Material
          • 8.3.6.2.5. Market size and forecast, by End user
        • 8.3.6.3. UK
          • 8.3.6.3.1. Key market trends, growth factors and opportunities
          • 8.3.6.3.2. Market size and forecast, by Type
          • 8.3.6.3.3. Market size and forecast, by Application
          • 8.3.6.3.4. Market size and forecast, by Material
          • 8.3.6.3.5. Market size and forecast, by End user
        • 8.3.6.4. Italy
          • 8.3.6.4.1. Key market trends, growth factors and opportunities
          • 8.3.6.4.2. Market size and forecast, by Type
          • 8.3.6.4.3. Market size and forecast, by Application
          • 8.3.6.4.4. Market size and forecast, by Material
          • 8.3.6.4.5. Market size and forecast, by End user
        • 8.3.6.5. Spain
          • 8.3.6.5.1. Key market trends, growth factors and opportunities
          • 8.3.6.5.2. Market size and forecast, by Type
          • 8.3.6.5.3. Market size and forecast, by Application
          • 8.3.6.5.4. Market size and forecast, by Material
          • 8.3.6.5.5. Market size and forecast, by End user
        • 8.3.6.6. Rest of Europe
          • 8.3.6.6.1. Key market trends, growth factors and opportunities
          • 8.3.6.6.2. Market size and forecast, by Type
          • 8.3.6.6.3. Market size and forecast, by Application
          • 8.3.6.6.4. Market size and forecast, by Material
          • 8.3.6.6.5. Market size and forecast, by End user
    • 8.4. Asia-Pacific

      • 8.4.1. Key trends and opportunities

      • 8.4.2. Market size and forecast, by Type

      • 8.4.3. Market size and forecast, by Application

      • 8.4.4. Market size and forecast, by Material

      • 8.4.5. Market size and forecast, by End user

      • 8.4.6. Market size and forecast, by country

        • 8.4.6.1. Japan
          • 8.4.6.1.1. Key market trends, growth factors and opportunities
          • 8.4.6.1.2. Market size and forecast, by Type
          • 8.4.6.1.3. Market size and forecast, by Application
          • 8.4.6.1.4. Market size and forecast, by Material
          • 8.4.6.1.5. Market size and forecast, by End user
        • 8.4.6.2. China
          • 8.4.6.2.1. Key market trends, growth factors and opportunities
          • 8.4.6.2.2. Market size and forecast, by Type
          • 8.4.6.2.3. Market size and forecast, by Application
          • 8.4.6.2.4. Market size and forecast, by Material
          • 8.4.6.2.5. Market size and forecast, by End user
        • 8.4.6.3. India
          • 8.4.6.3.1. Key market trends, growth factors and opportunities
          • 8.4.6.3.2. Market size and forecast, by Type
          • 8.4.6.3.3. Market size and forecast, by Application
          • 8.4.6.3.4. Market size and forecast, by Material
          • 8.4.6.3.5. Market size and forecast, by End user
        • 8.4.6.4. Australia
          • 8.4.6.4.1. Key market trends, growth factors and opportunities
          • 8.4.6.4.2. Market size and forecast, by Type
          • 8.4.6.4.3. Market size and forecast, by Application
          • 8.4.6.4.4. Market size and forecast, by Material
          • 8.4.6.4.5. Market size and forecast, by End user
        • 8.4.6.5. Rest of Asia-Pacific
          • 8.4.6.5.1. Key market trends, growth factors and opportunities
          • 8.4.6.5.2. Market size and forecast, by Type
          • 8.4.6.5.3. Market size and forecast, by Application
          • 8.4.6.5.4. Market size and forecast, by Material
          • 8.4.6.5.5. Market size and forecast, by End user
    • 8.5. LAMEA

      • 8.5.1. Key trends and opportunities

      • 8.5.2. Market size and forecast, by Type

      • 8.5.3. Market size and forecast, by Application

      • 8.5.4. Market size and forecast, by Material

      • 8.5.5. Market size and forecast, by End user

      • 8.5.6. Market size and forecast, by country

        • 8.5.6.1. Brazil
          • 8.5.6.1.1. Key market trends, growth factors and opportunities
          • 8.5.6.1.2. Market size and forecast, by Type
          • 8.5.6.1.3. Market size and forecast, by Application
          • 8.5.6.1.4. Market size and forecast, by Material
          • 8.5.6.1.5. Market size and forecast, by End user
        • 8.5.6.2. Saudi Arabia
          • 8.5.6.2.1. Key market trends, growth factors and opportunities
          • 8.5.6.2.2. Market size and forecast, by Type
          • 8.5.6.2.3. Market size and forecast, by Application
          • 8.5.6.2.4. Market size and forecast, by Material
          • 8.5.6.2.5. Market size and forecast, by End user
        • 8.5.6.3. South Africa
          • 8.5.6.3.1. Key market trends, growth factors and opportunities
          • 8.5.6.3.2. Market size and forecast, by Type
          • 8.5.6.3.3. Market size and forecast, by Application
          • 8.5.6.3.4. Market size and forecast, by Material
          • 8.5.6.3.5. Market size and forecast, by End user
        • 8.5.6.4. Rest of LAMEA
          • 8.5.6.4.1. Key market trends, growth factors and opportunities
          • 8.5.6.4.2. Market size and forecast, by Type
          • 8.5.6.4.3. Market size and forecast, by Application
          • 8.5.6.4.4. Market size and forecast, by Material
          • 8.5.6.4.5. Market size and forecast, by End user
  • CHAPTER 9: COMPETITIVE LANDSCAPE

    • 9.1. Introduction

    • 9.2. Top winning strategies

    • 9.3. Product Mapping of Top 10 Player

    • 9.4. Competitive Dashboard

    • 9.5. Competitive Heatmap

    • 9.6. Top player positioning, 2022

  • CHAPTER 10: COMPANY PROFILES

    • 10.1. Zimmer Biomet Holding Inc.

      • 10.1.1. Company overview

      • 10.1.2. Key Executives

      • 10.1.3. Company snapshot

      • 10.1.4. Operating business segments

      • 10.1.5. Product portfolio

      • 10.1.6. Business performance

      • 10.1.7. Key strategic moves and developments

    • 10.2. Smith & Nephew plc

      • 10.2.1. Company overview

      • 10.2.2. Key Executives

      • 10.2.3. Company snapshot

      • 10.2.4. Operating business segments

      • 10.2.5. Product portfolio

      • 10.2.6. Business performance

      • 10.2.7. Key strategic moves and developments

    • 10.3. Stryker Corporation.

      • 10.3.1. Company overview

      • 10.3.2. Key Executives

      • 10.3.3. Company snapshot

      • 10.3.4. Operating business segments

      • 10.3.5. Product portfolio

      • 10.3.6. Business performance

    • 10.4. Johnson and Johnson (DePuy Synthes)

      • 10.4.1. Company overview

      • 10.4.2. Key Executives

      • 10.4.3. Company snapshot

      • 10.4.4. Operating business segments

      • 10.4.5. Product portfolio

      • 10.4.6. Business performance

      • 10.4.7. Key strategic moves and developments

    • 10.5. B. Braun Melsungen AG

      • 10.5.1. Company overview

      • 10.5.2. Key Executives

      • 10.5.3. Company snapshot

      • 10.5.4. Operating business segments

      • 10.5.5. Product portfolio

      • 10.5.6. Business performance

    • 10.6. Medtronic plc

      • 10.6.1. Company overview

      • 10.6.2. Key Executives

      • 10.6.3. Company snapshot

      • 10.6.4. Operating business segments

      • 10.6.5. Product portfolio

      • 10.6.6. Business performance

    • 10.7. Medacta International SA

      • 10.7.1. Company overview

      • 10.7.2. Key Executives

      • 10.7.3. Company snapshot

      • 10.7.4. Operating business segments

      • 10.7.5. Product portfolio

      • 10.7.6. Business performance

    • 10.8. Exactech

      • 10.8.1. Company overview

      • 10.8.2. Key Executives

      • 10.8.3. Company snapshot

      • 10.8.4. Operating business segments

      • 10.8.5. Product portfolio

      • 10.8.6. Key strategic moves and developments

    • 10.9. MicroPort Orthopedics Inc

      • 10.9.1. Company overview

      • 10.9.2. Key Executives

      • 10.9.3. Company snapshot

      • 10.9.4. Operating business segments

      • 10.9.5. Product portfolio

      • 10.9.6. Business performance

    • 10.10. Conformis Inc.

      • 10.10.1. Company overview

      • 10.10.2. Key Executives

      • 10.10.3. Company snapshot

      • 10.10.4. Operating business segments

      • 10.10.5. Product portfolio

      • 10.10.6. Key strategic moves and developments

  • LIST OF TABLES

  • TABLE 01. GLOBAL ARTIFICIAL JOINTS MARKET, BY TYPE, 2022-2032 ($MILLION)
    TABLE 02. ARTIFICIAL JOINTS MARKET FOR CEMENTED ARTIFICIAL JOINTS, BY REGION, 2022-2032 ($MILLION)
    TABLE 03. ARTIFICIAL JOINTS MARKET FOR NON-CEMENTED ARTIFICIAL JOINTS, BY REGION, 2022-2032 ($MILLION)
    TABLE 04. GLOBAL ARTIFICIAL JOINTS MARKET, BY APPLICATION, 2022-2032 ($MILLION)
    TABLE 05. ARTIFICIAL JOINTS MARKET FOR ARTIFICIAL KNEE JOINTS, BY REGION, 2022-2032 ($MILLION)
    TABLE 06. ARTIFICIAL JOINTS MARKET FOR ARTIFICIAL HIP JOINTS, BY REGION, 2022-2032 ($MILLION)
    TABLE 07. ARTIFICIAL JOINTS MARKET FOR OTHERS, BY REGION, 2022-2032 ($MILLION)
    TABLE 08. GLOBAL ARTIFICIAL JOINTS MARKET, BY MATERIAL, 2022-2032 ($MILLION)
    TABLE 09. ARTIFICIAL JOINTS MARKET FOR CERAMICS, BY REGION, 2022-2032 ($MILLION)
    TABLE 10. ARTIFICIAL JOINTS MARKET FOR ALLOY, BY REGION, 2022-2032 ($MILLION)
    TABLE 11. ARTIFICIAL JOINTS MARKET FOR OTHERS, BY REGION, 2022-2032 ($MILLION)
    TABLE 12. GLOBAL ARTIFICIAL JOINTS MARKET, BY END USER, 2022-2032 ($MILLION)
    TABLE 13. ARTIFICIAL JOINTS MARKET FOR HOSPITALS, BY REGION, 2022-2032 ($MILLION)
    TABLE 14. ARTIFICIAL JOINTS MARKET FOR OTHER, BY REGION, 2022-2032 ($MILLION)
    TABLE 15. ARTIFICIAL JOINTS MARKET, BY REGION, 2022-2032 ($MILLION)
    TABLE 16. NORTH AMERICA ARTIFICIAL JOINTS MARKET, BY TYPE, 2022-2032 ($MILLION)
    TABLE 17. NORTH AMERICA ARTIFICIAL JOINTS MARKET, BY APPLICATION, 2022-2032 ($MILLION)
    TABLE 18. NORTH AMERICA ARTIFICIAL JOINTS MARKET, BY MATERIAL, 2022-2032 ($MILLION)
    TABLE 19. NORTH AMERICA ARTIFICIAL JOINTS MARKET, BY END USER, 2022-2032 ($MILLION)
    TABLE 20. NORTH AMERICA ARTIFICIAL JOINTS MARKET, BY COUNTRY, 2022-2032 ($MILLION)
    TABLE 21. U.S. ARTIFICIAL JOINTS MARKET, BY TYPE, 2022-2032 ($MILLION)
    TABLE 22. U.S. ARTIFICIAL JOINTS MARKET, BY APPLICATION, 2022-2032 ($MILLION)
    TABLE 23. U.S. ARTIFICIAL JOINTS MARKET, BY MATERIAL, 2022-2032 ($MILLION)
    TABLE 24. U.S. ARTIFICIAL JOINTS MARKET, BY END USER, 2022-2032 ($MILLION)
    TABLE 25. CANADA ARTIFICIAL JOINTS MARKET, BY TYPE, 2022-2032 ($MILLION)
    TABLE 26. CANADA ARTIFICIAL JOINTS MARKET, BY APPLICATION, 2022-2032 ($MILLION)
    TABLE 27. CANADA ARTIFICIAL JOINTS MARKET, BY MATERIAL, 2022-2032 ($MILLION)
    TABLE 28. CANADA ARTIFICIAL JOINTS MARKET, BY END USER, 2022-2032 ($MILLION)
    TABLE 29. MEXICO ARTIFICIAL JOINTS MARKET, BY TYPE, 2022-2032 ($MILLION)
    TABLE 30. MEXICO ARTIFICIAL JOINTS MARKET, BY APPLICATION, 2022-2032 ($MILLION)
    TABLE 31. MEXICO ARTIFICIAL JOINTS MARKET, BY MATERIAL, 2022-2032 ($MILLION)
    TABLE 32. MEXICO ARTIFICIAL JOINTS MARKET, BY END USER, 2022-2032 ($MILLION)
    TABLE 33. EUROPE ARTIFICIAL JOINTS MARKET, BY TYPE, 2022-2032 ($MILLION)
    TABLE 34. EUROPE ARTIFICIAL JOINTS MARKET, BY APPLICATION, 2022-2032 ($MILLION)
    TABLE 35. EUROPE ARTIFICIAL JOINTS MARKET, BY MATERIAL, 2022-2032 ($MILLION)
    TABLE 36. EUROPE ARTIFICIAL JOINTS MARKET, BY END USER, 2022-2032 ($MILLION)
    TABLE 37. EUROPE ARTIFICIAL JOINTS MARKET, BY COUNTRY, 2022-2032 ($MILLION)
    TABLE 38. GERMANY ARTIFICIAL JOINTS MARKET, BY TYPE, 2022-2032 ($MILLION)
    TABLE 39. GERMANY ARTIFICIAL JOINTS MARKET, BY APPLICATION, 2022-2032 ($MILLION)
    TABLE 40. GERMANY ARTIFICIAL JOINTS MARKET, BY MATERIAL, 2022-2032 ($MILLION)
    TABLE 41. GERMANY ARTIFICIAL JOINTS MARKET, BY END USER, 2022-2032 ($MILLION)
    TABLE 42. FRANCE ARTIFICIAL JOINTS MARKET, BY TYPE, 2022-2032 ($MILLION)
    TABLE 43. FRANCE ARTIFICIAL JOINTS MARKET, BY APPLICATION, 2022-2032 ($MILLION)
    TABLE 44. FRANCE ARTIFICIAL JOINTS MARKET, BY MATERIAL, 2022-2032 ($MILLION)
    TABLE 45. FRANCE ARTIFICIAL JOINTS MARKET, BY END USER, 2022-2032 ($MILLION)
    TABLE 46. UK ARTIFICIAL JOINTS MARKET, BY TYPE, 2022-2032 ($MILLION)
    TABLE 47. UK ARTIFICIAL JOINTS MARKET, BY APPLICATION, 2022-2032 ($MILLION)
    TABLE 48. UK ARTIFICIAL JOINTS MARKET, BY MATERIAL, 2022-2032 ($MILLION)
    TABLE 49. UK ARTIFICIAL JOINTS MARKET, BY END USER, 2022-2032 ($MILLION)
    TABLE 50. ITALY ARTIFICIAL JOINTS MARKET, BY TYPE, 2022-2032 ($MILLION)
    TABLE 51. ITALY ARTIFICIAL JOINTS MARKET, BY APPLICATION, 2022-2032 ($MILLION)
    TABLE 52. ITALY ARTIFICIAL JOINTS MARKET, BY MATERIAL, 2022-2032 ($MILLION)
    TABLE 53. ITALY ARTIFICIAL JOINTS MARKET, BY END USER, 2022-2032 ($MILLION)
    TABLE 54. SPAIN ARTIFICIAL JOINTS MARKET, BY TYPE, 2022-2032 ($MILLION)
    TABLE 55. SPAIN ARTIFICIAL JOINTS MARKET, BY APPLICATION, 2022-2032 ($MILLION)
    TABLE 56. SPAIN ARTIFICIAL JOINTS MARKET, BY MATERIAL, 2022-2032 ($MILLION)
    TABLE 57. SPAIN ARTIFICIAL JOINTS MARKET, BY END USER, 2022-2032 ($MILLION)
    TABLE 58. REST OF EUROPE ARTIFICIAL JOINTS MARKET, BY TYPE, 2022-2032 ($MILLION)
    TABLE 59. REST OF EUROPE ARTIFICIAL JOINTS MARKET, BY APPLICATION, 2022-2032 ($MILLION)
    TABLE 60. REST OF EUROPE ARTIFICIAL JOINTS MARKET, BY MATERIAL, 2022-2032 ($MILLION)
    TABLE 61. REST OF EUROPE ARTIFICIAL JOINTS MARKET, BY END USER, 2022-2032 ($MILLION)
    TABLE 62. ASIA-PACIFIC ARTIFICIAL JOINTS MARKET, BY TYPE, 2022-2032 ($MILLION)
    TABLE 63. ASIA-PACIFIC ARTIFICIAL JOINTS MARKET, BY APPLICATION, 2022-2032 ($MILLION)
    TABLE 64. ASIA-PACIFIC ARTIFICIAL JOINTS MARKET, BY MATERIAL, 2022-2032 ($MILLION)
    TABLE 65. ASIA-PACIFIC ARTIFICIAL JOINTS MARKET, BY END USER, 2022-2032 ($MILLION)
    TABLE 66. ASIA-PACIFIC ARTIFICIAL JOINTS MARKET, BY COUNTRY, 2022-2032 ($MILLION)
    TABLE 67. JAPAN ARTIFICIAL JOINTS MARKET, BY TYPE, 2022-2032 ($MILLION)
    TABLE 68. JAPAN ARTIFICIAL JOINTS MARKET, BY APPLICATION, 2022-2032 ($MILLION)
    TABLE 69. JAPAN ARTIFICIAL JOINTS MARKET, BY MATERIAL, 2022-2032 ($MILLION)
    TABLE 70. JAPAN ARTIFICIAL JOINTS MARKET, BY END USER, 2022-2032 ($MILLION)
    TABLE 71. CHINA ARTIFICIAL JOINTS MARKET, BY TYPE, 2022-2032 ($MILLION)
    TABLE 72. CHINA ARTIFICIAL JOINTS MARKET, BY APPLICATION, 2022-2032 ($MILLION)
    TABLE 73. CHINA ARTIFICIAL JOINTS MARKET, BY MATERIAL, 2022-2032 ($MILLION)
    TABLE 74. CHINA ARTIFICIAL JOINTS MARKET, BY END USER, 2022-2032 ($MILLION)
    TABLE 75. INDIA ARTIFICIAL JOINTS MARKET, BY TYPE, 2022-2032 ($MILLION)
    TABLE 76. INDIA ARTIFICIAL JOINTS MARKET, BY APPLICATION, 2022-2032 ($MILLION)
    TABLE 77. INDIA ARTIFICIAL JOINTS MARKET, BY MATERIAL, 2022-2032 ($MILLION)
    TABLE 78. INDIA ARTIFICIAL JOINTS MARKET, BY END USER, 2022-2032 ($MILLION)
    TABLE 79. AUSTRALIA ARTIFICIAL JOINTS MARKET, BY TYPE, 2022-2032 ($MILLION)
    TABLE 80. AUSTRALIA ARTIFICIAL JOINTS MARKET, BY APPLICATION, 2022-2032 ($MILLION)
    TABLE 81. AUSTRALIA ARTIFICIAL JOINTS MARKET, BY MATERIAL, 2022-2032 ($MILLION)
    TABLE 82. AUSTRALIA ARTIFICIAL JOINTS MARKET, BY END USER, 2022-2032 ($MILLION)
    TABLE 83. REST OF ASIA-PACIFIC ARTIFICIAL JOINTS MARKET, BY TYPE, 2022-2032 ($MILLION)
    TABLE 84. REST OF ASIA-PACIFIC ARTIFICIAL JOINTS MARKET, BY APPLICATION, 2022-2032 ($MILLION)
    TABLE 85. REST OF ASIA-PACIFIC ARTIFICIAL JOINTS MARKET, BY MATERIAL, 2022-2032 ($MILLION)
    TABLE 86. REST OF ASIA-PACIFIC ARTIFICIAL JOINTS MARKET, BY END USER, 2022-2032 ($MILLION)
    TABLE 87. LAMEA ARTIFICIAL JOINTS MARKET, BY TYPE, 2022-2032 ($MILLION)
    TABLE 88. LAMEA ARTIFICIAL JOINTS MARKET, BY APPLICATION, 2022-2032 ($MILLION)
    TABLE 89. LAMEA ARTIFICIAL JOINTS MARKET, BY MATERIAL, 2022-2032 ($MILLION)
    TABLE 90. LAMEA ARTIFICIAL JOINTS MARKET, BY END USER, 2022-2032 ($MILLION)
    TABLE 91. LAMEA ARTIFICIAL JOINTS MARKET, BY COUNTRY, 2022-2032 ($MILLION)
    TABLE 92. BRAZIL ARTIFICIAL JOINTS MARKET, BY TYPE, 2022-2032 ($MILLION)
    TABLE 93. BRAZIL ARTIFICIAL JOINTS MARKET, BY APPLICATION, 2022-2032 ($MILLION)
    TABLE 94. BRAZIL ARTIFICIAL JOINTS MARKET, BY MATERIAL, 2022-2032 ($MILLION)
    TABLE 95. BRAZIL ARTIFICIAL JOINTS MARKET, BY END USER, 2022-2032 ($MILLION)
    TABLE 96. SAUDI ARABIA ARTIFICIAL JOINTS MARKET, BY TYPE, 2022-2032 ($MILLION)
    TABLE 97. SAUDI ARABIA ARTIFICIAL JOINTS MARKET, BY APPLICATION, 2022-2032 ($MILLION)
    TABLE 98. SAUDI ARABIA ARTIFICIAL JOINTS MARKET, BY MATERIAL, 2022-2032 ($MILLION)
    TABLE 99. SAUDI ARABIA ARTIFICIAL JOINTS MARKET, BY END USER, 2022-2032 ($MILLION)
    TABLE 100. SOUTH AFRICA ARTIFICIAL JOINTS MARKET, BY TYPE, 2022-2032 ($MILLION)
    TABLE 101. SOUTH AFRICA ARTIFICIAL JOINTS MARKET, BY APPLICATION, 2022-2032 ($MILLION)
    TABLE 102. SOUTH AFRICA ARTIFICIAL JOINTS MARKET, BY MATERIAL, 2022-2032 ($MILLION)
    TABLE 103. SOUTH AFRICA ARTIFICIAL JOINTS MARKET, BY END USER, 2022-2032 ($MILLION)
    TABLE 104. REST OF LAMEA ARTIFICIAL JOINTS MARKET, BY TYPE, 2022-2032 ($MILLION)
    TABLE 105. REST OF LAMEA ARTIFICIAL JOINTS MARKET, BY APPLICATION, 2022-2032 ($MILLION)
    TABLE 106. REST OF LAMEA ARTIFICIAL JOINTS MARKET, BY MATERIAL, 2022-2032 ($MILLION)
    TABLE 107. REST OF LAMEA ARTIFICIAL JOINTS MARKET, BY END USER, 2022-2032 ($MILLION)
    TABLE 108. ZIMMER BIOMET HOLDING INC.: KEY EXECUTIVES
    TABLE 109. ZIMMER BIOMET HOLDING INC.: COMPANY SNAPSHOT
    TABLE 110. ZIMMER BIOMET HOLDING INC.: PRODUCT SEGMENTS
    TABLE 111. ZIMMER BIOMET HOLDING INC.: PRODUCT PORTFOLIO
    TABLE 112. ZIMMER BIOMET HOLDING INC.: KEY STRATERGIES
    TABLE 113. SMITH & NEPHEW PLC: KEY EXECUTIVES
    TABLE 114. SMITH & NEPHEW PLC: COMPANY SNAPSHOT
    TABLE 115. SMITH & NEPHEW PLC: PRODUCT SEGMENTS
    TABLE 116. SMITH & NEPHEW PLC: PRODUCT PORTFOLIO
    TABLE 117. SMITH & NEPHEW PLC: KEY STRATERGIES
    TABLE 118. STRYKER CORPORATION.: KEY EXECUTIVES
    TABLE 119. STRYKER CORPORATION.: COMPANY SNAPSHOT
    TABLE 120. STRYKER CORPORATION.: PRODUCT SEGMENTS
    TABLE 121. STRYKER CORPORATION.: PRODUCT PORTFOLIO
    TABLE 122. JOHNSON AND JOHNSON (DEPUY SYNTHES): KEY EXECUTIVES
    TABLE 123. JOHNSON AND JOHNSON (DEPUY SYNTHES): COMPANY SNAPSHOT
    TABLE 124. JOHNSON AND JOHNSON (DEPUY SYNTHES): PRODUCT SEGMENTS
    TABLE 125. JOHNSON AND JOHNSON (DEPUY SYNTHES): PRODUCT PORTFOLIO
    TABLE 126. JOHNSON AND JOHNSON (DEPUY SYNTHES): KEY STRATERGIES
    TABLE 127. B. BRAUN MELSUNGEN AG: KEY EXECUTIVES
    TABLE 128. B. BRAUN MELSUNGEN AG: COMPANY SNAPSHOT
    TABLE 129. B. BRAUN MELSUNGEN AG: PRODUCT SEGMENTS
    TABLE 130. B. BRAUN MELSUNGEN AG: PRODUCT PORTFOLIO
    TABLE 131. MEDTRONIC PLC: KEY EXECUTIVES
    TABLE 132. MEDTRONIC PLC: COMPANY SNAPSHOT
    TABLE 133. MEDTRONIC PLC: PRODUCT SEGMENTS
    TABLE 134. MEDTRONIC PLC: PRODUCT PORTFOLIO
    TABLE 135. MEDACTA INTERNATIONAL SA: KEY EXECUTIVES
    TABLE 136. MEDACTA INTERNATIONAL SA: COMPANY SNAPSHOT
    TABLE 137. MEDACTA INTERNATIONAL SA: PRODUCT SEGMENTS
    TABLE 138. MEDACTA INTERNATIONAL SA: PRODUCT PORTFOLIO
    TABLE 139. EXACTECH: KEY EXECUTIVES
    TABLE 140. EXACTECH: COMPANY SNAPSHOT
    TABLE 141. EXACTECH: PRODUCT SEGMENTS
    TABLE 142. EXACTECH: PRODUCT PORTFOLIO
    TABLE 143. EXACTECH: KEY STRATERGIES
    TABLE 144. MICROPORT ORTHOPEDICS INC: KEY EXECUTIVES
    TABLE 145. MICROPORT ORTHOPEDICS INC: COMPANY SNAPSHOT
    TABLE 146. MICROPORT ORTHOPEDICS INC: PRODUCT SEGMENTS
    TABLE 147. MICROPORT ORTHOPEDICS INC: PRODUCT PORTFOLIO
    TABLE 148. CONFORMIS INC.: KEY EXECUTIVES
    TABLE 149. CONFORMIS INC.: COMPANY SNAPSHOT
    TABLE 150. CONFORMIS INC.: PRODUCT SEGMENTS
    TABLE 151. CONFORMIS INC.: PRODUCT PORTFOLIO
    TABLE 152. CONFORMIS INC.: KEY STRATERGIES
  • LIST OF FIGURES

  • FIGURE 01. ARTIFICIAL JOINTS MARKET, 2022-2032
    FIGURE 02. SEGMENTATION OF ARTIFICIAL JOINTS MARKET, 2022-2032
    FIGURE 03. TOP INVESTMENT POCKETS IN ARTIFICIAL JOINTS MARKET (2023-2032)
    FIGURE 04. LOW BARGAINING POWER OF SUPPLIERS
    FIGURE 05. LOW THREAT OF NEW ENTRANTS
    FIGURE 06. LOW THREAT OF SUBSTITUTES
    FIGURE 07. LOW INTENSITY OF RIVALRY
    FIGURE 08. LOW BARGAINING POWER OF BUYERS
    FIGURE 09. DRIVERS, RESTRAINTS AND OPPORTUNITIES: GLOBALARTIFICIAL JOINTS MARKET
    FIGURE 09. ARTIFICIAL JOINTS MARKET, BY TYPE, 2022(%)
    FIGURE 10. COMPARATIVE SHARE ANALYSIS OF ARTIFICIAL JOINTS MARKET FOR CEMENTED ARTIFICIAL JOINTS, BY COUNTRY 2022 AND 2032(%)
    FIGURE 11. COMPARATIVE SHARE ANALYSIS OF ARTIFICIAL JOINTS MARKET FOR NON-CEMENTED ARTIFICIAL JOINTS, BY COUNTRY 2022 AND 2032(%)
    FIGURE 12. ARTIFICIAL JOINTS MARKET, BY APPLICATION, 2022(%)
    FIGURE 13. COMPARATIVE SHARE ANALYSIS OF ARTIFICIAL JOINTS MARKET FOR ARTIFICIAL KNEE JOINTS, BY COUNTRY 2022 AND 2032(%)
    FIGURE 14. COMPARATIVE SHARE ANALYSIS OF ARTIFICIAL JOINTS MARKET FOR ARTIFICIAL HIP JOINTS, BY COUNTRY 2022 AND 2032(%)
    FIGURE 15. COMPARATIVE SHARE ANALYSIS OF ARTIFICIAL JOINTS MARKET FOR OTHERS, BY COUNTRY 2022 AND 2032(%)
    FIGURE 16. ARTIFICIAL JOINTS MARKET, BY MATERIAL, 2022(%)
    FIGURE 17. COMPARATIVE SHARE ANALYSIS OF ARTIFICIAL JOINTS MARKET FOR CERAMICS, BY COUNTRY 2022 AND 2032(%)
    FIGURE 18. COMPARATIVE SHARE ANALYSIS OF ARTIFICIAL JOINTS MARKET FOR ALLOY, BY COUNTRY 2022 AND 2032(%)
    FIGURE 19. COMPARATIVE SHARE ANALYSIS OF ARTIFICIAL JOINTS MARKET FOR OTHERS, BY COUNTRY 2022 AND 2032(%)
    FIGURE 20. ARTIFICIAL JOINTS MARKET, BY END USER, 2022(%)
    FIGURE 21. COMPARATIVE SHARE ANALYSIS OF ARTIFICIAL JOINTS MARKET FOR HOSPITALS, BY COUNTRY 2022 AND 2032(%)
    FIGURE 22. COMPARATIVE SHARE ANALYSIS OF ARTIFICIAL JOINTS MARKET FOR OTHER, BY COUNTRY 2022 AND 2032(%)
    FIGURE 23. ARTIFICIAL JOINTS MARKET BY REGION, 2022
    FIGURE 24. U.S. ARTIFICIAL JOINTS MARKET, 2022-2032 ($MILLION)
    FIGURE 25. CANADA ARTIFICIAL JOINTS MARKET, 2022-2032 ($MILLION)
    FIGURE 26. MEXICO ARTIFICIAL JOINTS MARKET, 2022-2032 ($MILLION)
    FIGURE 27. GERMANY ARTIFICIAL JOINTS MARKET, 2022-2032 ($MILLION)
    FIGURE 28. FRANCE ARTIFICIAL JOINTS MARKET, 2022-2032 ($MILLION)
    FIGURE 29. UK ARTIFICIAL JOINTS MARKET, 2022-2032 ($MILLION)
    FIGURE 30. ITALY ARTIFICIAL JOINTS MARKET, 2022-2032 ($MILLION)
    FIGURE 31. SPAIN ARTIFICIAL JOINTS MARKET, 2022-2032 ($MILLION)
    FIGURE 32. REST OF EUROPE ARTIFICIAL JOINTS MARKET, 2022-2032 ($MILLION)
    FIGURE 33. JAPAN ARTIFICIAL JOINTS MARKET, 2022-2032 ($MILLION)
    FIGURE 34. CHINA ARTIFICIAL JOINTS MARKET, 2022-2032 ($MILLION)
    FIGURE 35. INDIA ARTIFICIAL JOINTS MARKET, 2022-2032 ($MILLION)
    FIGURE 36. AUSTRALIA ARTIFICIAL JOINTS MARKET, 2022-2032 ($MILLION)
    FIGURE 37. REST OF ASIA-PACIFIC ARTIFICIAL JOINTS MARKET, 2022-2032 ($MILLION)
    FIGURE 38. BRAZIL ARTIFICIAL JOINTS MARKET, 2022-2032 ($MILLION)
    FIGURE 39. SAUDI ARABIA ARTIFICIAL JOINTS MARKET, 2022-2032 ($MILLION)
    FIGURE 40. SOUTH AFRICA ARTIFICIAL JOINTS MARKET, 2022-2032 ($MILLION)
    FIGURE 41. REST OF LAMEA ARTIFICIAL JOINTS MARKET, 2022-2032 ($MILLION)
    FIGURE 42. TOP WINNING STRATEGIES, BY YEAR
    FIGURE 43. TOP WINNING STRATEGIES, BY DEVELOPMENT
    FIGURE 44. TOP WINNING STRATEGIES, BY COMPANY
    FIGURE 45. PRODUCT MAPPING OF TOP 10 PLAYERS
    FIGURE 46. COMPETITIVE DASHBOARD
    FIGURE 47. COMPETITIVE HEATMAP: ARTIFICIAL JOINTS MARKET
    FIGURE 48. TOP PLAYER POSITIONING, 2022
    FIGURE 49. ZIMMER BIOMET HOLDING INC.: NET SALES, 2020-2022 ($MILLION)
    FIGURE 50. ZIMMER BIOMET HOLDING INC.: REVENUE SHARE BY REGION, 2022 (%)
    FIGURE 51. ZIMMER BIOMET HOLDING INC.: REVENUE SHARE BY SEGMENT, 2022 (%)
    FIGURE 52. SMITH & NEPHEW PLC: NET REVENUE, 2020-2022 ($MILLION)
    FIGURE 53. SMITH & NEPHEW PLC: REVENUE SHARE BY SEGMENT, 2022 (%)
    FIGURE 54. SMITH & NEPHEW PLC: REVENUE SHARE BY REGION, 2022 (%)
    FIGURE 55. STRYKER CORPORATION.: NET REVENUE, 2020-2022 ($MILLION)
    FIGURE 56. STRYKER CORPORATION.: REVENUE SHARE BY SEGMENT, 2022 (%)
    FIGURE 57. STRYKER CORPORATION.: REVENUE SHARE BY REGION, 2022 (%)
    FIGURE 58. JOHNSON AND JOHNSON (DEPUY SYNTHES): NET REVENUE, 2019-2021 ($MILLION)
    FIGURE 59. JOHNSON AND JOHNSON (DEPUY SYNTHES): REVENUE SHARE BY SEGMENT, 2021 (%)
    FIGURE 60. JOHNSON AND JOHNSON (DEPUY SYNTHES): REVENUE SHARE BY REGION, 2021 (%)
    FIGURE 61. B. BRAUN MELSUNGEN AG: NET SALES, 2020-2022 ($MILLION)
    FIGURE 62. B. BRAUN MELSUNGEN AG: REVENUE SHARE BY REGION, 2022 (%)
    FIGURE 63. B. BRAUN MELSUNGEN AG: REVENUE SHARE BY SEGMENT, 2022 (%)
    FIGURE 64. MEDTRONIC PLC: NET SALES, 2020-2022 ($MILLION)
    FIGURE 65. MEDTRONIC PLC: REVENUE SHARE BY SEGMENT, 2022 (%)
    FIGURE 66. MEDTRONIC PLC: REVENUE SHARE BY REGION, 2022 (%)


PURCHASE OPTIONS

Call or Email us

U.S.-Canada Toll-free: +1-800-792-5285
Int'l : +1-503-894-6022
Europe : +44-845-528-1300
Email : help@alliedmarketresearch.com
 
FREQUENTLY ASKED QUESTIONS?

A. The top companies that hold the market share in artificial joints market are Zimmer Biomet, Smith & Nephew, Stryker Corporation, DePuy Synthes, B. Braun and Aesculap.

A. North America is anticipated to witness lucrative growth during the forecast period, owing to rise in expenditure by government organization to develop the healthcare sector, increase in the prevalence of orthopedic diseases and increase in the number of geriatric populations.

A. The key trends in the artificial joints market are increase in number of knee replacement surgeries and rise in number of populations suffering from osteoarthritis.

A. 10 artificial joints companies are profiled in the report.

A. The total market value of artificial joints market is $20,235.51 million in 2022.

A. The forecast period in the report is from 2023 to 2032.

A. High cost of joint replacement surgery is restraining factor for artificial joints market.

Looking for Customization?

 Customization Request

Have a Question?

 Speak with Analyst

Any Confusion?

 Inquire Before Buying

Have a glance of the Report

  Request Sample
RELATED TAGS

Purchase Full Report of
Artificial Joints Market

Start reading instantly.
This Report and over 66,965+ more Reports, Available with Avenue Library. T&C*.

  • Online Only
  • $3,570
  • Online cloud access only
  • Restricted print, copy, paste & download
  • Read only
  • Free industry update
    (Within 180 days)
  • Free report update in next update cycle
    (Jun 2024 - Jun 2025)
  • Data Pack
  • $3,840
  • Restricted to one authorized user
  • One print only
  • Available in
    Excel
  • Free industry update
    (Within 180 days)
  •   Free report update in next update cycle
    (Jun 2024 - Jun 2025)
  • Single User
  • $5,730
  • Restricted to one authorized user
  • One print only
  • Available in
    PDF
  • Free industry update
    (Within 180 days)
  •   Free report update in next update cycle
    (Jun 2024 - Jun 2025)
  • Five Users
  • $6,450
  • Limited to five authorized users
  • Print upto five copies
  • Available in
    PDF
  • Free industry update
    (Within 180 days)
  •   Free report update in next update cycle
    (Jun 2024 - Jun 2025)
  • Enterprise
    License/PDF

  • $9,600
  • Unlimited
    within
    company/enterprise
  • Available in Excel & PDF
  • Free industry update
    (Within 180 days)
  •   Free report update in next update cycle
    (Jun 2024 - Jun 2025)
  • Library
    Membership

  • $999 $ 1,175
    Per User/ Per month/ Billed annually
  • Published Content
    E-access
  • Company Profiles
    E-access
  • Newly Added Content Access
  • 10 PDF
    Downloads
  • 5 Excel Data
    Pack Downloads
  • 250 Company Profiles PDF Downloads
  • Buy Now

*Taxes/Fees, if applicable will be added during checkout. All prices in USD

RELATED REPORTS
 

Why Allied Market Research?


Infallible Methodology

To ensure high-level data integrity, accurate analysis, and impeccable forecasts

Analyst Support

For complete satisfaction

Customization

On-demand customization of scope of the report to exactly meet your needs

TARGETED MARKET VIEW

Targeted market view to provide pertinent information and save time of readers

Get fresh content delivered

Get insights on topics that are crucial for your business. Stay abreast of your interest areas.

Get Industry Data Alerts

Why Allied Market Research?

Infallible Methodology

To ensure high-level data integrity, accurate analysis, and impeccable forecasts

Analyst Support

For complete satisfaction

Customization

On-demand customization of scope of the report to exactly meet your needs

TARGETED MARKET VIEW

Targeted market view to provide pertinent information and save time of readers