Report Code: A04751 | Dec 2018 | Pages: 213 | ||
Tables: 64 | Charts: 86 |
|
Pandemic disrupted the entire world and affected many industries.
Get detailed COVID-19 impact analysis on the Asean Blood Pressure Monitoring Devices Market
Request Now !
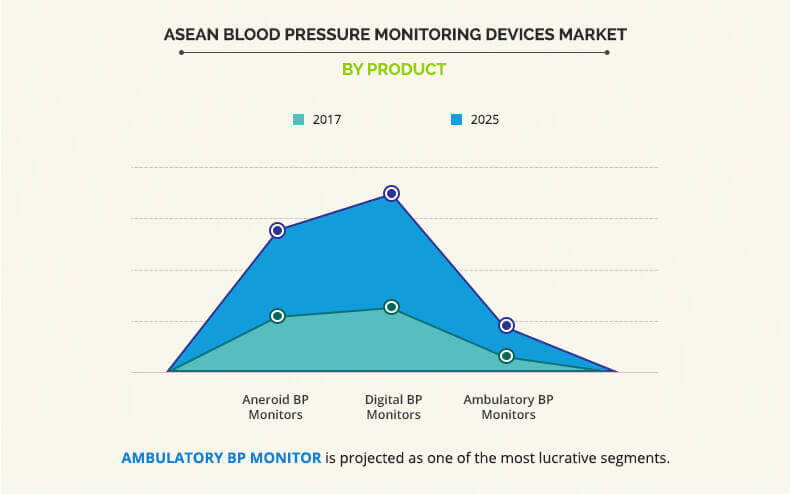
The ASEAN blood pressure monitoring devices market was valued at $31.5 million in 2017 and is expected to reach $53.3 million by 2025, registering a CAGR of 6.8% from 2018 to 2025. In terms of volume, the ambulatory BP monitors segment is expected to register the highest CAGR of 7.9% from 2018 to 2025.
Measurement of blood pressure is an important parameter that helps diagnose numerous diseases. Blood pressure was measured using the auscultatory technique initially, with the pressure in the cuff measured using a mercury sphygmomanometer. This subsequently became, and to date is recognized as, the gold standard. However, environmental concerns regarding use of mercury in the sphygmomanometer have led to a ban on the device in several developed countries such as the UK, Sweden, the Netherlands, and others. Further, use of digital and ambulatory devices has replaced sphygmomanometer for measuring blood pressure. In addition, digital BP monitors enable patients to easily monitor their blood pressure even at home.
The major key factors that drive the ASEAN blood pressure monitoring devices market include significant increase in the prevalence of hypertension, surge in demand for these devices to self-monitor blood pressure, and rise in geriatric population. However, lack of awareness about hypertension among patients in ASEAN countries and significance of blood pressure monitoring in adequate time is anticipated to hamper the growth of the ASEAN blood pressure monitoring devices market. On the contrary, increase in healthcare expenditure in emerging economies is expected to create lucrative opportunities in future.
Product segment review
Based on product, the ASEAN blood pressure monitoring devices market is categorized into aneroid BP monitors, digital BP monitors, and ambulatory BP monitors. The digital BP monitors segment was the highest contributor to the market in 2017 and is anticipated to maintain its dominance throughout the forecast period. This was attributed to the fact that digital BP monitors are easy to use as compared to other blood pressure monitoring devices. In addition, they are small enough to fit in the hands of a patient to enable fast and accurate readings.
Country segment review
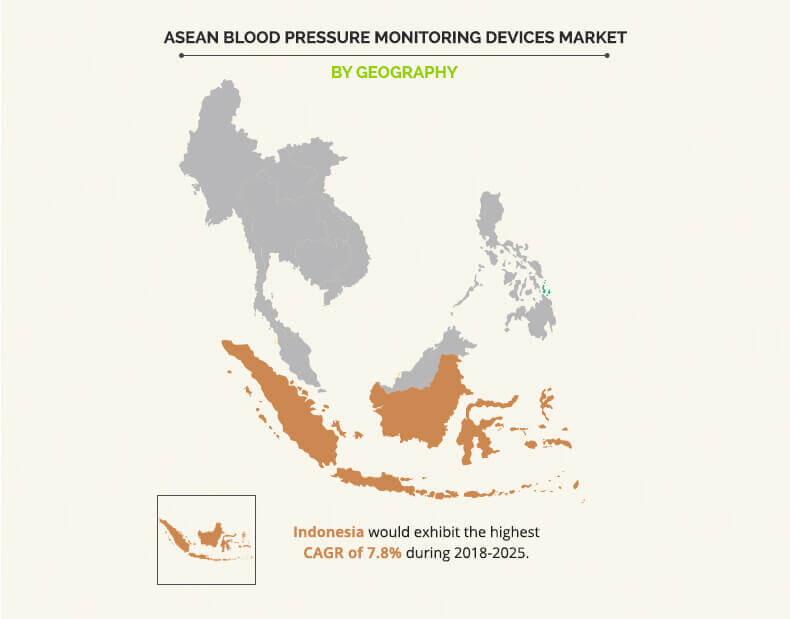
Based on country, the ASEAN blood pressure monitoring devices market is analyzed across Malaysia, Indonesia, Thailand, Vietnam, Philippines, and rest of ASEAN countries. Malaysia dominated the market in 2017, accounting for the highest share, and is anticipated to maintain this trend throughout the forecast period, owing to the significant increase in healthcare expenditure and high adoption of advanced medical technology. However, Indonesia is projected to register the highest growth rate from 2018 to 2025 owing to surge in prevalence of hypertension in this region
The report provides a comprehensive analysis of the leading companies operating in the ASEAN market such as A&D Company, Limited, Contec Medical Systems Co. Ltd., GE Healthcare, Hill Rom Holdings, Inc., Koninklijke Philips N.V., Masimo Corporation, Nihon Kohden Corporation, Omron Corporation, Smiths Group Plc., and Halma PLC.
The other players in the value chain include SunTech Medical, Rossmax International Ltd, Spacelabs Healthcare Inc., Panasonic Corporation, and Microlife AG.
Key Benefits for ASEAN Blood Pressure Monitoring Devices Market:
The study provides an in-depth analysis of the ASEAN blood pressure monitoring devices market with the current trends and future estimations to elucidate the imminent investment pockets.
A comprehensive analysis of the factors that drive and restrict the market growth is provided.
A comprehensive quantitative analysis of the industry is provided from 2018 to 2025 to assist stakeholders to capitalize on the prevailing market opportunities.
An extensive analysis of the key segments of the industry helps understand the trends in the ASEAN blood pressure monitoring devices market.
Key players and their strategies are provided to understand the competitive outlook of the industry.
ASEAN Blood Pressure Monitoring Devices Market Report Highlights
Aspects | Details |
---|---|
By Product |
|
By Country |
|
Key Market Players | NIHON KOHDEN CORPORATION, KONINKLIJKE PHILIPS N.V., SMITHS GROUP PLC., HILL ROM HOLDINGS, INC., HALMA PLC., OMRON CORPORATION, GE HEALTHCARE, MASIMO CORPORATION, A&D COMPANY, LIMITED, CONTEC MEDICAL SYSTEMS CO. LTD |
CHAPTER 1:Â Â Â INTRODUCTION
1.1.   Report description
1.2.   Key benefits for stakeholders
1.3.   Key market segments
1.4.   Research methodology
1.4.1.   Secondary research
1.4.2.   Primary research
1.4.3.   Analyst tools & models
CHAPTER 2:Â Â Â EXECUTIVE SUMMARY
2.1.   CXO perspective
CHAPTER 3:Â Â Â MARKET OVERVIEW
3.1.   Market definition and scope
3.2.   Key findings
3.2.1.   Top Winning Strategies
3.3.   Porter’s five forces analysis
3.4.   Market dynamics
3.4.1.   Drivers
3.4.1.1.   Increase in geriatric population
3.4.1.2.   Surge in prevalence of hypertension
3.4.1.3.   Rise in demand for portable monitoring devices
3.4.2.   Restraint
3.4.2.1.   Lack of awareness in developing countries
3.4.3.   Opportunities
3.4.3.1.   Increase in healthcare expenditure in emerging economies
3.4.3.2.   Proactive monitoring
CHAPTER 4:Â Â Â BLOOD PRESSURE MONITORING DEVICES MARKET, BY PRODUCT
4.1.   Overview
4.1.1.   Market size and forecast
4.2.   Aneroid BP monitors
4.2.1.   Key trends and opportunities
4.2.2.   Market size and forecast
4.3.   Digital blood pressure monitors
4.3.1.   Key trends and opportunities
4.3.2.   Market size and forecast
4.4.   Ambulatory BP monitors
4.4.1.   Key trends and opportunities
4.4.2.   Market size and forecast
CHAPTER 5:Â Â Â BLOOD PRESSURE MONITORING DEVICES MARKET, BY COUNTRY
5.1.   Overview
5.1.1.   Distribution Cost Analysis
5.1.2.   Market size and forecast
5.2.   Malaysia
5.2.1.   Key trends and opportunities
5.2.2.   Top Player
5.2.3.   Competitive Landscape
5.2.4.   Distribution Channels
5.2.5.   Malaysia market size and forecast, by product
5.2.6.   Malaysia market size and forecast, by city
5.2.6.1.   Kuala Lumpur
5.2.6.1.1.   Kuala Lumpur market size and forecast
5.2.6.2.   George Town of Penang
5.2.6.2.1.   George Town of Penang market size and forecast
5.2.6.3.   Ipoh
5.2.6.3.1.   Ipoh market size and forecast
5.2.6.4.   Rest of Malaysia
5.2.6.4.1.   Rest of Malaysia market size and forecast
5.3.   Indonesia
5.3.1.   Key trends and opportunities
5.3.2.   Top Player
5.3.3.   Competitive landscape
5.3.4.   Distribution channels
5.3.5.   Indonesia market size and forecast, by product
5.3.6.   Indonesia market size and forecast, by city
5.3.6.1.   Jakarta
5.3.6.1.1.   Jakarta market size and forecast
5.3.6.2.   Surabaya
5.3.6.2.1.   Surabaya market size and forecast
5.3.6.3.   Bandung
5.3.6.3.1.   Bandung market size and forecast
5.3.6.4.   Rest of Indonesia
5.3.6.4.1.   Rest of Indonesia market size and forecast
5.4.   THAILAND
5.4.1.   Key trends and opportunities
5.4.2.   Top Player
5.4.3.   Competitive landscape
5.4.4.   Distribution channels
5.4.5.   Thailand market size and forecast by product
5.4.6.   Thailand market size and forecast by city
5.4.6.1.   Bangkok
5.4.6.1.1.   Bangkok market size and forecast
5.4.6.2.   Nonthaburi
5.4.6.2.1.   Nonthaburi market size and forecast
5.4.6.3.   Nakhon Ratchasima
5.4.6.3.1.   Nakhon Ratchasima market size and forecast
5.4.6.4.   Rest of Thailand
5.4.6.4.1.   Rest of Thailand market size and forecast
5.5.   PHILIPPINES
5.5.1.   Key market trends and opportunities
5.5.2.   Top Player
5.5.3.   Competitive landscape
5.5.4.   Distribution channels
5.5.5.   Philippines market size and forecast, by product
5.5.6.   Philippines market size and forecast, by city
5.5.6.1.   Quezon City
5.5.6.1.1.   Quezon City market size and forecast
5.5.6.2.   Manila
5.5.6.2.1.   Manila market size and forecast
5.5.6.3.   Caloocan market size and forecast
5.5.6.3.1.   Caloocan market size and forecast
5.5.6.4.   Rest of Philippines
5.5.6.4.1.   Rest of Philippines market size and forecast
5.6.   Vietnam
5.6.1.   Key market trends and opportunities
5.6.2.   Top Player
5.6.3.   Competitive landscape
5.6.4.   Distribution channels
5.6.5.   Vietnam market size and forecast, by product
5.6.6.   Vietnam market size and forecast, by city
5.6.6.1.   Da Nang
5.6.6.1.1.   Da Nang market size and forecast
5.6.6.2.   Hanoi
5.6.6.2.1.   Hanoi market size and forecast
5.6.6.3.   Ho Chi Minh City
5.6.6.3.1.   Ho Chi Minh City market size and forecast
5.6.6.4.   Rest of Vietnam
5.6.6.4.1.   Rest of Vietnam market size and forecast
5.7.   Rest of ASEAN Countries
5.7.1.   Rest of ASEAN countries market size and forecast, by product
5.7.1.1.   Rest of ASEAN countries market size and forecast, by city
5.7.2.   Singapore
5.7.2.1.   Singapore market size and forecast
5.7.3.   Laos
5.7.3.1.   Laos market size and forecast
5.7.4.   Cambodia
5.7.4.1.   Cambodia market size and forecast
5.7.5.   Myanmar
5.7.5.1.   Myanmar market size and forecast
5.7.6.   Brunei
5.7.6.1.   Brunei market size and forecast
CHAPTER 6:Â Â Â COMPANY PROFILES
6.1.   A&D COMPANY, LIMITED
6.1.1.   Company overview
6.1.2.   Company snapshot
6.1.3.   Operating business segments
6.1.4.   Product portfolio
6.1.5.   Business performance
6.1.6.   Key strategic moves and developments
6.2.   CONTEC MEDICAL SYSTEMS CO. LTD
6.2.1.   Company overview
6.2.2.   Company snapshot
6.2.3.   Operating business segments
6.2.4.   Product portfolio
6.2.5.   Business performance
6.3.   GE HEALTHCARE
6.3.1.   Company overview
6.3.2.   Company snapshot
6.3.3.   Operating business segments
6.3.4.   Product portfolio
6.3.5.   Business performance
6.4.   HILL ROM HOLDINGS, INC.
6.4.1.   Company overview
6.4.2.   Hill Rom: Company snapshot
6.4.3.   Operating business segments
6.4.4.   Product portfolio
6.4.5.   Business performance
6.4.6.   Key strategic moves and developments
6.5.   KONINKLIJKE PHILIPS N.V.
6.5.1.   Company overview
6.5.2.   Company snapshot
6.5.3.   Operating business segments
6.5.4.   Product portfolio
6.5.5.   Business performance
6.5.6.   Key Strategic Moves:
6.6.   MASIMO CORPORATION
6.6.1.   Company overview
6.6.2.   Company snapshot
6.6.3.   Operating business segments
6.6.4.   Product portfolio
6.6.5.   Business performance
6.6.6.   Key Strategic Moves:
6.7.   NIHON KOHDEN CORPORATION
6.7.1.   Company overview
6.7.2.   Company snapshot
6.7.3.   Operating business segments
6.7.4.   Product portfolio
6.7.5.   Business performance
6.7.6.   Key strategic moves and developments
6.8.   OMRON CORPORATION
6.8.1.   Company overview
6.8.2.   Company snapshot
6.8.3.   Operating business segments
6.8.4.   Product portfolio
6.8.5.   Business performance
6.8.6.   Key strategic moves and developments
6.9.   SMITHS GROUP PLC.
6.9.1.   Company overview
6.9.2.   Company snapshot
6.9.3.   Operating business segments
6.9.4.   Product portfolio
6.9.5.   Business performance
6.9.6.   Key strategic moves and developments
6.10.   HALMA PLC.
6.10.1.   Company overview
6.10.2.   Company snapshot
6.10.3.   Operating business segments
6.10.4.   Product portfolio
6.10.5.   Business performance
6.10.6.   Key strategic moves and developments
LIST OF TABLES
TABLE 01.   ASEAN BLOOD PRESSURE MONITORING DEVICES MARKET, BY PRODUCT, 2017–2025 ($THOUSAND)
TABLE 02.   ASEAN BLOOD PRESSURE MONITORING DEVICES MARKET, BY PRODUCT, 2017–2025 (THOUSAND UNITS)
TABLE 03.   ASEAN BLOOD PRESSURE MONITORING DEVICES MARKET, BY COUNTRY, 2017–2025 ($THOUSAND)
TABLE 04.   ASEAN BLOOD PRESSURE MONITORING DEVICES MARKET, BY COUNTRY, 2017–2025 (THOUSAND UNITS)
TABLE 05.   DIGITAL BLOOD PRESSURE MONITOR DEVICES MARKET, BY COUNTRY, 2017–2025 ($THOUSAND)
TABLE 06.   DIGITAL BLOOD PRESSURE MONITOR DEVICES MARKET, BY COUNTRY, 2017–2025 (THOUSAND UNITS)
TABLE 07.   AMBULATORY BP MONITOR DEVICES MARKET, BY COUNTRY, 2017–2025 ($THOUSAND)
TABLE 08.   AMBULATORY BP MONITOR DEVICES MARKET, BY COUNTRY, 2017–2025 (THOUSAND UNITS)
TABLE 09.   ASEAN BLOOD PRESSURE MONITORING DEVICES MARKET, BY COUNTRY, 2017–2025 ($ THOUSAND)
TABLE 10.   ASEAN BLOOD PRESSURE MONITORING DEVICES MARKET, BY COUNTRY, 2017–2025 (THOUSAND UNITS)
TABLE 11.   MALAYSIA BLOOD PRESSURE MONITORING DEVICES MARKET, BY PRODUCT, 2017–2025 ($ THOUSAND)
TABLE 12.   MALAYSIA BLOOD PRESSURE MONITORING DEVICES MARKET, BY PRODUCT, 2017–2025 (THOUSAND UNITS)
TABLE 13.   MALAYSIA BLOOD PRESSURE MONITORING DEVICES MARKET, BY CITY, 2017–2025 ($ THOUSAND)
TABLE 14.   MALAYSIA BLOOD PRESSURE MONITORING DEVICES MARKET, BY CITY, 2017–2025 (THOUSAND UNITS)
TABLE 15.   INDONESIA BLOOD PRESSURE MONITORING DEVICES MARKET, BY PRODUCT, 2017–2025 ($ THOUSAND)
TABLE 16.   INDONESIA BLOOD PRESSURE MONITORING DEVICES MARKET, BY PRODUCT, 2017–2025 (THOUSAND UNITS)
TABLE 17.   INDONESIA BLOOD PRESSURE MONITORING DEVICES MARKET, BY CITY, 2017–2025 ($ THOUSAND)
TABLE 18.   INDONESIA BLOOD PRESSURE MONITORING DEVICES MARKET, BY CITY, 2017–2025 (THOUSAND UNITS)
TABLE 19.   THAILAND BLOOD PRESSURE MONITORING DEVICES MARKET, BY PRODUCT, 2017–2025 ($ THOUSAND)
TABLE 20.   THAILAND BLOOD PRESSURE MONITORING DEVICES MARKET, BY PRODUCT, 2017–2025 (THOUSAND UNITS)
TABLE 21.   THAILAND BLOOD PRESSURE MONITORING DEVICES MARKET, BY CITY, 2017–2025 ($ THOUSAND)
TABLE 22.   THAILAND BLOOD PRESSURE MONITORING DEVICES MARKET, BY CITY, 2017–2025 (THOUSAND UNITS)
TABLE 23.   PHILIPPINES BLOOD PRESSURE MONITORING DEVICES MARKET, BY PRODUCT, 2017–2025 ($ THOUSAND)
TABLE 24.   PHILIPPINES BLOOD PRESSURE MONITORING DEVICES MARKET, BY PRODUCT, 2017–2025 (THOUSAND UNITS)
TABLE 25.   PHILIPPINES BLOOD PRESSURE MONITORING DEVICES MARKET, BY CITY, 2017–2025 ($ THOUSAND)
TABLE 26.   PHILIPPINES BLOOD PRESSURE MONITORING DEVICES MARKET, BY CITY, 2017–2025 (THOUSAND UNITS)
TABLE 27.   VIETNAM BLOOD PRESSURE MONITORING DEVICES MARKET, BY PRODUCT, 2017–2025 ($ THOUSAND)
TABLE 28.   VIETNAM BLOOD PRESSURE MONITORING DEVICES MARKET, BY PRODUCT, 2017–2025 (THOUSAND UNITS)
TABLE 29.   VIETNAM BLOOD PRESSURE MONITORING DEVICES MARKET, BY CITY, 2017–2025 ($ THOUSAND)
TABLE 30.   VIETNAM BLOOD PRESSURE MONITORING DEVICES MARKET, BY CITY, 2017–2025 (THOUSAND UNITS)
TABLE 31.   REST OF ASEAN COUNTRIES BLOOD PRESSURE MONITORING DEVICES MARKET, BY PRODUCT, 2017–2025 ($ THOUSAND)
TABLE 32.   REST OF ASEAN COUNTRIES BLOOD PRESSURE MONITORING DEVICES MARKET, BY PRODUCT, 2017–2025 (THOUSAND UNITS)
TABLE 33.   REST OF ASEAN COUNTRIES BLOOD PRESSURE MONITORING DEVICES MARKET, 2017–2025 ($ THOUSAND)
TABLE 34.   REST OF ASEAN COUNTRIES BLOOD PRESSURE MONITORING DEVICES MARKET, 2017–2025 (THOUSAND UNITS)
TABLE 35.   A&D COMPANY: COMPANY SNAPSHOT
TABLE 36.   A&D COMPANY: OPERATING SEGMENTS
TABLE 37.   A&D COMPANY: PRODUCT PORTFOLIO
TABLE 38.   CONTEC MEDICAL: COMPANY SNAPSHOT
TABLE 39.   CONTEC MEDICAL SYSTEMS CO. LTD: OPERATING SEGMENTS
TABLE 40.   CONTEC MEDICAL: PRODUCT PORTFOLIO
TABLE 41.   GE HEALTHCARE: COMPANY SNAPSHOT
TABLE 42.   GE HEALTHCARE: OPERATING SEGMENTS
TABLE 43.   GE HELATHCARE: PRODUCT PORTFOLIO
TABLE 44.   HILL-ROM HOLDINGS, INC.: COMPANY SNAPSHOT
TABLE 45.   HILL-ROM: OPERATING SEGMENTS
TABLE 46.   HILL ROM: PRODUCT PORTFOLIO
TABLE 47.   PHILIPS: COMPANY SNAPSHOT
TABLE 48.   PHILIPS: OPERATING SEGMENTS
TABLE 49.   PHILIPS: PRODUCT PORTFOLIO
TABLE 50.   MASIMO: COMPANY SNAPSHOT
TABLE 51.   MASIMO: OPERATING SEGMENTS
TABLE 52.   MASIMO: PRODUCT PORTFOLIO
TABLE 53.   NIHON KOHDEN: COMPANY SNAPSHOT
TABLE 54.   NIHON KOHDEN: OPERATING SEGMENTS
TABLE 55.   NIHON: PRODUCT PORTFOLIO
TABLE 56.   OMRON CORPORATION: COMPANY SNAPSHOT
TABLE 57.   OMRON CORPORATION: OPERATING SEGMENTS
TABLE 58.   OMRON CORPORATION: PRODUCT PORTFOLIO
TABLE 59.   SMITHS: COMPANY SNAPSHOT
TABLE 60.   SMITHS: OPERATING SEGMENTS
TABLE 61.   SMITHS: PRODUCT PORTFOLIO
TABLE 62.   HALMA: COMPANY SNAPSHOT
TABLE 63.   HALMA: OPERATING SEGMENTS
TABLE 64.   HALMA: PRODUCT PORTFOLIO
LIST OF FIGURES
FIGURE 01.   BLOOD PRESSURE MONITORING DEVICES MARKET SEGMENTATION
FIGURE 02.   TOP WINNING STRATEGIES, BY YEAR, 2015-2018*
FIGURE 03.   TOP WINNING STRATEGIES, BY DEVELOPMENT, 2015-2018* (%)
FIGURE 04.   TOP WINNING STRATEGIES, BY COMPANY, 2015-2018*
FIGURE 05.   LOW BARGAINING POWER OF SUPPLIERS
FIGURE 06.   HIGH BARGAINING POWER OF BUYERS
FIGURE 07.   HIGH THREAT OF SUBSTITUTION
FIGURE 08.   HIGH THREAT OF NEW ENTRANTS
FIGURE 09.   HIGH COMPETITIVE RIVALRY
FIGURE 10.   BLOOD PRESSURE MONITORING DEVICES MARKET: DRIVERS, RESTRAINTS, AND OPPORTUNITIES
FIGURE 11.   CHANNELS OF ENTRY INTO THE MALAYSIAN HEALTH INDUSTRY INCLUDE:
FIGURE 12.   KUALA LUMPUR BLOOD PRESSURE MONITORING DEVICES MARKET, 2017–2025 ($ THOUSAND)
FIGURE 13.   KUALA LUMPUR BLOOD PRESSURE MONITORING DEVICES MARKET, 2017–2025 (THOUSAND UNITS)
FIGURE 14.   GEORGE TOWN OF PENANG. BLOOD PRESSURE MONITORING DEVICES MARKET, 2017–2025 ($ THOUSAND)
FIGURE 15.   GEORGE TOWN OF PENANG. BLOOD PRESSURE MONITORING DEVICES MARKET, 2017–2025 (THOUSAND UNITS)
FIGURE 16.   IPOH BLOOD PRESSURE MONITORING DEVICES MARKET, 2017–2025 ($ THOUSAND)
FIGURE 17.   IPOH BLOOD PRESSURE MONITORING DEVICES MARKET, 2017–2025 (THOUSAND UNITS)
FIGURE 18.   REST OF MALAYSIA BLOOD PRESSURE MONITORING DEVICES MARKET, 2017–2025 ($ THOUSAND)
FIGURE 19.   REST OF MALAYSIA BLOOD PRESSURE MONITORING DEVICES MARKET, 2017–2025 (THOUSAND UNITS)
FIGURE 20.   JAKARTA BLOOD PRESSURE MONITORING DEVICES MARKET, 2017–2025 ($ THOUSAND)
FIGURE 21.   JAKARTA BLOOD PRESSURE MONITORING DEVICES MARKET, 2017–2025 (THOUSAND UNITS)
FIGURE 22.   SURABAYA BLOOD PRESSURE MONITORING DEVICES MARKET 2017–2025 ($ THOUSAND)
FIGURE 23.   SURABAYA BLOOD PRESSURE MONITORING DEVICES MARKET 2017–2025 (THOUSAND UNITS)
FIGURE 24.   BANDUNG BLOOD PRESSURE MONITORING DEVICES MARKET, 2017–2025 ($ THOUSAND)
FIGURE 25.   BANDUNG BLOOD PRESSURE MONITORING DEVICES MARKET, 2017–2025 (THOUSAND UNITS)
FIGURE 26.   REST OF INDONESIA BLOOD PRESSURE MONITORING DEVICES MARKET, 2017–2025 ($THOUSAND)
FIGURE 27.   REST OF INDONESIA BLOOD PRESSURE MONITORING DEVICES MARKET, 2017–2025 (THOUSAND UNITS)
FIGURE 28.   BANGKOK BLOOD PRESSURE MONITORING DEVICES MARKET, 2017–2025 ($ THOUSAND)
FIGURE 29.   BANGKOK BLOOD PRESSURE MONITORING DEVICES MARKET, 2017–2025 (THOUSAND UNITS)
FIGURE 30.   NONTHABURI BLOOD PRESSURE MONITORING DEVICES MARKET, 2017–2025 ($ THOUSAND)
FIGURE 31.   NONTHABURI BLOOD PRESSURE MONITORING DEVICES MARKET, 2017–2025 (THOUSAND UNITS)
FIGURE 32.   NAKHON RATCHASIMA BLOOD PRESSURE MONITORING DEVICES MARKET,2017–2025 ($ THOUSAND)
FIGURE 33.   NAKHON RATCHASIMA BLOOD PRESSURE MONITORING DEVICES MARKET,2017–2025 (THOUSAND UNITS)
FIGURE 34.   REST OF THAILAND BLOOD PRESSURE MONITORING DEVICES MARKET, 2017–2025 ($ THOUSAND)
FIGURE 35.   REST OF THAILAND BLOOD PRESSURE MONITORING DEVICES MARKET, 2017–2025 (THOUSAND UNITS)
FIGURE 36.   QUEZON CITY BLOOD PRESSURE MONITORING DEVICES MARKET, BY PRODUCT, 2017–2025 ($ THOUSAND)
FIGURE 37.   QUEZON CITY BLOOD PRESSURE MONITORING DEVICES MARKET, BY PRODUCT, 2017–2025 (THOUSAND UNITS)
FIGURE 38.   MANILA BLOOD PRESSURE MONITORING DEVICES MARKET, 2017–2025 ($ THOUSAND)
FIGURE 39.   MANILA BLOOD PRESSURE MONITORING DEVICES MARKET, 2017–2025 (THOUSAND UNITS)
FIGURE 40.   CALOOCAN BLOOD PRESSURE MONITORING DEVICES MARKET, 2017–2025 ($ THOUSAND)
FIGURE 41.   CALOOCAN BLOOD PRESSURE MONITORING DEVICES MARKET, 2017–2025 (THOUSAND UNITS)
FIGURE 42.   REST OF PHILIPPINES BLOOD PRESSURE MONITORING DEVICES MARKET, 2017–2025 ($ THOUSAND)
FIGURE 43.   REST OF PHILIPPINES BLOOD PRESSURE MONITORING DEVICES MARKET, 2017–2025 (THOUSAND UNITS)
FIGURE 44.   DA NANG BLOOD PRESSURE MONITORING DEVICES MARKET, BY PRODUCT, 2017–2025 ($ THOUSAND)
FIGURE 45.   DA NANG BLOOD PRESSURE MONITORING DEVICES MARKET, BY PRODUCT, 2017–2025 (THOUSAND UNITS)
FIGURE 46.   HANOI BLOOD PRESSURE MONITORING DEVICES MARKET, 2017–2025 ($ THOUSAND)
FIGURE 47.   HANOI BLOOD PRESSURE MONITORING DEVICES MARKET, 2017–2025 (THOUSAND UNITS)
FIGURE 48.   HO CHI MINN CITY BLOOD PRESSURE MONITORING DEVICES MARKET, 2017–2025 ($ THOUSAND)
FIGURE 49.   HO CHI MINN CITY BLOOD PRESSURE MONITORING DEVICES MARKET, 2017–2025 (THOUSAND UNITS)
FIGURE 50.   REST OF VIETNAM BLOOD PRESSURE MONITORING DEVICES MARKET, 2017–2025 ($ THOUSAND)
FIGURE 51.   REST OF VIETNAM BLOOD PRESSURE MONITORING DEVICES MARKET, 2017–2025 (THOUSAND UNITS)
FIGURE 52.   SINGAPORE BLOOD PRESSURE MONITORING DEVICES MARKET, 2017–2025 ($ THOUSAND)
FIGURE 53.   SINGAPORE BLOOD PRESSURE MONITORING DEVICES MARKET, 2017–2025 (THOUSAND UNITS)
FIGURE 54.   LAOS BLOOD PRESSURE MONITORING DEVICES MARKET, 2017–2025 ($ THOUSAND)
FIGURE 55.   LAOS BLOOD PRESSURE MONITORING DEVICES MARKET, 2017–2025 (THOUSAND UNITS)
FIGURE 56.   CAMBODIA BLOOD PRESSURE MONITORING DEVICES MARKET, 2017–2025 ($ THOUSAND)
FIGURE 57.   CAMBODIA BLOOD PRESSURE MONITORING DEVICES MARKET, 2017–2025 (THOUSAND UNITS)
FIGURE 58.   MYANMAR BLOOD PRESSURE MONITORING DEVICES MARKET, 2017–2025 ($ THOUSAND)
FIGURE 59.   MYANMAR BLOOD PRESSURE MONITORING DEVICES MARKET, 2017–2025 (THOUSAND UNITS)
FIGURE 60.   BEUNEI BLOOD PRESSURE MONITORING DEVICES MARKET, 2017–2025 ($ THOUSAND)
FIGURE 61.   BEUNEI BLOOD PRESSURE MONITORING DEVICES MARKET, 2017–2025 (THOUSAND UNITS)
FIGURE 62.   A&D COMPANY: NET SALES, 2016–2017 ($MILLION)
FIGURE 63.   A&D COMPANY: REVENUE SHARE BY SEGMENT, 2017 (%)
FIGURE 64.   CONTEC MEDICAL SYSTEMS: NET SALES, 2015–2017 ($MILLION)
FIGURE 65.   GE HEALTHCARE: NET SALES, 2015–2017 ($MILLION)
FIGURE 66.   GE HEALTHCARE: REVENUE SHARE BY SEGMENT, 2017 (%)
FIGURE 67.   GE HEALTHCARE: REVENUE SHARE BY REGION, 2017(%)
FIGURE 68.   HILL-ROM: NET SALES, 2015–2017 ($MILLION)
FIGURE 69.   HILL-ROM HOLDINGS, INC.: REVENUE SHARE BY SEGMENT, 2017 (%)
FIGURE 70.   PHILIPS: NET SALES, 2015–2017 ($MILLION)
FIGURE 71.   PHILIPS: REVENUE SHARE BY SEGMENT, 2017 (%)
FIGURE 72.   PHILIPS: REVENUE SHARE BY REGION, 2017(%)
FIGURE 73.   MASIMO: NET SALES, 2015-2017 ($MILLION)
FIGURE 74.   MASIMO: REVENUE SHARE BY REGION, 2017 (%)
FIGURE 75.   NIHON KOHDEN: NET SALES, 2015–2017 ($MILLION)
FIGURE 76.   NIHON KOHDEN: REVENUE SHARE BY SEGMENT, 2017 (%)
FIGURE 77.   NIHON KOHDEN: REVENUE SHARE BY REGION, 2017 (%)
FIGURE 78.   OMRON CORPORATION: NET SALES, 2015–2017 ($MILLION)
FIGURE 79.   OMRON CORPORATION: REVENUE SHARE BY SEGMENT, 2017 (%)
FIGURE 80.   OMRON CORPORATION: REVENUE SHARE BY REGION, 2017 (%)
FIGURE 81.   SMITHS: NET SALES, 2015–2017 ($MILLION)
FIGURE 82.   SMITHS: REVENUE SHARE BY DIVISION, 2017 (%)
FIGURE 83.   SMITHS: REVENUE SHARE BY REGION, 2017 (%)
FIGURE 84.   HALMA: NET SALES, 2015–2017 ($MILLION)
FIGURE 85.   HALMA: REVENUE SHARE BY SEGMENT, 2017 (%)
FIGURE 86.   HALMA: REVENUE SHARE BY REGION, 2017 (%)
Blood pressure is one of the main risk factors for chronic heart diseases and strokes, which are the leading cause of death around the world. Rise in demand for blood pressure monitoring devices in home care settings and emergence of advanced technologies drive the market growth in ASEAN countries. Moreover, increase in sedentary lifestyles and surge in prevalence of hypertension in this region boost the growth of the blood pressure monitoring devices market in this region.
The blood pressure monitoring devices market has fueled the interest of healthcare professionals, owing to the recognition of risk factors such as stroke and heart attack, associated with high blood pressure, which can help physicians determine the severity of any disease. Moreover, the market is driven by growth in geriatric population and rise in prevalence of hypertension. Further, use of blood pressure monitoring devices is the highest in Malaysia followed by Thailand, due to high government expenditure on healthcare.
Start reading instantly.
This Report and over 66,782+ more Reports, Available with Avenue Library. T&C*.
Enterprise
License/PDF
Library
Membership
*Taxes/Fees, if applicable will be added during checkout. All prices in USD
To ensure high-level data integrity, accurate analysis, and impeccable forecasts
For complete satisfaction
On-demand customization of scope of the report to exactly meet your needs
Targeted market view to provide pertinent information and save time of readers
Get insights on topics that are crucial for your business. Stay abreast of your interest areas.
Get Industry Data AlertsTo ensure high-level data integrity, accurate analysis, and impeccable forecasts
For complete satisfaction
On-demand customization of scope of the report to exactly meet your needs
Targeted market view to provide pertinent information and save time of readers