0
2016
Asia-pacific Robotics Technology Market

Asia-Pacific Robotics Technology Market

by Type (Industrial robots, Mobile robots, Service robots and Others), Component (Hardware, Software, Services) and Application (Automotive, Healthcare, Aerospace, Electronics, Defense and security, Domestic and Others) - Global Opportunity Analysis and Industry Forecast, 2014 - 2020

Report Code: A00986
Mar 2016 | Pages: 135
Tables: 35
Charts: 48
  • Formats*:

  • pdf

    Single User License, Five User
    License & Enterprise User License

  • xls

    Data Pack Excel License

  • ppt

    It comes with the additional cost
    of $2500.00 contact sales.


COVID-19

Pandemic disrupted the entire world and affected many industries.

Get detailed COVID-19 impact analysis on the Asia-pacific Robotics Technology Market

Request Now !

APAC Robotics Technology Market Overview:

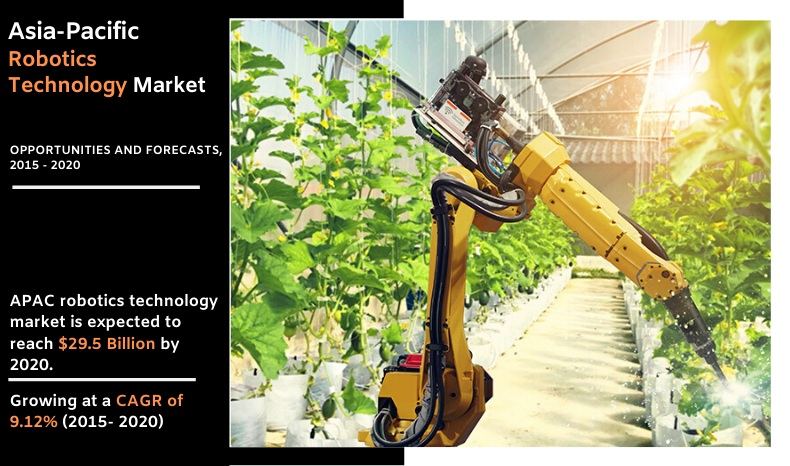
APAC Robotics Technology Market is expected to garner revenue of $29.5 billion by 2020, registering a CAGR of 9.12% during the forecast period 2015-2020. Robotics technology includes the integration of electronics, artificial intelligence, computer science, mechatronics, bioengineering, and nanotechnology for design and development of robots. It is a technology dealing with application of computer-controlled robots for performing manipulative tasks. Robots are intelligent devices containing sensors, manipulators, control systems, power supply, and software to perform a task with increased efficiency.

Robotics technology is increasingly being adopted in the Asia-pacific region owing to rising demand for automation of processes, improved efficiency and productivity, and reduction in human errors. Various sectors including automotive, healthcare, defense, and aerospace have adopted robotics technology for process automation and efficient resource management. Industrial robots are majorly used in the Asia-Pacific region owing to the dominant automotive industry and low-cost manufacturing units. The rising aging population in this region also drives the demand of service robots in countries like China and Japan. Increased application of robots in diverse industries including entertainment, education, and healthcare further supplements the growth of this market. The factors restricting the growth of the market include high initial investment, and stringent safety regulations. Advancement in technologies including swarm robotics, cloud robotics, and bio-mimetics would provide numerous growth opportunities in the market.

Asia-Pacific Robotics Technology Market

Employment of robots enables enterprises to automate processes, manufacture high quality products in large volumes, and increase production output, while reducing costs and wastage of resources. With increasing advancement in technologies, robots are used in wide applications including pharmacy, tele-surgery, physical therapy, manufacturing of electronic equipment, bomb diffusion, rescue operations, and assistance during natural disasters.

The major players operating in the Asia-Pacific Robotics technology market include ABB Group, Fanuc Corporation, Yamaha Corporation, and Yaskawa Electric Corporation. These players offer a diverse portfolio of robots to cater to the demands of organizations in the region. These vendors have developed affordable, compact, and energy efficient robots for application in small and medium businesses. These players have also acquired and collaborated with other players in the region for portfolio expansion and geographic penetration. For instance, in December 2014, FANUC Corporation introduced new robotics solutions including FANUC Robot R-2000iC series, and FANUC Robot M-900iB series to enhance its product portfolio of robotics solutions. These new solutions enabled the company to cater to a wider customer base and meet the increasing demands of the Asia-Pacific market.

The Asia-Pacific robotics technology market has been segmented based on type of robots, components, applications and country. On the basis of types of robots, the market is segmented into industrial robots, mobile robots and service robots. The component segment is divided into hardware, software and services. The application segment is further categorized into healthcare, defense and security, automotive, aerospace, electronics, and others (domestic, agriculture and education). The major vendors profiled in this report are Fanuc Corporation, ABB Group, Yamaha Corporation, Yaskawa Electric Corporation, Honda Motor Co. Ltd., Kawasaki Heavy Industries Ltd, and Seiko Epson Corporation.


APAC ROBOTICS TECHNOLOGY MARKET KEY BENEFITS

  • The study provides an in-depth analysis of the Asia-Pacific robotics technology market with current and future trends to elucidate the imminent investment pockets in the market
  • Current and future trends are outlined to determine the overall attractiveness and single out profitable trends in order to gain a stronger foothold in the market
  • The report provides information regarding key drivers, restraints and opportunities with impact analysis
  • Quantitative analysis of the current market and estimations through 20142020 are provided to showcase the financial appetency of the market
  • Porters five forces model and SWOT analysis of the industry illustrates the potency of the buyers and suppliers participating in the market
  • Value chain analysis in the report provides a clear understanding of the roles of stakeholders involved in the value chain
  • This report highlights the competitive scenario and profiles the key market leaders

Asia-Pacific Robotics Technology Market Report Highlights

Aspects Details
By Type
  • Industrial robots
  • Mobile robots
  • Service robots
  • Others
By Component
  • Hardware
  • Software
  • Services
By Applications
  • Healthcare
  • Defense and security
  • Aerospace
  • Automotive
  • Electronics
  • Domestics
  • Others
By COUNTRY
  • China
  • Japan
  • South Korea
  • Taiwan
  • India
  • Others
Key Market Players ABB Group, Yaskawa Electric Corporation, Fanuc Corporation, Kawasaki Heavy Industries, Ltd, Komatsu, Ltd., Panasonic Corporation, Honda Motor Co., Ltd., Yamaha Motor Co., Ltd, Nachi Fujikoshi Corporation, Seiko Epson Corporation
 

CHAPTER 1 INTRODUCTION

1.1 Report description
1.2 Key benefits
1.3 Key market segments
1.4 Research methodology

1.4.1 Primary research
1.4.2 Analyst tool and models

CHAPTER 2 MARKET OVERVIEW

2.1 Executive Summary
2.2 CXO perspective
2.3 Market definition and scope
2.4 Key findings

2.4.1 Top impacting factors
2.4.2 Top investment pockets
2.4.3 Top winning strategies

2.5 Value chain analysis
2.6 Market share analysis, 2014
2.7 Porters five forces analysis

2.7.1 Low threat of new entrants
2.7.2 Low threat of substitution
2.7.3 Low bargaining power of suppliers
2.7.4 Low bargaining power of buyers
2.7.5 Moderate industry rivalry

2.8 Market dynamics

2.8.1 Drivers
2.8.2 Restraints
2.8.3 Opportunities

CHAPTER 3 BY TYPE

3.1 Industrial Robots

3.1.1 Key market trends
3.1.2 Competitive scenario
3.1.3 Key growth factors and opportunities
3.1.4 Market size and forecast

3.2 Mobile Robots

3.2.1 Key market trends
3.2.2 Competitive scenario
3.2.3 Key growth factors and opportunities
3.2.4 Market size and forecast

3.3 Service Robots

3.3.1 Key market trends
3.3.2 Competitive scenario
3.3.3 Key growth factors and opportunities
3.3.4 Market size and forecast

3.4 Others

3.4.1 Key market trends
3.4.2 Competitive scenario
3.4.3 Key growth factors and opportunities
3.4.4 Market size and forecast

CHAPTER 4 BY COMPONENTS

4.1 Hardware

4.1.1 Key market trends
4.1.2 Competitive scenario
4.1.3 Key growth factors and opportunities
4.1.4 Market size and forecast

4.2 Software

4.2.1 Key market trends
4.2.2 Competitive scenario
4.2.3 Key growth factors and opportunities
4.2.4 Market size and forecast

4.3 Services

4.3.1 Key market trends
4.3.2 Competitive scenario
4.3.3 Key growth factors and opportunities
4.3.4 Market size and forecast

CHAPTER 5 BY APPLICATIONS

5.1 Healthcare

5.1.1 Market size and forecast

5.2 Defense and Security

5.2.1 Market size and forecast

5.3 Aerospace

5.3.1 Market size and forecast

5.4 Automotive

5.4.1 Market size and forecast

5.5 Electronics

5.5.1 Market size and forecast

5.6 Domestic

5.6.1 Market size and forecast

5.7 Others

5.7.1 Market size and forecast

CHAPTER 6 BY COUNTRY

6.1 China

6.1.1 Key market trends
6.1.2 Competitive scenario
6.1.3 Key growth factors and opportunities
6.1.4 Market size and forecast

6.2 Japan

6.2.1 Key market trends
6.2.2 Competitive scenario
6.2.3 Key growth factors and opportunities
6.2.4 Market size and forecast

6.3 South Korea

6.3.1 Key market trends
6.3.2 Competitive scenario
6.3.3 Key growth factors and opportunities
6.3.4 Market size and forecast

6.4 Taiwan

6.4.1 Key market trends
6.4.2 Competitive scenario
6.4.3 Key growth factors and opportunities
6.4.4 Market size and forecast

6.5 India

6.5.1 Key market trends
6.5.2 Competitive scenario
6.5.3 Key growth factors and opportunities
6.5.4 Market size and forecast

6.6 Others

6.6.1 Key market trends
6.6.2 Competitive scenario
6.6.3 Key growth factors and opportunities
6.6.4 Market size and forecast

CHAPTER 7 COMPANY PROFILE

7.1 ABB Group

7.1.1 Company overview
7.1.2 Company snapshot
7.1.3 Business performance
7.1.4 Key strategies and developments
7.1.5 SWOT analysis of ABB Group

7.2 Panasonic Corporation

7.2.1 Company overview
7.2.2 Company snapshot
7.2.3 Business performance
7.2.4 Key strategies and developments
7.2.5 SWOT analysis of Panasonic Corporation

7.3 Yaskawa Electric Corporation

7.3.1 Company overview
7.3.2 Company snapshot
7.3.3 Business performance
7.3.4 Key strategies and developments
7.3.5 SWOT analysis of Yaskawa Electric Corporation

7.4 Fanuc Corporation

7.4.1 Company overview
7.4.2 Company snapshot
7.4.3 Business performance
7.4.4 Key strategies and development
7.4.5 SWOT analysis of Fanuc Corporation

7.5 Komatsu, Ltd.

7.5.1 Company overview
7.5.2 Company snapshot
7.5.3 Business performance
7.5.4 Key strategies and developments
7.5.5 SWOT analysis of Komatsu, Ltd.

7.6 Seiko Epson Corporation

7.6.1 Company overview
7.6.2 Company snapshot
7.6.3 Business performance
7.6.4 Key strategies and developments
7.6.5 SWOT analysis of Seiko Epson Corporation

7.7 Nachi Fujikoshi Corporation

7.7.1 Company overview
7.7.2 Company snapshot
7.7.3 Business performance
7.7.4 Key strategies and developments
7.7.5 SWOT analysis of Nachi Fujikoshi Corporation

7.8 Honda Motor Co., Ltd.

7.8.1 Company overview
7.8.2 Company snapshot
7.8.3 Business performance
7.8.4 Key strategies and developments
7.8.5 SWOT analysis of Honda Motor Co., Ltd

7.9 Kawasaki Heavy Industries, Ltd

7.9.1 Company overview
7.9.2 Company snapshot
7.9.3 Business performance
7.9.4 Key strategies and developments
7.9.5 SWOT analysis of Heavy Industries, Ltd

7.10 Yamaha Motor Co., Ltd

7.10.1 Company overview
7.10.2 Company snapshot
7.10.3 Business performance
7.10.4 Key strategies and developments
7.10.5 SWOT analysis of Yamaha Motor Co.,Ltd

List of Figures

FIG. 1 TOP IMPACTING FACTORS
FIG. 2 TOP INVESTMENT POCKETS
FIG. 3 TOP WINNING STRATEGIES IN ASIA-PACIFIC ROBOTICS TECHNOLOGY MARKET
FIG. 4 TOP WINNING STRATEGIES IN ASIA-PACIFIC ROBOTICS TECHNOLOGY BY LEADING PLAYERS
FIG. 5 VALUE CHAIN ANALYSIS OF ROBOTICS TECHNOLOGY MARKET
FIG. 6 MARKET SHARE ANALYSIS OF ROBOTICS SUPPLIERS, 2014
FIG. 7 PORTERS FIVE FORCES MODEL
FIG. 8 REVENUE GENERATED BY ABB GROUP ($MILLION, 2012 - 2014)
FIG. 9 REVENUE OF ABB GROUP IN PERCENTAGE BY BUSINESS SEGMENTS 2014
FIG. 10 REVENUE OF ABB GROUP IN PERCENTAGE BY GEOGRAPHY, 2014
FIG. 11 SWOT ANALYSIS OF ABB GROUP
FIG. 12 REVENUE GENERATED BY PANASONIC CORPORATION ($MILLION, 2012 - 2014)
FIG. 13 REVENUE OF PANASONIC CORPORATION IN PERCENTAGE BY BUSINESS SEGMENTS (2014)
FIG. 14 REVENUE OF PANASONIC CORPORATION IN PERCENTAGE BY GEOGRAPHY (2014)
FIG. 15 SWOT ANALYSIS OF PANASONIC CORPORATION
FIG. 16 REVENUE GENERATED BY YASKAWA ELECTRIC CORPORATION ($MILLION, 2012 - 2014)
FIG. 17 REVENUE OF YASKAWA ELECTRIC CORPORATION IN PERCENTAGE BY BUSINESS SEGMENTS 2014
FIG. 18 REVENUE OF YASKAWA ELECTRIC CORPORATION IN PERCENTAGE BY GEOGRAPHY 2014
FIG. 19 SWOT ANALYSIS OF YASKAWA ELECTRIC CORPORATION
FIG. 20 REVENUE GENERATED BY FANUC CORPORATION ($MILLION, 2013 & 2014)
FIG. 21 REVENUE OF FANUC CORPORATION IN PERCENTAGE BY BUSINESS SEGMENT 2014
FIG. 22 REVENUE OF FANUC CORPORATION IN PERCENTAGE BY GEOGRAPHY 2014
FIG. 23 SWOT ANALYSIS OF FANUC CORPORATION
FIG. 24 REVENUE GENERATED BY KOMATSU, LTD. ($MILLION, 2012 - 2014)
FIG. 25 REVENUE OF KOMATSU, LTD. IN PERCENTAGE BY BUSINESS SEGMENTS 2014
FIG. 26 REVENUE OF KOMATSU, LTD. IN PERCENTAGE BY GEOGRAPHY 2014
FIG. 27 SWOT ANALYSIS OF KOMATSU, LTD.
FIG. 28 REVENUE GENERATED BY SEIKO EPSON CORPORATION ($MILLION, 2012 - 2014)
FIG. 29 REVENUE OF SEIKO EPSON CORPORATION IN PERCENTAGE BY BUSINESS SEGMENTS 2014
FIG. 30 SWOT ANALYSIS OF SEIKO EPSON CORPORATION
FIG. 34 REVENUE GENERATED BY NACHI FUJIKOSHI CORPORATION ($MILLION, 2012 - 2014)
FIG. 35 REVENUE OF NACHI FUJIKOSHI CORPORATION IN PERCENTAGE BY OPERATING SEGMENTS 2014
FIG. 36 SWOT ANALYSIS OF NACHI FUJIKOSHI CORPORATION
FIG. 37 REVENUE GENERATED BY HONDA MOTOR CO., LTD. ($BILLION, 2012 - 2014)
FIG. 38 REVENUE OF HONDA MOTOR CO., LTD.IN PERCENTAGE BY BUSINESS SEGMENTS 2014
FIG. 39 REVENUE OF HONDA MOTOR CO., LTD. IN PERCENTAGE BY GEOGRAPHY 2014
FIG. 40 SWOT ANALYSIS OF HONDA MOTOR CO., LTD.
FIG. 41 REVENUE GENERATED BY KAWASAKI HEAVY INDUSTRIES, LTD ($MILLION, 2012 - 2014)
FIG. 42 REVENUE OF KAWASAKI HEAVY INDUSTRIES, LTD IN PERCENTAGE BY BUSINESS SEGMENTS 2014
FIG. 43 REVENUE OF KAWASAKI HEAVY INDUSTRIES, LTD IN PERCENTAGE BY GEOGRAPHY 2014
FIG. 44 SWOT ANALYSIS OF KAWASAKI HEAVY INDUSTRIES, LTD
FIG. 45 REVENUE GENERATED BY YAMAHA MOTOR CO., LTD ($MILLION, 2012 - 2014)
FIG. 46 REVENUE OF YAMAHA MOTOR CO., LTD IN PERCENTAGE BY OPERATING SEGMENTS 2014
FIG. 47 REVENUE OF YAMAHA MOTOR CO., LTD IN PERCENTAGE BY GEOGRAPHY (2014)
FIG. 48 SWOT ANALYSIS OF YAMAHA MOTOR CO.,LTD

List of Tables

TABLE 1 ASIA-PACIFIC ROBOTICS TECHNOLOGY MARKET REVENUE BY GEOGRAPHY, 2014 - 2020 ($MILLION)
TABLE 2 ASIA-PACIFIC ROBOTICS TECHNOLOGY MARKET REVENUE BY PRODUCT TYPE, 2014 - 2020 ($MILLION)
TABLE 3 ASIA-PACIFIC INDUSTRIAL ROBOTICS TECHNOLOGY MARKET REVENUE BY GEOGRAPHY, 2014 - 2020 ($MILLION)
TABLE 4 ASIA-PACIFIC MOBILE ROBOTICS MARKET REVENUE BY GEOGRAPHY, 2014 - 2020 ($MILLION)
TABLE 5 ASIA-PACIFIC SERVICE ROBOTICS MARKET REVENUE BY GEOGRAPHY, 2014 - 2020 ($MILLION)
TABLE 6 ASIA-PACIFIC OTHER ROBOTICS MARKET REVENUE BY GEOGRAPHY, 2014 - 2020 ($MILLION)
TABLE 7 ASIA-PACIFIC ROBOTICS TECHNOLOGY MARKET REVENUE BY COMPONENTS, 2014 - 2020 ($MILLION)
TABLE 8 ASIA-PACIFIC ROBOTICS TECHNOLOGY HARDWARE COMPONENT MARKET REVENUE BY GEOGRAPHY, 2014-2020 ($MILLION)
TABLE 9 ASIA-PACIFIC ROBOTICS TECHNOLOGY SOFTWARE COMPONENT MARKET REVENUE BY GEOGRAPHY, 2014 - 2020 ($MILLION)
TABLE 10 ASIA-PACIFIC ROBOTICS TECHNOLOGY SERVICE COMPONENT MARKET REVENUE BY GEOGRAPHY, 2014-2020 ($MILLION)
TABLE 11 ASIA-PACIFIC ROBOTICS TECHNOLOGY MARKET REVENUE BY APPLICATION, 2014 - 2020 ($MILLION)
TABLE 12 ASIA-PACIFIC HEALTHCARE ROBOTICS TECHNOLOGY MARKET REVENUE BY GEOGRAPHY, 2014 - 2020 ($MILLION)
TABLE 13 ASIA-PACIFIC DEFENSE AND SECURITY ROBOTICS TECHNOLOGY MARKET REVENUE BY GEOGRAPHY, 2014 - 2020 ($MILLION)
TABLE 15 ASIA-PACIFIC AEROSPACE ROBOTICS TECHNOLOGY MARKET REVENUE BY GEOGRAPHY, 2014 - 2020 ($MILLION)
TABLE 16 ASIA-PACIFIC AUTOMOTIVE ROBOTICS TECHNOLOGY MARKET REVENUE BY GEOGRAPHY, 2014 - 2020 ($MILLION)
TABLE 17 ASIA-PACIFIC ELECTRONICS ROBOTICS TECHNOLOGY MARKET REVENUE BY GEOGRAPHY, 2014 - 2020 ($MILLION)
TABLE 18 ASIA-PACIFIC DOMESTIC ROBOTICS TECHNOLOGY MARKET REVENUE BY GEOGRAPHY, 2014 - 2020 ($MILLION)
TABLE 19 ASIA-PACIFIC OTHER APPLICATIONS ROBOTICS TECHNOLOGY MARKET REVENUE BY GEOGRAPHY, 2014 - 2020 ($MILLION)
TABLE 20 CHINA ROBOTICS TECHNOLOGY MARKET REVENUE BY TYPE, 2014 - 2020 ($MILLION)
TABLE 21 JAPAN ROBOTICS TECHNOLOGY MARKET REVENUE BY TYPE, 2014 - 2020 ($MILLION)
TABLE 22 SOUTH KOREA ROBOTICS TECHNOLOGY MARKET REVENUE BY TYPE, 2014 - 2020 ($MILLION)
TABLE 23 TAIWAN ROBOTICS TECHNOLOGY MARKET REVENUE BY TYPE, 2014 - 2020 ($MILLION)
TABLE 24 INDIA ROBOTICS TECHNOLOGY MARKET REVENUE BY TYPE, 2014 - 2020 ($MILLION)
TABLE 25 OTHERS ROBOTICS TECHNOLOGY MARKET REVENUE BY TYPE, 2014 - 2020 ($MILLION)
TABLE 26 SNAPSHOT OF ABB GROUP
TABLE 27 SNAPSHOT OF PANASONIC CORPORATION
TABLE 28 SNAPSHOT OF YASKAWA ELECTRIC CORPORATION
TABLE 29 SNAPSHOT OF FANUC CORPORATION
TABLE 30 SNAPSHOT OF KOMATSU, LTD.
TABLE 31 SNAPSHOT OF SEIKO EPSON CORPORATION
TABLE 32 SNAPSHOT OF NACHI FUJIKOSHI CORPORATION
TABLE 33 SNAPSHOT OF HONDA MOTOR CO., LTD.
TABLE 34 SNAPSHOT OF KAWASAKI HEAVY INDUSTRIES, LTD
TABLE 35 SNAPSHOT OF YAMAHA MOTOR CO., LTD


PURCHASE OPTIONS

Call or Email us

U.S.-Canada Toll-free: +1-800-792-5285
Int'l : +1-503-894-6022
Europe : +44-845-528-1300
Email : help@alliedmarketresearch.com

Looking for Customization?

 Customization Request

Have a Question?

 Speak with Analyst

Any Confusion?

 Inquire Before Buying

Have a glance of the Report

  Request Sample

Purchase Full Report of
Asia-pacific Robotics Technology Market

Start reading instantly.
This Report and over 67,404+ more Reports, Available with Avenue Library. T&C*.

  • Online Only
  • $2,573
  • Online cloud access only
  • Restricted print, copy, paste & download
  • Read only
  • Free industry update
    (Within 180 days)
  • Free report update in next update cycle
    (Mar 2017 - Mar 2018)
  • Data Pack
  • $2,859
  • Restricted to one authorized user
  • One print only
  • Available in
    Excel
  • Free industry update
    (Within 180 days)
  •   Free report update in next update cycle
    (Mar 2017 - Mar 2018)
  • Single User
  • $3,999
  • Restricted to one authorized user
  • One print only
  • Available in
    PDF
  • Free industry update
    (Within 180 days)
  •   Free report update in next update cycle
    (Mar 2017 - Mar 2018)
  • Five Users
  • $4,803
  • Limited to five authorized users
  • Print upto five copies
  • Available in
    PDF
  • Free industry update
    (Within 180 days)
  •   Free report update in next update cycle
    (Mar 2017 - Mar 2018)
  • Enterprise
    License/PDF

  • $7,698
  • Unlimited
    within
    company/enterprise
  • Available in Excel & PDF
  • Free industry update
    (Within 180 days)
  •   Free report update in next update cycle
    (Mar 2017 - Mar 2018)
  • Library
    Membership

  • $999 $ 1,175
    Per User/ Per month/ Billed annually
  • Published Content
    E-access
  • Company Profiles
    E-access
  • Newly Added Content Access
  • 10 PDF
    Downloads
  • 5 Excel Data
    Pack Downloads
  • 250 Company Profiles PDF Downloads
  • Buy Now

*Taxes/Fees, if applicable will be added during checkout. All prices in USD

RELATED REPORTS
 

Why Allied Market Research?


Infallible Methodology

To ensure high-level data integrity, accurate analysis, and impeccable forecasts

Analyst Support

For complete satisfaction

Customization

On-demand customization of scope of the report to exactly meet your needs

TARGETED MARKET VIEW

Targeted market view to provide pertinent information and save time of readers

Get fresh content delivered

Get insights on topics that are crucial for your business. Stay abreast of your interest areas.

Get Industry Data Alerts

Why Allied Market Research?

Infallible Methodology

To ensure high-level data integrity, accurate analysis, and impeccable forecasts

Analyst Support

For complete satisfaction

Customization

On-demand customization of scope of the report to exactly meet your needs

TARGETED MARKET VIEW

Targeted market view to provide pertinent information and save time of readers