0
2021
Athletic Footwear Market

Athletic Footwear Market

by Type (Sports Shoes, Running & Walking Shoes, Hiking & Backpacking Shoes, and Aerobic & Gym Wear Shoes), End User (Men, Women, and Kids), and Distribution Channel (Supermarkets/Hypermarkets, Specialty Stores, Brand Outlets, and Online Channels): Global Opportunity Analysis and Industry Forecast 2021-2030

Report Code: A01085
Dec 2021 | Pages: 332
Tables: 175
Charts: 78
  • Formats*:

  • pdf

    Single User License, Five User
    License & Enterprise User License

  • xls

    Data Pack Excel License

  • ppt

    It comes with the additional cost
    of $2500.00 contact sales.


COVID-19

Pandemic disrupted the entire world and affected many industries.

Get detailed COVID-19 impact analysis on the Athletic Footwear Market

Request Now !

Athletic Footwear Market Outlook - 2030

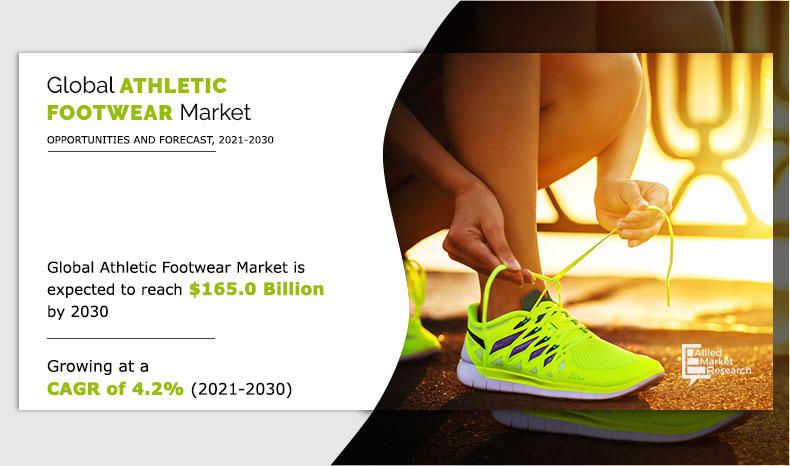
The athletic footwear market was valued at $109.7 billion in 2020, and is projected to reach $165.0 billion by 2030, registering a CAGR of 4.2% from 2021 to 2030.

Athletic footwear refers to those shoes that are designed for sports and other outdoor activities. The global consumption volume indicates a trend of these being used as casual and fashion footwear by people of all age groups. The market offers a variety of footwear with options in color, design, and price to cater to the needs and purchasing abilities of individual customers. Sales expansion through online channels, innovative product launches, and attractive marketing and promotional strategies that are adopted by companies led to rise in growth of the athletic footwear market size. The market is highly competitive with players making huge investments in marketing channels and brand building. This highlights their presence and helps establish their brand value to attract an increased volume of consumers. There are numerous small-scale manufacturers that offer tough competition to athletic footwear giants. Increasing environmental concerns over synthetic rubber and rise in raw material prices have emerged as major challenges for the athletic footwear market growth.

Athletic-footwear-market-2021-2030

E-commerce, which involves buying and selling products and services exclusively through electronic channels, has a huge demand globally. The most well-known form of e-commerce is online shopping. It has simplified the purchasing process for consumers by making it easier and more convenient. Online shopping is more popular in developed countries, such as America and Japan, compared todeveloping countries such as India and China. The current retail scenario is different from what it was ten years earlier. There is an immense athletic footwear market opportunity, owing to the emergence of e-commerce, which makes shopping simpler, easier, and more convenient.

The demand for athletic footwear products is increasing rapidly, owing to usage in variousconditions. Athletic footwear are products used by various consumer types such as athletes and climbers. In addition, there are fitness conscious customers, gym goers, and people who use them for mild fitness routines. Various types of athletic footwear available in the market are prepared from high quality raw materials, such as leather, foam, and plastic, which involve use of advanced chemical additives.

Athletic Footwear Market
By Type

Your browser does not support the canvas element.

The running shoes segment dominates the Athletic footwear market and is expected to retain its dominance throughout the forecast period.

Get more information on this report : Request Sample Pages

Increasing environmental concerns is one the important restraints of the athletic footwear industry. The active measures taken by the government and environmental groups towards pollution act as a restraint for the market. The industry is one of the main causes of polluting the rivers and environment. For instance, in July 2011, Puma along with other sportswear brands including Nike and Adidas was addressed as ‘Dirty Laundry’ as the subject of a report by the environmental group Greenpeace. Puma was accused of working with the suppliers in China who, according to the report, contributed to the pollution of the Yangtze and Pearl rivers.

Athletic Footwear Market
By End User

Your browser does not support the canvas element.

The men segment dominates the Athletic footwear market and is expected to retain its dominance throughout the forecast period.

Get more information on this report : Request Sample Pages

The athletic footwear market is segmented on the basis of type, end user, distribution channel and region. By type, it is categorized into sports, running, and walking shoes; hiking and backpacking shoes; and aerobic and gym wear shoes. Sports shoe segment is further categorized into tennis shoes, soccer shoes, basketball shoes, cricket shoes and others. By user, the market is segmented into men, women, and kids. On the basis of distribution channel the market is subdivided into hypermarkets/supermarkets, brand outlets, specialty stores and online channels. A tremendous drift in youth fashion trends has been witnessed, which may increase the demand for new products in the developing market. On the basis of region, the market is classified into North America, Europe, Asia-Pacific, and LAMEA.

Athletic Footwear Market
By Distribution Channel

Your browser does not support the canvas element.

The hypermarket/supermarket segment dominates the Athletic footwear market and is expected to retain its dominance throughout the forecast period.

Get more information on this report : Request Sample Pages

Key players operating in the athletic footwear market have adopted product launch, business expansion, and mergers& acquisitions as key strategies to expand their athletic footwear market share, increase profitability, and remain competitive in the market. Leading players analyzed in the athletic footwear market analysis includes-Asics Corporation, Adidas AG, Puma, VF Corporation, Nike, Inc., FILA Korea, Ltd., New Balance, Inc., SKECHERS, Inc., K-Swiss, Inc., and Wolverine World Wide, Inc.

Athletic Footwear Market
By Region

2030
Asia-pacific 
North America
Europe
LAMEA

The Asia-Pacific dominated the Athletic footwearmarket and is expected to retain its dominance throughout the forecast period.

Get more information on this report : Request Sample Pages

COVID-19 impact analysis

  • The COVID-19 pandemic has a huge impact on the global athletic footwear market.
  • The COVID-19 pandemic had a significant impact on the supermarkets/hypermarkets segment, owing to closure of major distribution channels across the globe in an attempt to prevent the spread of coronavirus.
  • Manufacturers are comprehending strategies to revive from the current situation by means of reshaping their strategies as well as product innovation.

Key Benefits Athletic Footwear Market:

  • The report provides a quantitative analysis of the athletic footwear market trends, estimations, and dynamics of the athletic footwear market size from 2020 to 2030 to identify the prevailing opportunities.
  • Porter’s five forces analysis highlights the potency of buyers and suppliers to enable stakeholders to make profit-oriented business decisions and strengthen their supplier–buyer network.
  • The athletic footwear market forecast is offered along with information related to key drivers, restraints, and opportunities.
  • The major countries in each region are mapped according to their revenue contribution to the athletic footwear market.
  • The market player positioning analysis facilitates benchmarking and provides a clear understanding of the present position of the market players in the athletic footwear industry.

Athletic Footwear Market Report Highlights

Aspects Details
By Type
  • Sports shoes
    • Tennis Shoes
    • Soccer Shoes
    • Basketball Shoes
    • Cricket Shoes
    • Others
  • Running and walking shoes
  • Hiking and backpacking shoes
  • Aerobic and gym wear shoes
By End User
  • Men
  • Women
  • Kids
By Distribution Channel
  • Hypermarkets/Supermarkets
  • Specialty Stores
  • Brand Outlets
  • Online Channels
By Region
  • North America  (U.S., Canada, Mexico)
  • Europe  (UK, Germany, France, Italy, Spain, Russia, Rest of Europe)
  • Asia-Pacific  (India, China, Japan, ASEAN, Australia & New Zealand, South Korea, Rest of Asia-Pacific)
  • LAMEA  (Brazil, Argentina, Saudi Arabia, South Africa, Rest of LAMEA)
Key Market Players Wolverine World Wide, Inc., FILA Korea, Ltd., New Balance, Inc., SKECHERS, Inc., Nike, Inc., Puma SE, VF Corporation, Adidas group, K-Swiss, Inc., Asics Corporation
 

CHAPTER 1:INTRODUCTION

1.1.Report description
1.2.Key benefits for stakeholders
1.3.Key market segments
1.4.Research methodology

1.4.1.Secondary research
1.4.2.Primary research
1.4.3.Analyst tools and models

CHAPTER 2:EXECUTIVE SUMMARY

2.1.Key findings of the study
2.2.CXO perspective

CHAPTER 3:MARKET OVERVIEW

3.1.Market definition and scope
3.2.Key findings

3.2.1.Top investment pockets

3.3.Porter’s five forces analysis
3.4.COVID-19 impact on athletic footwear market

3.4.1.Introduction
3.4.2.Impact on footwear industry
3.4.3.Multiple Scenario

3.5.Value chain Analysis
3.6.Pricing Analysis
3.7.Technological roadmap
3.8.Case study

3.1.4 Ps of top players

3.2.Top Impacting Factor
3.3.Parent Market Analysis
3.5.Consumer behavior analysis
3.6.Market dynamics

3.6.1.Drivers

3.6.1.1.Growing health awareness is fostering the market growth
3.6.1.2.Surge in government investment in sports events is boosting the demand for athletic footwear
3.6.1.3.Rise in number of sports-inspired children is propelling the demand for athletic footwear among kids
3.6.1.4.Growing number of outlets
3.6.1.5.Emergence of new designs is propelling the market

3.6.2.Restraints

3.6.2.1.Increasing environmental concerns is hampering the market growth
3.6.2.2.Rising prices of raw materials
3.6.2.3.Availability of counterfeit products

3.6.3.Opportunities

3.6.3.1.Changing consumer’s lifestyle
3.6.3.2.Growing fashion trends
3.6.3.3.Emerging role of e-commerce

CHAPTER 4:ATHLETIC FOOTWEAR MARKET, BY TYPE

4.1.Overview

4.1.1.Market size and forecast

4.2.Sports shoes

4.2.1.Key market trends, growth factors, and opportunities

4.2.1.1.Tennis shoes
4.2.1.2.Soccer Shoes
4.2.1.3.Basketball Shoes
4.2.1.4.Cricket Shoes
4.2.1.5.Others

4.2.2.Market size and forecast
4.2.3.Market analysis, by country

4.3.Running and walking shoes

4.3.1.Key market trends, growth factors, and opportunities
4.3.2.Market size and forecast
4.3.3.Market analysis, by country

4.4.Hiking and backpacking shoes

4.4.1.Key market trends, growth factors, and opportunities
4.4.2.Market size and forecast
4.4.3.Market analysis, by country

4.5.Aerobic and gym wear shoes

4.5.1.Key market trends, growth factors, and opportunities
4.5.2.Market size and forecast
4.5.3.Market analysis, by country

CHAPTER 5:ATHLETIC FOOTWEAR MARKET, BY END USER

5.1.Overview

5.1.1.Market size and forecast

5.2.Men

5.2.1.Key market trends, growth factors, and opportunities
5.2.2.Market size and forecast
5.2.3.Market analysis, by country

5.3.Women

5.3.1.Key market trends, growth factors, and opportunities
5.3.2.Market size and forecast
5.3.3.Market analysis, by country

5.4.Kids

5.4.1.Key market trends, growth factors, and opportunities
5.4.2.Market size and forecast
5.4.3.Market analysis, by country

CHAPTER 6:ATHLETIC FOOTWEAR MARKET, BY DISTRIBUTION CHANNEL

6.1.Overview

6.1.1.Market size and forecast

6.2.Hypermarket/supermarket

6.2.1.Key market trends, growth factors, and opportunities
6.2.2.Market size and forecast
6.2.3.Market analysis, by country

6.3.Specialty stores

6.3.1.Key market trends, growth factors, and opportunities
6.3.2.Market size and forecast
6.3.3.Market analysis, by country

6.4.Brand outlets

6.4.1.Key market trends, growth factors, and opportunities
6.4.2.Market size and forecast
6.4.3.Market analysis, by country

6.5.Online Channels

6.5.1.Key market trends, growth factors, and opportunities
6.5.2.Market size and forecast
6.5.3.Market analysis, by country

CHAPTER 7:ATHLETIC FOOTWEAR MARKET, BY REGION

7.1.Overview

7.1.1.Market size and forecast, by region

7.2.North America

7.2.1.Key market trends, growth factors, and opportunities
7.2.2.Market size and forecast, by type
7.2.3.Market size and forecast, by end user
7.2.4.Market size and forecast, by distribution channel
7.2.5.Market size and forecast, by country

7.2.5.1.U.S.

7.2.5.1.1.Market size and forecast, by type
7.2.5.1.2.Market size and forecast, by end user
7.2.5.1.3.Market size and forecast, by distribution channel

7.2.5.2.CANADA

7.2.5.2.1.Market size and forecast, by type
7.2.5.2.2.Market size and forecast, by end user
7.2.5.2.3.Market size and forecast, by distribution channel

7.2.5.3.MEXICO

7.2.5.3.1.Market size and forecast, by type
7.2.5.3.2.Market size and forecast, by end user
7.2.5.3.3.Market size and forecast, by distribution channel

7.3.Europe

7.3.1.Key market trends, growth factors, and opportunities
7.3.2.Market size and forecast, by type
7.3.3.Market size and forecast, by end user
7.3.4.Market size and forecast, by distribution channel
7.3.5.Market size and forecast, by country

7.3.5.1.UK

7.3.5.1.1.Market size and forecast, by type
7.3.5.1.2.Market size and forecast, by end user
7.3.5.1.3.Market size and forecast, by distribution channel

7.3.5.2.GERMANY

7.3.5.2.1.Market size and forecast, by type
7.3.5.2.2.Market size and forecast, by end user
7.3.5.2.3.Market size and forecast, by distribution channel

7.3.5.3.FRANCE

7.3.5.3.1.Market size and forecast, by type
7.3.5.3.2.Market size and forecast, by end user
7.3.5.3.3.Market size and forecast, by distribution channel

7.3.5.4.ITALY

7.3.5.4.1.Market size and forecast, by type
7.3.5.4.2.Market size and forecast, by end user
7.3.5.4.3.Market size and forecast, by distribution channel

7.3.5.5.SPAIN

7.3.5.5.1.Market size and forecast, by type
7.3.5.5.2.Market size and forecast, by end user
7.3.5.5.3.Market size and forecast, by distribution channel

7.3.5.6.RUSSIA

7.3.5.6.1.Market size and forecast, by type
7.3.5.6.2.Market size and forecast, by end user
7.3.5.6.3.Market size and forecast, by distribution channel

7.3.5.7.REST OF EUROPE

7.3.5.7.1.Market size and forecast, by type
7.3.5.7.2.Market size and forecast, by end user
7.3.5.7.3.Market size and forecast, by distribution channel

7.4.Asia-Pacific

7.4.1.Key market trends, growth factors, and opportunities
7.4.2.Market size and forecast, by type
7.4.3.Market size and forecast, by end user
7.4.4.Market size and forecast, by distribution channel
7.4.5.Market size and forecast, by country

7.4.5.1.CHINA

7.4.5.1.1.Market size and forecast, by type
7.4.5.1.2.Market size and forecast, by end user
7.4.5.1.3.Market size and forecast, by distribution channel

7.4.5.2.INDIA

7.4.5.2.1.Market size and forecast, by type
7.4.5.2.2.Market size and forecast, by end user
7.4.5.2.3.Market size and forecast, by distribution channel

7.4.5.3.JAPAN

7.4.5.3.1.Market size and forecast, by type
7.4.5.3.2.Market size and forecast, by end user
7.4.5.3.3.Market size and forecast, by distribution channel

7.4.5.4.AUSTRALIA & NEW ZEALAND

7.4.5.4.1.Market size and forecast, by type
7.4.5.4.2.Market size and forecast, by end user
7.4.5.4.3.Market size and forecast, by distribution channel

7.4.5.5.ASEAN

7.4.5.5.1.Market size and forecast, by type
7.4.5.5.2.Market size and forecast, by end user
7.4.5.5.3.Market size and forecast, by distribution channel

7.4.5.6.SOUTH KOREA

7.4.5.6.1.Market size and forecast, by type
7.4.5.6.2.Market size and forecast, by end user
7.4.5.6.3.Market size and forecast, by distribution channel

7.4.5.7.REST OF ASIA-PACIFIC

7.4.5.7.1.Market size and forecast, by type
7.4.5.7.2.Market size and forecast, by end user
7.4.5.7.3.Market size and forecast, by distribution channel

7.5.LAMEA

7.5.1.Key market trends, growth factors, and opportunities
7.5.2.Market size and forecast, by type
7.5.3.Market size and forecast, by end user
7.5.4.Market size and forecast, by distribution channel
7.5.5.Market size and forecast, by country

7.5.5.1.BRAZIL

7.5.5.1.1.Market size and forecast, by type
7.5.5.1.2.Market size and forecast, by end user
7.5.5.1.3.Market size and forecast, by distribution channel

7.5.5.2.ARGENTINA

7.5.5.2.1.Market size and forecast, by type
7.5.5.2.2.Market size and forecast, by end user
7.5.5.2.3.Market size and forecast, by distribution channel

7.5.5.3.SAUDI ARABIA

7.5.5.3.1.Market size and forecast, by type
7.5.5.3.2.Market size and forecast, by end user
7.5.5.3.3.Market size and forecast, by distribution channel

7.5.5.4.SOUTH AFRICA

7.5.5.4.1.Market size and forecast, by type
7.5.5.4.2.Market size and forecast, by end user
7.5.5.4.3.Market size and forecast, by distribution channel

7.5.5.5.REST OF LAMEA

7.5.5.5.1.Market size and forecast, by type
7.5.5.5.2.Market size and forecast, by end user
7.5.5.5.3.Market size and forecast, by distribution channel

CHAPTER 8:COMPETITION LANDSCAPE

8.1.Top winning strategies
8.2.Top player positioning
8.3.Product mapping
8.4.Competitive dashboard
8.5.Competitive heat map
8.6.Key developments

8.6.1.Acquisition
8.6.2.Business Expansion
8.6.3.Product Launch

CHAPTER 9:COMPANY PROFILES

9.1.ADIDAS AG

9.1.1.Company overview
9.1.2.Key Executives
9.1.3.Company snapshot
9.1.4.Operating business segments
9.1.5.Product portfolio
9.1.6.R&D Expenditure
9.1.7.Business performance
9.1.8.Key strategic moves and developments

9.2.ASICS CORPORATION

9.2.1.Company overview
9.2.2.Key Executives
9.2.3.Company snapshot
9.2.4.Operating business segments
9.2.5.Product portfolio
9.2.6.R&D Expenditure
9.2.7.Business performance
9.2.8.Key strategic moves and developments

9.3.FILA HOLDINGS CORP.

9.3.1.Company overview
9.3.2.Key Executives
9.3.3.Company snapshot
9.3.4.Product portfolio
9.3.5.Business performance
9.3.6.Key strategic moves and developments

9.4.K-SWISS

9.4.1.Company overview
9.4.2.Key Executives
9.4.3.Company snapshot
9.4.4.Operating business segments
9.4.5.Product portfolio
9.4.6.Business performance
9.4.7.Key strategic moves and developments

9.5.NEW BALANCE INC

9.5.1.Company overview
9.5.2.Key Executives
9.5.3.Company snapshot
9.5.4.Product portfolio

9.6.NIKE, INC.

9.6.1.Company overview
9.6.2.Key Executives
9.6.3.Company snapshot
9.6.4.Operating business segments
9.6.5.Product portfolio
9.6.6.Business performance
9.6.7.Key strategic moves and developments

9.7.PUMA SE

9.7.1.Company overview
9.7.2.Key Executives
9.7.3.Company snapshot
9.7.4.Operating business segments
9.7.5.Product portfolio
9.7.6.R&D Expenditure
9.7.7.Business performance
9.7.8.Key strategic moves and developments

9.8.SKECHERS USA, INC.

9.8.1.Company overview
9.8.2.Key executives
9.8.3.Company snapshot
9.8.4.Operating business segments
9.8.5.Product portfolio
9.8.6.Business performance
9.8.7.Key strategic moves and developments

9.9.VF CORPORATION

9.9.1.Company overview
9.9.2.Key executive
9.9.3.Company snapshot
9.9.4.Operating business segments
9.9.5.Product portfolio
9.9.6.Business performance
9.9.7.Key strategic moves and developments

9.10.WOLVERINE WORLD WIDE, INC.

9.10.1.Company overview
9.10.2.Key executive
9.10.3.Company snapshot
9.10.4.Product portfolio
9.10.5.Business performance
9.10.6.Key strategic moves and developments

LIST OF TABLES

TABLE 01.GLOBAL ATHLETIC FOOTWEAR MARKET REVENUE, BY TYPE, 2020–2030 ($MILLION)
TABLE 02.GLOBAL ATHLETIC FOOTWEAR MARKET VOLUME, BY TYPE, 2020–2030 (MILLION)
TABLE 03.SPORTS SHOES MARKET REVENUE, BY REGION, 2020–2030 ($MILLION)
TABLE 04.RUNNING & WALKING FOOTWEAR MARKET REVENUE, BY REGION, 2020–2030 ($MILLION)
TABLE 05.HIKING AND BACKPACKING FOOTWEAR MARKET REVENUE, BY REGION, 2020–2030 ($MILLION)
TABLE 06.AEROBIC AND GYM WEAR FOOTWEAR MARKET REVENUE, BY REGION, 2020–2030 ($MILLION)
TABLE 07.ATHLETIC FOOTWEAR MARKET REVENUE, BY END USER 2020–2030 ($MILLION)
TABLE 08.MEN’S ATHLETIC FOOTWEAR MARKET REVENUE, BY REGION, 2020–2030 ($MILLION)
TABLE 09.WOMEN’S ATHLETIC FOOTWEAR MARKET REVENUE, BY REGION, 2020–2030 ($MILLION)
TABLE 10.KIDS ATHLETIC FOOTWEAR MARKET REVENUE, BY REGION, 2020–2030 ($MILLION)
TABLE 11.ATHLETIC FOOTWEAR MARKET REVENUE, BY DISTRIBUTION CHANNEL 2020-2030($MILLION)
TABLE 12.ATHLETIC FOOTWEAR MARKET REVENUE FROM HYPERMARKET/SUPERMARKET, BY REGION, 2020-2030($MILLION)
TABLE 13.ATHLETIC FOOTWEAR MARKET REVENUE FROM SPECIALTY STORE, BY REGION, 2020-2030($MILLION)
TABLE 14.ATHLETIC FOOTWEAR MARKET REVENUE FROM BRAND OUTLETS, BY REGION, 2020-2030($MILLION)
TABLE 15.ATHLETIC FOOTWEAR MARKET REVENUE FROM ONLINE SALES CHANNELS, BY REGION, 2020-2030($MILLION)
TABLE 16.ATHLETIC FOOTWEAR MARKET REVENUE, BY REGION, 2020–2030 ($MILLION)
TABLE 17.NORTH AMERICA ATHLETIC FOOTWEAR MARKET REVENUE, BY TYPE, 2020–2030 ($MILLION)
TABLE 18.NORTH AMERICA ATHLETIC FOOTWEAR MARKET VOLUME, BY TYPE, 2020–2030 (MILLION)
TABLE 19.NORTH AMERICA ATHLETIC FOOTWEAR MARKET REVENUE, BY END USER, 2020–2030 ($MILLION)
TABLE 20.NORTH AMERICA ATHLETIC FOOTWEAR MARKET REVENUE, BY DISTRIBUTION CHANNEL, 2020-2030($MILLION)
TABLE 21.NORTH AMERICA ATHLETIC FOOTWEAR MARKET REVENUE, BY COUNTRY, 2020–2030 ($MILLION)
TABLE 22.U.S. ATHLETIC FOOTWEAR MARKET REVENUE, BY TYPE, 2020–2030 ($MILLION)
TABLE 23.U.S.ATHLETIC FOOTWEAR MARKET VOLUME, BY TYPE, 2020–2030 (MILLION)
TABLE 24.U.S. ATHLETIC FOOTWEAR MARKET REVENUE, BY END USER, 2020–2030 ($MILLION)
TABLE 25.U.S ATHLETIC FOOTWEAR MARKET REVENUE, BY DISTRIBUTION CHANNEL, 2020-2030($MILLION)
TABLE 26.CANADA ATHLETIC FOOTWEAR MARKET REVENUE, BY TYPE, 2020–2030 ($MILLION)
TABLE 27.CANADA ATHLETIC FOOTWEAR MARKET VOLUME, BY TYPE, 2020–2030 (MILLION)
TABLE 28.CANADA. ATHLETIC FOOTWEAR MARKET REVENUE, BY END USER, 2020–2030 ($MILLION)
TABLE 29.CANADA ATHLETIC FOOTWEAR MARKET REVENUE, BY DISTRIBUTION CHANNEL, 2020-2030($MILLION)
TABLE 30.MEXICO ATHLETIC FOOTWEAR MARKET REVENUE, BY TYPE, 2020–2030 ($MILLION)
TABLE 31.MEXICO ATHLETIC FOOTWEAR MARKET VOLUME, BY TYPE, 2020–2030 (MILLION)
TABLE 32.MEXICO ATHLETIC FOOTWEAR MARKET REVENUE, BY END USER, 2020–2030 ($MILLION)
TABLE 33.MEXICO ATHLETIC FOOTWEAR MARKET REVENUE, BY DISTRIBUTION CHANNEL, 2020-2030($MILLION)
TABLE 34.EUROPE ATHLETIC FOOTWEAR MARKET REVENUE, BY TYPE, 2020–2030 ($MILLION)
TABLE 35.EUROPE ATHLETIC FOOTWEAR MARKET VOLUME, BY TYPE, 2020–2030 (MILLION)
TABLE 36.EUROPE ATHLETIC FOOTWEAR MARKET REVENUE, BY END USER, 2020–2030 ($MILLION)
TABLE 37.EUROPE ATHLETIC FOOTWEAR MARKET REVENUE, BY DISTRIBUTION CHANNEL, 2020-2030($MILLION)
TABLE 38.EUROPE ATHLETIC FOOTWEAR MARKET REVENUE, BY COUNTRY, 2020–2030 ($MILLION)
TABLE 39.UK ATHLETIC FOOTWEAR MARKET REVENUE, BY TYPE, 2020–2030 ($MILLION)
TABLE 40.UK ATHLETIC FOOTWEAR MARKET VOLUME, BY TYPE, 2020–2030 (MILLION)
TABLE 41.UK ATHLETIC FOOTWEAR MARKET REVENUE, BY END USER, 2020–2030 ($MILLION)
TABLE 42.UK ATHLETIC FOOTWEAR MARKET REVENUE, BY DISTRIBUTION CHANNEL, 2020-2030($MILLION)
TABLE 43.GERMANY ATHLETIC FOOTWEAR MARKET REVENUE, BY TYPE, 2020–2030 ($MILLION)
TABLE 44.GERMANY ATHLETIC FOOTWEAR MARKET VOLUME, BY TYPE, 2020–2030 (MILLION)
TABLE 45.GERMANY ATHLETIC FOOTWEAR MARKET REVENUE, BY END USER, 2020–2030 ($MILLION)
TABLE 46.GERMANY ATHLETIC FOOTWEAR MARKET REVENUE, BY DISTRIBUTION CHANNEL, 2020-2030($MILLION)
TABLE 47.FRANCE ATHLETIC FOOTWEAR MARKET REVENUE, BY TYPE, 2020–2030 ($MILLION)
TABLE 48.FRANCE ATHLETIC FOOTWEAR MARKET VOLUME, BY TYPE, 2020–2030 (MILLION)
TABLE 49.FRANCE. ATHLETIC FOOTWEAR MARKET REVENUE, BY END USER, 2020–2030 ($MILLION)
TABLE 50.FRANCE ATHLETIC FOOTWEAR MARKET REVENUE, BY DISTRIBUTION CHANNEL, 2020-2030($MILLION)
TABLE 51.ITALY ATHLETIC FOOTWEAR MARKET REVENUE, BY TYPE, 2020–2030 ($MILLION)
TABLE 52.ITALY ATHLETIC FOOTWEAR MARKET VOLUME, BY TYPE, 2020–2030 (MILLION)
TABLE 53.ITALY ATHLETIC FOOTWEAR MARKET REVENUE, BY END USER, 2020–2030 ($MILLION)
TABLE 54.ITALY ATHLETIC FOOTWEAR MARKET REVENUE, BY DISTRIBUTION CHANNEL, 2020-2030($MILLION)
TABLE 55.SPAIN ATHLETIC FOOTWEAR MARKET REVENUE, BY TYPE, 2020–2030 ($MILLION)
TABLE 56.SPAIN ATHLETIC FOOTWEAR MARKET VOLUME, BY TYPE, 2020–2030 (MILLION)
TABLE 57.SPAIN. ATHLETIC FOOTWEAR MARKET REVENUE, BY END USER, 2020–2030 ($MILLION)
TABLE 58.SPAIN ATHLETIC FOOTWEAR MARKET REVENUE, BY DISTRIBUTION CHANNEL, 2020-2030($MILLION)
TABLE 59.RUSSIA ATHLETIC FOOTWEAR MARKET REVENUE, BY TYPE, 2020–2030 ($MILLION)
TABLE 60.RUSSIA ATHLETIC FOOTWEAR MARKET VOLUME, BY TYPE, 2020–2030 (MILLION)
TABLE 61.RUSSIA ATHLETIC FOOTWEAR MARKET REVENUE, BY END USER, 2020–2030 ($MILLION)
TABLE 62.RUSSIA ATHLETIC FOOTWEAR MARKET REVENUE, BY DISTRIBUTION CHANNEL, 2020-2030($MILLION)
TABLE 63.REST OF EUROPE ATHLETIC FOOTWEAR MARKET REVENUE, BY TYPE, 2020–2030 ($MILLION)
TABLE 64.REST OF EUROPE ATHLETIC FOOTWEAR MARKET VOLUME, BY TYPE, 2020–2030 (MILLION)
TABLE 65.REST OF EUROPE ATHLETIC FOOTWEAR MARKET REVENUE, BY END USER, 2020–2030 ($MILLION)
TABLE 66.REST OF EUROPE ATHLETIC FOOTWEAR MARKET REVENUE, BY DISTRIBUTION CHANNEL, 2020-2030($MILLION)
TABLE 67.ASIA-PACIFIC ATHLETIC FOOTWEAR MARKET REVENUE, BY TYPE, 2020–2030 ($MILLION)
TABLE 68.ASIA-PACIFIC ATHLETIC FOOTWEAR MARKET VOLUME, BY TYPE, 2020–2030 (MILLION)
TABLE 69.ASIA-PACIFIC ATHLETIC FOOTWEAR MARKET REVENUE, BY END USER, 2020–2030 ($MILLION)
TABLE 70.ASIA-PACIFIC ATHLETIC FOOTWEAR MARKET REVENUE, BY DISTRIBUTION CHANNEL, 2020-2030($MILLION)
TABLE 71.ASIA-PACIFIC ATHLETIC FOOTWEAR MARKET REVENUE, BY COUNTRY, 2020–2030 ($MILLION)
TABLE 72.CHINA ATHLETIC FOOTWEAR MARKET REVENUE, BY TYPE, 2020–2030 ($MILLION)
TABLE 73.CHINA ATHLETIC FOOTWEAR MARKET VOLUME, BY TYPE, 2020–2030 (MILLION)
TABLE 74.CHINA ATHLETIC FOOTWEAR MARKET REVENUE, BY END USER, 2020–2030 ($MILLION)
TABLE 75.CHINA ATHLETIC FOOTWEAR MARKET REVENUE, BY DISTRIBUTION CHANNEL, 2020-2030($MILLION)
TABLE 76.INDIA ATHLETIC FOOTWEAR MARKET REVENUE, BY TYPE, 2020–2030 ($MILLION)
TABLE 77.INDIA ATHLETIC FOOTWEAR MARKET VOLUME, BY TYPE, 2020–2030 (MILLION)
TABLE 78.INDIA ATHLETIC FOOTWEAR MARKET REVENUE, BY END USER, 2020–2030 ($MILLION)
TABLE 79.INDIA ATHLETIC FOOTWEAR MARKET REVENUE, BY DISTRIBUTION CHANNEL, 2020-2030($MILLION)
TABLE 80.JAPAN ATHLETIC FOOTWEAR MARKET REVENUE, BY TYPE, 2020–2030 ($MILLION)
TABLE 81.ATHLETIC FOOTWEAR MARKET VOLUME, BY TYPE, 2020–2030 (MILLION)
TABLE 82.JAPAN ATHLETIC FOOTWEAR MARKET REVENUE, BY END USER, 2020–2030 ($MILLION)
TABLE 83.JAPAN ATHLETIC FOOTWEAR MARKET REVENUE, BY DISTRIBUTION CHANNEL, 2020-2030($MILLION)
TABLE 84.AUSTRALIA & NEWZEALAND ATHLETIC FOOTWEAR MARKET REVENUE, BY TYPE, 2020–2030 ($MILLION)
TABLE 85.AUSTRALIA & NEWZEALAND ATHLETIC FOOTWEAR MARKET VOLUME, BY TYPE, 2020–2030 (MILLION)
TABLE 86.AUSTRALIA & NEWZEALAND ATHLETIC FOOTWEAR MARKET REVENUE, BY END USER, 2020–2030 ($MILLION)
TABLE 87.AUSTRALIA & NEWZEALAND ATHLETIC FOOTWEAR MARKET REVENUE, BY DISTRIBUTION CHANNEL, 2020-2030($MILLION)
TABLE 88.ASEAN ATHLETIC FOOTWEAR MARKET REVENUE, BY TYPE, 2020–2030 ($MILLION)
TABLE 89.ASEAN ATHLETIC FOOTWEAR MARKET VOLUME, BY TYPE, 2020–2030 (MILLION)
TABLE 90.ASEAN ATHLETIC FOOTWEAR MARKET REVENUE, BY END USER, 2020–2030 ($MILLION)
TABLE 91.ASEAN ATHLETIC FOOTWEAR MARKET REVENUE, BY DISTRIBUTION CHANNEL, 2020-2030($MILLION)
TABLE 92.SOUTH KOREA ATHLETIC FOOTWEAR MARKET REVENUE, BY TYPE, 2020–2030 ($MILLION)
TABLE 93.SOUTH KOREA ATHLETIC FOOTWEAR MARKET VOLUME, BY TYPE, 2020–2030 (MILLION)
TABLE 94.SOUTH KOREA ATHLETIC FOOTWEAR MARKET REVENUE, BY END USER, 2020–2030 ($MILLION)
TABLE 95.SOUTH KOREA ATHLETIC FOOTWEAR MARKET REVENUE, BY DISTRIBUTION CHANNEL, 2020-2030($MILLION)
TABLE 96.REST OF ASIA-PACIFIC ATHLETIC FOOTWEAR MARKET REVENUE, BY TYPE, 2020–2030 ($MILLION)
TABLE 97.REST OF ASIA-PACIFIC ATHLETIC FOOTWEAR MARKET VOLUME, BY TYPE, 2020–2030 (MILLION)
TABLE 98.REST OF ASIA-PACIFIC ATHLETIC FOOTWEAR MARKET REVENUE, BY END USER, 2020–2030 ($MILLION)
TABLE 99.REST OF ASIA-PACIFIC ATHLETIC FOOTWEAR MARKET REVENUE, BY DISTRIBUTION CHANNEL, 2020-2030($MILLION)
TABLE 100.LAMEA ATHLETIC FOOTWEAR MARKET REVENUE, BY TYPE, 2020–2030 ($MILLION)
TABLE 101.LAMEA ATHLETIC FOOTWEAR MARKET VOLUME, BY TYPE, 2020–2030 (MILLION)
TABLE 102.LAMEA ATHLETIC FOOTWEAR MARKET REVENUE, BY END USER, 2020–2030 ($MILLION)
TABLE 103.LAMEA ATHLETIC FOOTWEAR MARKET REVENUE, BY DISTRIBUTION CHANNEL, 2020-2030($MILLION)
TABLE 104.LAMEA ATHLETIC FOOTWEAR MARKET REVENUE, BY COUNTRY, 2020–2030 ($MILLION)
TABLE 105.BRAZIL ATHLETIC FOOTWEAR MARKET REVENUE, BY TYPE, 2020–2030 ($MILLION)
TABLE 106.BRAZIL ATHLETIC FOOTWEAR MARKET VOLUME, BY TYPE, 2020–2030 (MILLION)
TABLE 107.BRAZIL ATHLETIC FOOTWEAR MARKET REVENUE, BY END USER, 2020–2030 ($MILLION)
TABLE 108.BRAZIL ATHLETIC FOOTWEAR MARKET REVENUE, BY DISTRIBUTION CHANNEL, 2020-2030($MILLION)
TABLE 109.ARGENTINA ATHLETIC FOOTWEAR MARKET REVENUE, BY TYPE, 2020–2030 ($MILLION)
TABLE 110.ARGENTINA ATHLETIC FOOTWEAR MARKET VOLUME, BY TYPE, 2020–2030 (MILLION)
TABLE 111.ARGENTINA ATHLETIC FOOTWEAR MARKET REVENUE, BY END USER, 2020–2030 ($MILLION)
TABLE 112.ARGENTINA ATHLETIC FOOTWEAR MARKET REVENUE, BY DISTRIBUTION CHANNEL, 2020-2030($MILLION)
TABLE 113.SAUDI ARABIA ATHLETIC FOOTWEAR MARKET REVENUE, BY TYPE, 2020–2030 ($MILLION)
TABLE 114.SAUDI ARABIA ATHLETIC FOOTWEAR MARKET VOLUME, BY TYPE, 2020–2030 (MILLION)
TABLE 115.SAUDI ARABIA ATHLETIC FOOTWEAR MARKET REVENUE, BY END USER, 2020–2030 ($MILLION)
TABLE 116.SAUDI ARABIA ATHLETIC FOOTWEAR MARKET REVENUE, BY DISTRIBUTION CHANNEL, 2020-2030($MILLION)
TABLE 117.SOUTH AFRICA ATHLETIC FOOTWEAR MARKET REVENUE, BY TYPE, 2020–2030 ($MILLION)
TABLE 118.ATHLETIC FOOTWEAR MARKET VOLUME, BY TYPE, 2020–2030 (MILLION)
TABLE 119.SOUTH AFRICA ATHLETIC FOOTWEAR MARKET REVENUE, BY END USER, 2020–2030 ($MILLION)
TABLE 120.SOUTH AFRICA ATHLETIC FOOTWEAR MARKET REVENUE, BY DISTRIBUTION CHANNEL, 2020-2030($MILLION)
TABLE 121.REST OF LAMEA ATHLETIC FOOTWEAR MARKET REVENUE, BY TYPE, 2020–2030 ($MILLION)
TABLE 122.REST OF LAMEA ATHLETIC FOOTWEAR MARKET VOLUME, BY TYPE, 2020–2030 (MILLION)
TABLE 123.REST OF LAMEA ATHLETIC FOOTWEAR MARKET REVENUE, BY END USER, 2020–2030 ($MILLION)
TABLE 124.REST OF LAMEA ATHLETIC FOOTWEAR MARKET REVENUE, BY DISTRIBUTION CHANNEL, 2020-2030($MILLION)
TABLE 125.ADIDAS AG: KEY EXECUTIVES
TABLE 126.ADIDAS AG: COMPANY SNAPSHOT
TABLE 127.ADIDAS AG: OPERATING SEGMENTS
TABLE 128.ADIDAS AG: PRODUCT PORTFOLIO
TABLE 129.ADIDAS AG: R&D EXPENDITURE, 2018–2020 ($MILLION)
TABLE 130.ADIDAS AG: NET SALES, 2018–2020 ($MILLION)
TABLE 131.ASICS CORPORATION: KEY EXECUTIVES
TABLE 132.ASICS CORPORATION: COMPANY SNAPSHOT
TABLE 133.ASICS CORPORATION: OPERATING SEGMENTS
TABLE 134.ASICS CORPORATION: PRODUCT PORTFOLIO
TABLE 135.ASICS CORPORATION: R&D EXPENDITURE, 2018–2020 ($MILLION)
TABLE 136.ASICS CORPORATION: NET SALES, 2018–2020 ($MILLION)
TABLE 137.FILA HOLDINGS CORP.: KEY EXECUTIVES
TABLE 138.FILA HOLDINGS CORP.: COMPANY SNAPSHOT
TABLE 139.FILA HOLDINGS CORP.: PRODUCT PORTFOLIO
TABLE 140.FILA HOLDINGS CORP.: NET SALES, 2018–2020 ($MILLION)
TABLE 141.K-SWISS: KEY EXECUTIVES
TABLE 142.K-SWISS: COMPANY SNAPSHOT
TABLE 143.K-SWISS: OPERATING SEGMENTS
TABLE 144.K-SWISS: PRODUCT PORTFOLIO
TABLE 145.K-SWISS: NET SALES, 2018–2020 ($MILLION)
TABLE 146.NEW BALANCE INC: KEY EXECUTIVES
TABLE 147.NEW BALANCE INC: COMPANY SNAPSHOT
TABLE 148.NEW BALANCE INC: PRODUCT PORTFOLIO
TABLE 149.NIKE, INC.: KEY EXECUTIVES
TABLE 150.NIKE, INC.: COMPANY SNAPSHOT
TABLE 151.NIKE, INC.: OPERATING SEGMENTS
TABLE 152.NIKE, INC.: PRODUCT PORTFOLIO
TABLE 153.NIKE, INC.: NET SALES, 2018–2020 ($MILLION)
TABLE 154.PUMA SE: KEY EXECUTIVES
TABLE 155.PUMA SE: COMPANY SNAPSHOT
TABLE 156.PUMA SE: OPERATING SEGMENTS
TABLE 157.PUMA SE: PRODUCT PORTFOLIO
TABLE 158.PUMA SE: R&D EXPENDITURE, 2018–2020 ($MILLION)
TABLE 159.PUMA SE: NET SALES, 2018–2020 ($MILLION)
TABLE 160.SKECHERS U.S.A., INC: KEY EXECUTIVES
TABLE 161.SKECHERS U.S.A., INC: COMPANY SNAPSHOT
TABLE 162.SKECHERS U.S.A., INC: OPERATING SEGMENTS
TABLE 163.SKECHERS U.S.A., INC: PRODUCT PORTFOLIO
TABLE 164.SKECHERS U.S.A., INC: NET SALES, 2018–2020 ($MILLION)
TABLE 165.VF CORPORATION: KEY EXECUTIVES
TABLE 166.VF CORPORATION: COMPANY SNAPSHOT
TABLE 167.VF CORPORATION: OPERATING SEGMENTS
TABLE 168.VF CORPORATION,LTD.: PRODUCT PORTFOLIO
TABLE 169.VF CORPORATION, LTD.: NET SALES, 2018–2020 ($MILLION)
TABLE 170.VF CORPORATION: KEY STRATEGIC MOVES AND DEVELOPMENTS
TABLE 171.WOLVERINE WORLD WIDE, INC.: KEY EXECUTIVES
TABLE 172.WOLVERINE WORLD WIDE, INC.: COMPANY SNAPSHOT
TABLE 173.WOLVERINE WORLD WIDE, INC.: PRODUCT PORTFOLIO
TABLE 174.WOLVERINE WORLD WIDE, INC.: NET SALES, 2018–2020 ($MILLION)
TABLE 175.WOLVERINE WORLD WIDE, INC.: KEY STRATEGIC MOVES AND DEVELOPMENTS

LIST OF FIGURES

FIGURE 01.ATHLETIC FOOTWEAR MARKET SNAPSHOT
FIGURE 02.ATHLETIC FOOTWEAR MARKET: SEGMENTATION
FIGURE 03.TOP INVESTMENT POCKETS
FIGURE 04.MODERATE BARGAINING POWER OF SUPPLIERS
FIGURE 05.HIGH BARGAINING POWER OF BUYER
FIGURE 06.LOW THREAT OF SUBSTITUTION
FIGURE 07.HIGH THREAT OF NEW ENTRANTS
FIGURE 08.HIGH INTENSITY OF COMPETITIVE RIVALRY
FIGURE 09.ATHLETIC FOOTWEAR MARKET: PRICING ANALYSIS
FIGURE 10.ATHLETIC FOOTWEAR MARKET: TOP IMPACTING FACTOR
FIGURE 11.ATHLETIC FOOTWEAR MARKET: PARENT MARKET ANALYSIS
FIGURE 12.ATHLETIC FOOTWEAR MARKET: DRIVERS, RESTRAINTS, AND OPPORTUNITIES
FIGURE 13.ATHLETIC FOOTWEAR MARKET, BY TYPE, 2020 (%)
FIGURE 14.COMPARATIVE MARKET SHARE ANALYSIS OF SPORTS SHOES ATHLETIC FOOTWEAR MARKET, BY COUNTRY, 2020 AND 2030 (%)
FIGURE 15.COMPARATIVE MARKET SHARE ANALYSIS OF RUNNING & WALKING FOOTWEAR MARKET, BY COUNTRY 2020 AND 2030 (%)
FIGURE 16.COMPARATIVE MARKET SHARE ANALYSIS OF HIKING AND BACKPACKING FOOTWEAR MARKET, BY COUNTRY 2020 AND 2030 (%)
FIGURE 17.COMPARATIVE MARKET SHARE ANALYSIS OF AEROBIC AND GYM WEAR SHOES ATHLETIC FOOTWEAR MARKET, BY COUNTRY 2020 AND 2030 (%)
FIGURE 18.ATHLETIC FOOTWEAR MARKET, BY END USER, 2020 (%)
FIGURE 19.COMPARATIVE MARKET SHARE ANALYSIS OF MEN’S ATHLETIC FOOTWEAR MARKET, BY COUNTRY, 2020 AND 2030 (%)
FIGURE 20.COMPARATIVE MARKET SHARE ANALYSIS OF WOMEN’S ATHLETIC FOOTWEAR MARKET, BY COUNTRY, 2020 AND 2030 (%)
FIGURE 21.COMPARATIVE MARKET SHARE ANALYSIS OF KIDS ATHLETIC FOOTWEAR MARKET,  BY COUNTRY, 2020 AND 2030 (%)
FIGURE 22.ATHLETIC FOOTWEAR MARKET, BY DISTRIBUTION CHANNEL, 2020 (%)
FIGURE 23.COMPARATIVE MARKET SHARE ANALYSIS OF ATHLETIC FOOTWEAR MARKET REVENUE FROM HYPERMARKET/SUPERMARKET, BY COUNTRY, 2020 AND 2030(%)
FIGURE 24.COMPARATIVE REGIONAL MARKET SHARE ANALYSIS OF ATHLETIC FOOTWEAR MARKET FROM SPECIALTY STORE, BY COUNTRY, 2020 AND 2030(%)
FIGURE 25.COMPARATIVE L MARKET SHARE ANALYSIS OF ATHLETIC FOOTWEAR MARKET REVENUE FROM BRAND OUTLETS, BY COUNTRY, 2020 AND 2030(%)
FIGURE 26.COMPARATIVE MARKET SHARE ANALYSIS OF ATHLETIC FOOTWEAR MARKET REVENUE FROM ONLINE SALES CHANNELS, BY COUNTRY, 2020 AND 2030(%)
FIGURE 27.ATHLETIC FOOTWEAR MARKET, BY REGION, 2020 (%)
FIGURE 28.U.S. ATHLETIC FOOTWEAR MARKET REVENUE, 2020–2030 ($MILLION)
FIGURE 29.CANADA ATHLETIC FOOTWEAR MARKET REVENUE, 2020–2030 ($MILLION)
FIGURE 30.MEXICO ATHLETIC FOOTWEAR MARKET REVENUE, 2020–2030 ($MILLION)
FIGURE 31.UK ATHLETIC FOOTWEAR MARKET REVENUE, 2020–2030 ($MILLION)
FIGURE 32.GERMANY. ATHLETIC FOOTWEAR MARKET REVENUE, 2020–2030 ($MILLION)
FIGURE 33.FRANCE ATHLETIC FOOTWEAR MARKET REVENUE, 2020–2030 ($MILLION)
FIGURE 34.ITALY ATHLETIC FOOTWEAR MARKET REVENUE, 2020–2030 ($MILLION)
FIGURE 35.SPAIN ATHLETIC FOOTWEAR MARKET REVENUE, 2020–2030 ($MILLION)
FIGURE 36.RUSSIA ATHLETIC FOOTWEAR MARKET REVENUE, 2020–2030 ($MILLION)
FIGURE 37.REST OF EUROPE ATHLETIC FOOTWEAR MARKET REVENUE, 2020–2030 ($MILLION)
FIGURE 38.CHINA ATHLETIC FOOTWEAR MARKET REVENUE, 2020–2030 ($MILLION)
FIGURE 39.INDIA ATHLETIC FOOTWEAR MARKET REVENUE, 2020–2030 ($MILLION)
FIGURE 40.JAPAN ATHLETIC FOOTWEAR MARKET REVENUE, 2020–2030 ($MILLION)
FIGURE 41.AUSTRALIA & NEWZEALAND ATHLETIC FOOTWEAR MARKET REVENUE, 2020–2030 ($MILLION)
FIGURE 42.ASEAN ATHLETIC FOOTWEAR MARKET REVENUE, 2020–2030 ($MILLION)
FIGURE 43.SOUTH KOREA ATHLETIC FOOTWEAR MARKET REVENUE, 2020–2030 ($MILLION)
FIGURE 44.REST OF ASIA-PACIFIC ATHLETIC FOOTWEAR MARKET REVENUE, 2020–2030 ($MILLION)
FIGURE 45.BRAZIL ATHLETIC FOOTWEAR MARKET REVENUE, 2020–2030 ($MILLION)
FIGURE 46.ARGENTINA ATHLETIC FOOTWEAR MARKET REVENUE, 2020–2030 ($MILLION)
FIGURE 47.SAUDI ARABIA ATHLETIC FOOTWEAR MARKET REVENUE, 2020–2030 ($MILLION)
FIGURE 48.SOUTH AFRICA ATHLETIC FOOTWEAR MARKET REVENUE, 2020–2030 ($MILLION)
FIGURE 49.REST OF LAMEA ATHLETIC FOOTWEAR MARKET REVENUE, 2020–2030 ($MILLION)
FIGURE 50.TOP WINNING STRATEGIES, BY YEAR, 2018–2021*
FIGURE 51.TOP WINNING STRATEGIES, BY DEVELOPMENT, 2018–2021* (%)
FIGURE 52.TOP WINNING STRATEGIES, BY COMPANY, 2018–2021*
FIGURE 53.PRODUCT MAPPING OF TOP 10 KEY PLAYERS
FIGURE 54.COMPETITIVE DASHBOARD OF TOP 10 KEY PLAYERS
FIGURE 55.COMPETITIVE HEATMAP OF TOP 10 KEY PLAYERS
FIGURE 56.ADIDAS AG: R&D EXPENDITURE, 2018–2020 ($MILLION)
FIGURE 57.ADIDAS AG: NET SALES, 2018–2020 ($MILLION)
FIGURE 58.ADIDAS AG: REVENUE SHARE BY SEGMENT, 2020 (%)
FIGURE 59.ADIDAS AG: REVENUE SHARE BY REGION, 2020 (%)
FIGURE 60.ASICS CORPORATION: R&D EXPENDITURE, 2018–2020 ($MILLION)
FIGURE 61.ASICS CORPORATION: NET SALES, 2018–2020 ($MILLION)
FIGURE 62.ASICS CORPORATION: REVENUE SHARE BY SEGMENT, 2020 (%)
FIGURE 63.ASICS CORPORATION: REVENUE SHARE BY REGION, 2020 (%)
FIGURE 64.FILA HOLDINGS CORP.: NET SALES, 2018–2020 ($MILLION)
FIGURE 65.K-SWISS: NET SALES, 2018–2020 ($MILLION)
FIGURE 66.K-SWISS: REVENUE SHARE BY SEGMENT, 2020 (%)
FIGURE 67.NIKE, INC.: NET SALES, 2018–2020 ($MILLION)
FIGURE 68.NIKE, INC.: REVENUE SHARE BY SEGMENT, 2020 (%)
FIGURE 69.PUMA SE: R&D EXPENDITURE, 2018–2020 ($MILLION)
FIGURE 70.PUMA SE: NET SALES, 2018–2020 ($MILLION)
FIGURE 71.PUMA SE: REVENUE SHARE BY SEGMENT, 2020 (%)
FIGURE 72.SKECHERS U.S.A., INC: NET SALES, 2018–2020 ($MILLION)
FIGURE 73.SKECHERS U.S.A., INC: REVENUE SHARE BY SEGMENT, 2019 (%)
FIGURE 74.SKECHERS U.S.A., INC: REVENUE SHARE BY REGION, 2019 (%)
FIGURE 75.VF CORPORATION: REVENUE, 2018–2020 ($MILLION)
FIGURE 76.VF CORPORATION: REVENUE SHARE BY SEGMENT, 2019 (%)
FIGURE 77.WOLVERINE WORLD WIDE, INC.: NET SALES, 2018–2020 ($MILLION)
FIGURE 78.WOLVERINE WORLD WIDE, INC.: REVENUE SHARE BY SEGMENT, 2020 (%)


Asia-Pacific constitutes the largest share in the global athletic footwear market, owing to of large population base and high involvement of consumers in sports activities in countries such as India and China. Various kinds of athletic footwear include sports shoes (tennis, cricket, soccer, and similar other sports), running & walking shoes, hiking & backpacking shoes, and shoes worn for aerobics and gym. Within different types of sports shoes as mentioned above, tennis shoes are anticipated to witness greater adoption across the world, owing to their increasing usage as lifestyle and fashion footwear in countries such as the U.S. and Canada. Moreover, in emerging countries such as India and China, adoption of sports shoes is expected to increase as a result of increasing participation in sports such as soccer and basketball. Government initiatives in these emerging economies have helped in popularizing various kinds of sports, leading to increase in demand for athletic footwear in Asia-Pacific region. The demand for high-quality athletic footwear is relatively lower in developing countries as compared to developed markets, owing to price sensitivity.

Owing to strict government regulations to curb pollution and increase in consciousness toward health and environmental sustainability, manufacturers are looking for ways to move their production units toward industrial areas. In addition, players have adopted product launch and acquisition as their growth strategies to further strengthen their foothold in the athletic footwear market. For instance, Adidas acquired fitness technology firm Runtastic in August 2015, which provided mobile apps and proprietary hardware that enabled users a detailed analysis of their fitness activities.

PURCHASE OPTIONS

Call or Email us

U.S.-Canada Toll-free: +1-800-792-5285
Int'l : +1-503-894-6022
Europe : +44-845-528-1300
Email : help@alliedmarketresearch.com
 
FREQUENTLY ASKED QUESTIONS?

A. The market size of athletic footwear is expected to reach $165.0 billion in 2030.

A. The CAGR of athletic footwear Market is 4.2% over the forecast period.

A. 2021-2030 would be forecast period in the market report.

A. Type, end user, distribution channel and region are the segments of athletic footwear market

A. Asics Corporation, Adidas AG, Puma, VF Corporation, Nike, Inc., FILA Korea, Ltd. are the top companies in the athletic footwear market

A. Kindly raise an inquiry through the chat box and our business executive will get in touch with you with the details on the purchase options

A. Change in life style, growing health awareness, and rise in number of sports inspired by children are some of the upcoming trends in athletic footwear market.

A. Increase in sales is expect to continue in the post COVID-19 scenario in athletic footwear market.

Looking for Customization?

 Customization Request

Have a Question?

 Speak with Analyst

Any Confusion?

 Inquire Before Buying

Have a glance of the Report

  Request Sample
RELATED TAGS

Purchase Full Report of
Athletic Footwear Market

Start reading instantly.
This Report and over 66,804+ more Reports, Available with Avenue Library. T&C*.

  • Online Only
  • $3,712
  • Online cloud access only
  • Restricted print, copy, paste & download
  • Read only
  • Free industry update
    (Within 180 days)
  • Free report update in next update cycle
    (Dec 2022 - Dec 2023)
  • Data Pack
  • $4,125
  • Restricted to one authorized user
  • One print only
  • Available in
    Excel
  • Free industry update
    (Within 180 days)
  •   Free report update in next update cycle
    (Dec 2022 - Dec 2023)
  • Single User
  • $5,769
  • Restricted to one authorized user
  • One print only
  • Available in
    PDF
  • Free industry update
    (Within 180 days)
  •   Free report update in next update cycle
    (Dec 2022 - Dec 2023)
  • Five Users
  • $6,929
  • Limited to five authorized users
  • Print upto five copies
  • Available in
    PDF
  • Free industry update
    (Within 180 days)
  •   Free report update in next update cycle
    (Dec 2022 - Dec 2023)
  • Enterprise
    License/PDF

  • $10,663
  • Unlimited
    within
    company/enterprise
  • Available in Excel & PDF
  • Free industry update
    (Within 180 days)
  •   Free report update in next update cycle
    (Dec 2022 - Dec 2023)
  • Library
    Membership

  • $999 $ 1,175
    Per User/ Per month/ Billed annually
  • Published Content
    E-access
  • Company Profiles
    E-access
  • Newly Added Content Access
  • 10 PDF
    Downloads
  • 5 Excel Data
    Pack Downloads
  • 250 Company Profiles PDF Downloads
  • Buy Now

*Taxes/Fees, if applicable will be added during checkout. All prices in USD

RELATED REPORTS
 

Why Allied Market Research?


Infallible Methodology

To ensure high-level data integrity, accurate analysis, and impeccable forecasts

Analyst Support

For complete satisfaction

Customization

On-demand customization of scope of the report to exactly meet your needs

TARGETED MARKET VIEW

Targeted market view to provide pertinent information and save time of readers

Get fresh content delivered

Get insights on topics that are crucial for your business. Stay abreast of your interest areas.

Get Industry Data Alerts

Why Allied Market Research?

Infallible Methodology

To ensure high-level data integrity, accurate analysis, and impeccable forecasts

Analyst Support

For complete satisfaction

Customization

On-demand customization of scope of the report to exactly meet your needs

TARGETED MARKET VIEW

Targeted market view to provide pertinent information and save time of readers