0
2018
Australian Pressure Safety Valve Market

Australian Pressure Safety Valve Market

by Offering (Safety Valve and Safety Valve Component), Safety Valve (Spring Loaded Valve, Spring Operated Valve, and Dead Weight Valve), End-user Industry (Oil & Gas, Power & Energy, Healthcare & Pharmaceutical, Water Supply System, and Others) - Opportunity Analysis and Industry Forecast, 2017-2025

Report Code: A04350
Jun 2018 | Pages: 103
Tables: 29
Charts: 30
  • Formats*:

  • pdf

    Single User License, Five User
    License & Enterprise User License

  • xls

    Data Pack Excel License

  • ppt

    It comes with the additional cost
    of $2500.00 contact sales.


COVID-19

Pandemic disrupted the entire world and affected many industries.

Get detailed COVID-19 impact analysis on the Australian Pressure Safety Valve Market

Request Now !

Australian Pressure Safety Valve Market Overview:

The Australia Pressure Safety Valve Market size was valued at $52.12 million in 2017 and is expected to reach $65.38 million by 2025, registering a CAGR of 2.88% from 2018 to 2025. Pressure safety valves, also known as pressure relief valves or simply relief valves, ensure safety of pressure-based systems.

Industrial valves comprise many products that manage the flow of gases and fluids in industrial applications. Among these, pressure safety valves are designed for process control, process safety, original equipment manufacturer (OEM) applications, and others across several end-user industries. These valves prevent the over-pressurization of pressure-based equipment and machineries by sensing and subsequently guiding the additional surge in pressure towards alternate passages or into atmosphere. As a result, they are used in steam boilers, heating boilers, pressure-based vessels and systems, OEM applications, industrial machineries, and other applications. The valve design and construction are varied to have a manual or automatically-operated opening and closing of valves at working settings during the system operation.

Industrial spending towards increasing the manufacturing and production capabilities of Australian end-user industries has a profound influence over the growth of pressure safety valve market over the forecast period. To cater to the increase in demand to improve plant efficiency, equipment and machinery are constantly operated around maximum capabilities. As a result, to ensure the workplace safety and prevent over-pressurization of pressure systems, constant observation and supervision of pressure safety valves are mandatory to reduce the additional pressure developed during operation. This drives the demand for safety valves and their components across many end-user industries. Moreover, the Australian governments initiatives towards extensive offshore exploration of Australian waters to determine the potential availability of natural gas and petroleum reserves are also anticipated to boost the demand for safety valves in the oil & gas sector. However, the increasing technical and manufacturing capabilities of emerging economies in the Asian region are expected to hinder the growth of certain end-user industries, such as chemicals, textile, paper & pulp, commercial construction, and others. Whereas, achieving competitive prices in niche segments, such as OEMs and industry sectors, is anticipated to provide profitable opportunities for the Australian pressure safety valve market players.

The safety valve market provides safety valves and their components for subsequent maintenance, services, and repairs. As a result, on the basis of offering, the market is bifurcated into safety valve and safety valve component. Further, the safety valve types are spring loaded valves, pilot operated valves, and dead weight valves. Safety valves have numerous applications across different industry verticals. For instance, safety valves find significant application in chemicals dosing, water treatment, mid-stream, up-stream, down-stream, chemicals processing, construction, food processing, industrial waste treatment, and others. Safety valves are used in various end-user industries, such as oil & gas, power & energy, healthcare & pharmaceutical, water supply system, and others.

by offerings

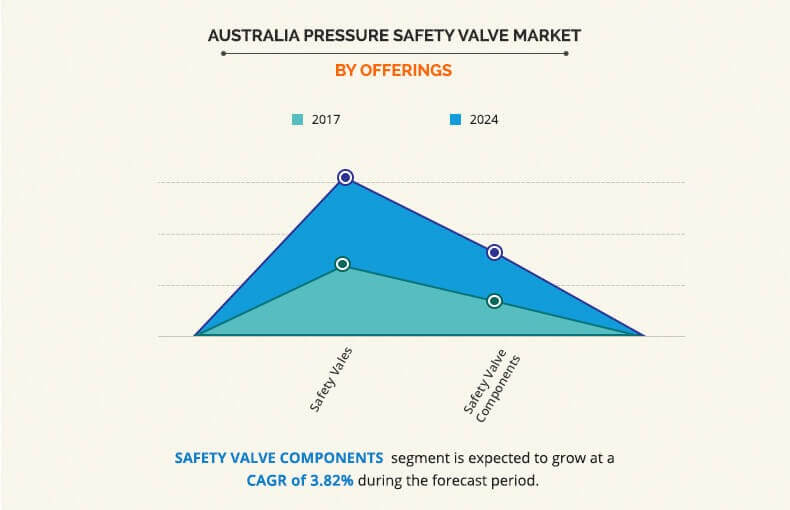
As depicted in the figure above, the safety valve market constitutes a significant market share among the offerings. However, the safety valve component market is expected to witness attractive growth rates in the forecast period. Factors, such as new plant installations, sophisticated machinery, and expansion of production capacity, are major driving factors for the safety valve segment. In addition, the continuous maintenance, services, and repairs-related activities continue to provide a steady stream of revenue for safety valve manufacturers. Thus, the Australian pressure safety valve market is anticipated to witness a moderate growth rate in the coming years.

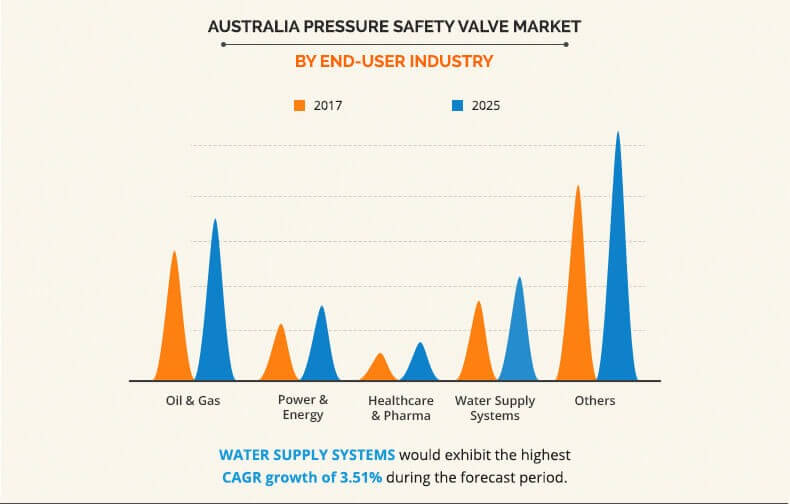
The application of safety valves in mid-stream, up-stream, and down-stream applications in the oil & gas industry has resulted in significant installation of safety valves. Further, the wide distribution network of the oil & gas industry requires constant maintenance and services of its safety valves. As a result, the oil & gas industry accounted for a significant market share in the safety valve market shown below. Further, the increasing demand for water supply systems for non-residential and residential applications is anticipated to provide lucrative business opportunities for the market players resulting in a high growth rate during the forecast period.

by end user industry

The report details a competitive analysis and profiles of the major players, such as Emerson Electric Co., Spirax Sarco Pty. Limited., Cebeco, Score Pacific PLC, Callidus Group, LESER, Powerflo Solutions, Mercer Valve Co., Inc., Western Process Controls, and Bourke Valves, in the Australian pressure safety valve market. Acquisition and partnerships are the key strategies adopted by the major players to retain their standing in the market.

Key Benefits

  • The report provides an extensive analysis of the current and emerging trends and dynamics in the global Australian pressure safety valve market.
  • An in-depth analysis is presented by constructing market estimations for the key market segments between 2017 and 2025.
  • An extensive analysis is arrived at by following key product positioning and monitoring the top competitors within the market framework.
  • A comprehensive analysis of all regions in Australia is provided to determine the prevailing opportunities in these geographies.
  • The key market players are profiled, and their strategies are analyzed thoroughly to understand the competitive outlook of the Australia pressure safety valve market.

Australian Pressure Safety Valve Market Key Segments:

By Offering

  • Safety Valve
  • Safety Valve Component

By Safety Valve Type

  • Spring Operated Valve
  • Pilot Operated Valve
  • Dead Weight Valve

By End-user Industry

  • Oil & Gas
  • Power & Energy
  • Healthcare & Pharmaceutical
  • Water Supply System
  • Others

Key Market Players

  • Bourke Valves
  • Callidus Group
  • Cebeco Pty. Ltd.
  • Emerson Electric Co.
  • LESER GmbH & Co. KG
  • Mercer Valve Company, Inc.
  • Powerflo Solutions
  • Score Group PLC
  • Spirax Sarco Pty. Limited
  • Western Process Controls

Australian Pressure Safety Valve Market Report Highlights

Aspects Details
By Offering
  • Safety valve
  • Safety valve component
By Safety Valve Type
  • Spring loaded
  • Pilot operated
  • Dead weight
By End-user Industry
  • Oil & gas
  • Power & energy
  • Healthcare & pharmaceuticals
  • Water supply systems
  • Others
By Region
  • North America  (U.S., Canada, Mexico)
  • Europe  (France, Germany, Italy, Spain, UK, Russia, Rest of Europe)
  • Asia-Pacific  (China, Japan, India, South Korea, Australia, Thailand, Malaysia, Indonesia, Rest of Asia-Pacific)
  • LAMEA  (Brazil, South Africa, Saudi Arabia, UAE, Argentina, Rest of LAMEA)
Key Market Players Score Group plc, Emerson Electric Co., Callidus Group, Mercer Valve Company, Inc., Western Process Controls, Spirax Sarco Pty. Limited., LESER GmbH & Co. KG, Powerflo Solutions, Bourke Valves, Cebeco Pty Ltd.
 

CHAPTER 1: Introduction

1.1. Report description
1.2. Key benefits for stakeholders
1.3. Key market segments
1.4. Research methodology

1.4.1. Secondary research
1.4.2. Primary research
1.4.3. Analyst tools & models

CHAPTER 2: Executive summary

2.1. CXO perspective

CHAPTER 3: Market overview

3.1. Market definition and scope
3.2. Key findings

3.2.1. Top impacting factors
3.2.2. Top investment pockets
3.2.3. Top winning strategies

3.3. Porter's five forces analysis
3.4. Key player positioning, 2017
3.5. Market dynamics

3.5.1. Drivers

3.5.1.1. Rise in energy consumption
3.5.1.2. Increase in spending toward offshore exploration

3.5.2. Restraints

3.5.2.1. Limited demand from the Australian market
3.5.2.2. Growth in industrial and manufacturing capabilities of Asian countries

3.5.3. Opportunity

3.5.3.1. Competitive pricing for specialized pressure safety valves

CHAPTER 4: Australian Pressure Safety Valve Market, By Offering

4.1. Market overview

4.1.1. Market size and forecast, by offering

4.2. Safety valve

4.2.1. Key market trends, growth factors, and opportunities
4.2.2. Market size and forecast

4.3. Safety valve component

4.3.1. Key market trends, growth factors, and opportunities
4.3.2. Market size and forecast

CHAPTER 5: Australian Pressure Safety Valve Market, By Safety Valve Type

5.1. Market overview

5.1.1. Market size and forecast, by safety valve type

5.2. Spring loaded

5.2.1. Key market trends, growth factors, and opportunities
5.2.2. Market size and forecast

5.3. Pilot operated

5.3.1. Key market trends, growth factors, and opportunities
5.3.2. Market size and forecast

5.4. Dead weight

5.4.1. Key market trends, growth factors, and opportunities
5.4.2. Market size and forecast

CHAPTER 6 : Australian Pressure Safety Valve Market, By End-user Industry

6.1. Market overview

6.1.1. Market size and forecast, by end-user industry

6.2. Oil & gas

6.2.1. Key market trends, growth factors, and opportunities
6.2.2. Market size and forecast

6.3. Power & energy

6.3.1. Key market trends, growth factors, and opportunities
6.3.2. Market size and forecast

6.4. Healthcare & pharmaceuticals

6.4.1. Key market trends, growth factors, and opportunities
6.4.2. Market size and forecast

6.5. Water supply systems

6.5.1. Key market trends, growth factors, and opportunities
6.5.2. Market size and forecast

6.6. Others

6.6.1. Key market trends, growth factors, and opportunities
6.6.2. Market size and forecast

CHAPTER 7: Company profiles

7.1. Bourke Valves

7.1.1. Company overview
7.1.2. Company snapshot
7.1.3. Product portfolio

7.2. Callidus Group

7.2.1. Company overview
7.2.2. Company snapshot
7.2.3. Operating business segments
7.2.4. Product portfolio

7.3. Cebeco Pty Ltd.

7.3.1. Company overview
7.3.2. Company snapshot
7.3.3. Product portfolio

7.4. Emerson Electric Co.

7.4.1. Company overview
7.4.2. Company snapshot
7.4.3. Operating business segments
7.4.4. Product portfolio
7.4.5. Business performance
7.4.6. Key strategic moves and developments

7.5. LESER GmbH & Co. KG

7.5.1. Company overview
7.5.2. Company snapshot
7.5.3. Product portfolio

7.6. Mercer Valve Company, Inc.

7.6.1. Company overview
7.6.2. Company snapshot
7.6.3. Product portfolio

7.7. Powerflo Solutions

7.7.1. Company overview
7.7.2. Company snapshot
7.7.3. Operating business segments
7.7.4. Product portfolio

7.8. Score Group plc

7.8.1. Company overview
7.8.2. Company snapshot
7.8.3. Operating business segments
7.8.4. Product portfolio
7.8.5. Key strategic moves and developments

7.9. Spirax Sarco Pty. Limited.

7.9.1. Company overview
7.9.2. Company snapshot
7.9.3. Operating business segments
7.9.4. Product portfolio
7.9.5. Business performance
7.9.6. Key strategic moves and developments

7.10. Western Process Controls

7.10.1. Company overview
7.10.2. Company snapshot
7.10.3. Operating business segments
7.10.4. Product portfolio

LIST OF TABLES

TABLE 01. AUSTRALIAN PRESSURE SAFETY VALVE MARKET REVENUE, BY OFFERINGS, 2017-2025 ($MILLION)
TABLE 02. AUSTRALIAN PRESSURE SAFETY VALVE MARKET REVENUE, BY SAFETY VALVE TYPE, 2017-2025 ($MILLION)
TABLE 03. AUSTRALIAN PRESSURE SAFETY VALVE MARKET REVENUE, BY END-USER INDUSTRY, 2017-2025 ($MILLION)
TABLE 04. BOURKE VALVES: COMPANY SNAPSHOT
TABLE 05. BOURKE VALVES: PRODUCT PORTFOLIO
TABLE 06. CALLIDUS GROUP: COMPANY SNAPSHOT
TABLE 07. CALLIDUS GROUP: OPERATING DIVISION
TABLE 08. CALLIDUS GROUP: PRODUCT PORTFOLIO
TABLE 09. CEBECO PTY LTD: COMPANY SNAPSHOT
TABLE 10. CEBECO PTY LTD: PRODUCT PORTFOLIO
TABLE 11. EMERSON ELECTRIC CO.: COMPANY SNAPSHOT
TABLE 12. EMERSON ELECTRIC CO.: OPERATING SEGMENTS
TABLE 13. EMERSON ELECTRIC CO.: PRODUCT PORTFOLIO
TABLE 14. LESER GMBH & CO. KG: COMPANY SNAPSHOT
TABLE 15. LESER GMBH & CO. KG: PRODUCT PORTFOLIO
TABLE 16. MERCER VALVE COMPANY, INC.: COMPANY SNAPSHOT
TABLE 17. MERCER VALVE COMPANY, INC.: PRODUCT PORTFOLIO
TABLE 18. POWERFLO SOLUTIONS: COMPANY SNAPSHOT
TABLE 19. POWERFLO SOLUTIONS: PRODUCT CATEGORIES
TABLE 20. POWERFLO SOLUTIONS: PRODUCT PORTFOLIO
TABLE 21. SCORE GROUP PLC: COMPANY SNAPSHOT
TABLE 22. SCORE GROUP PLC: OPERATING SEGMENTS
TABLE 23. SCORE GROUP PLC: PRODUCT PORTFOLIO
TABLE 24. SPIRAX SARCO PTY. LIMITED.: COMPANY SNAPSHOT
TABLE 25. SPIRAX SARCO PTY. LIMITED.: PRODUCT CATEGORIES
TABLE 26. SPIRAX SARCO PTY. LIMITED.: PRODUCT PORTFOLIO
TABLE 27. WESTERN PROCESS CONTROLS: COMPANY SNAPSHOT
TABLE 28. WESTERN PROCESS CONTROLS: PRODUCT CATEGORIES
TABLE 29. WESTERN PROCESS CONTROLS: PRODUCT PORTFOLIO

LIST OF FIGURES

FIGURE 01. AUSTRALIAN PRESSURE SAFETY VALVE MARKET, 20172025
FIGURE 02. AUSTRALIAN PRESSURE SAFETY VALVE MARKET: KEY PLAYERS
FIGURE 03. TOP IMPACTING FACTORS
FIGURE 04. TOP INVESTMENT POCKETS
FIGURE 05. TOP WINNING STRATEGIES, BY YEAR, 2013-2017
FIGURE 06. TOP WINNING STRATEGIES, BY DEVELOPMENT, 2013-2017 (%)
FIGURE 07. TOP WINNING STRATEGIES, BY COMPANY, 2013-2017
FIGURE 08. LOW BARGAINING POWER OF SUPPLIERS
FIGURE 09. MODERATE BARGAINING POWER OF BUYERS
FIGURE 10. LOW THREAT OF SUBSTITUTES
FIGURE 11. MODERATE THREAT OF NEW ENTRANTS
FIGURE 12. MODERATE COMPETITIVE RIVALRY
FIGURE 13. KEY PLAYER POSITIONING
FIGURE 14. AUSTRALIAN PRESSURE SAFETY VALVE MARKET: DRIVERS, RESTRAINTS, AND OPPORTUNITIES
FIGURE 15. AUSTRALIAN PRESSURE SAFETY VALVE MARKET REVENUE, 2017-2025 ($MILLION)
FIGURE 16. AUSTRALIAN PRESSURE SAFETY VALVE COMPONENT MARKET REVENUE, 2017-2025 ($MILLION)
FIGURE 17. SPRING LOADED AUSTRALIAN PRESSURE SAFETY VALVE MARKET REVENUE, 2017-2025 ($MILLION)
FIGURE 18. PILOT OPERATED AUSTRALIAN PRESSURE SAFETY VALVE MARKET REVENUE, 2017-2025 ($MILLION)
FIGURE 19. DEAD WEIGHT AUSTRALIAN PRESSURE SAFETY VALVE MARKET REVENUE, 2017-2025 ($MILLION)
FIGURE 20. OIL & GAS AUSTRALIAN PRESSURE SAFETY VALVE MARKET REVENUE, 2017-2025 ($MILLION)
FIGURE 21. POWER & ENERGY AUSTRALIAN PRESSURE SAFETY VALVE MARKET REVENUE, 2017-2025 ($MILLION)
FIGURE 22. HEALTHCARE & PHARMACEUTICALS AUSTRALIAN PRESSURE SAFETY VALVE MARKET REVENUE, 2017-2025 ($MILLION)
FIGURE 23. WATER SUPPLY SYSTEMS AUSTRALIAN PRESSURE SAFETY VALVE MARKET REVENUE, 2017-2025 ($MILLION)
FIGURE 24. OTHERS AUSTRALIAN PRESSURE SAFETY VALVE MARKET REVENUE, 2017-2025 ($MILLION)
FIGURE 25. EMERSON ELECTRIC CO.: REVENUE, 2015-2017 ($MILLION)
FIGURE 26. EMERSON ELECTRIC CO.: REVENUE SHARE BY SEGMENT, 2017 (%)
FIGURE 27. EMERSON ELECTRIC CO.: REVENUE SHARE BY GEOGRAPHY, 2017 (%)
FIGURE 28. SPIRAX-SARCO ENGINEERING PLC: REVENUE, 2015-2017 ($MILLION)
FIGURE 29. SPIRAX-SARCO ENGINEERING PLC: REVENUE SHARE BY DIVISION, 2017 (%)
FIGURE 30. SPIRAX-SARCO ENGINEERING PLC: REVENUE SHARE BY GEOGRAPHY, 2017 (%)


The Australian pressure safety valve market constitutes devices that ensure the safety of industrial machinery and equipment by regulating the additional surge in pressure through an alternate outlet. Growing industrial spending and a rising demand to ensure optimal plant performance are the major driving factors for the growing adoption of safety valves in the Australian market. Moreover, availability of abundant natural resources and limited demand from Australian end-users continue to provide lucrative export opportunities to the regional end-user industries. However, the rising technological capabilities of fast-emerging economies in Asia are expected to hinder the industrial spending toward certain end-user industries, such as chemicals, textile, construction, plastics, and others.

The safety valves have significant applications in steam boilers, heating boilers, industrial equipment, pressure vessels, and others across different industry verticals. Thus, based on end-user industry, the market is broadly classified into oil & gas, power & energy, healthcare & pharmaceutical, water supply system, and others. The presence of a wide network of the oil & gas industry in mid-stream, down-stream, and up-stream applications in the Australian region has resulted in almost one-fourth market share of the oil & gas sector. In addition, it is projected to witness moderate CAGR growth rate e owing to steady demand for maintenance and service of existing safety valves throughout the forecast period. However, the water supply system segment is anticipated to witness the most lucrative growth rate in the coming years, owing to a surge in waste water and industrial water treatment. 

PURCHASE OPTIONS

Call or Email us

U.S.-Canada Toll-free: +1-800-792-5285
Int'l : +1-503-894-6022
Europe : +44-845-528-1300
Email : help@alliedmarketresearch.com

Looking for Customization?

 Customization Request

Have a Question?

 Speak with Analyst

Any Confusion?

 Inquire Before Buying

Have a glance of the Report

  Request Sample

Purchase Full Report of
Australian Pressure Safety Valve Market

Start reading instantly.
This Report and over 66,905+ more Reports, Available with Avenue Library. T&C*.

  • Data Pack
  • $2,220
  • Restricted to one authorized user
  • One print only
  • Available in
    Excel
  • Free industry update
    (Within 180 days)
  •   Free report update in next update cycle
    (Jun 2019 - Jun 2020)
  • Single User
  • $3,105
  • Restricted to one authorized user
  • One print only
  • Available in
    PDF
  • Free industry update
    (Within 180 days)
  •   Free report update in next update cycle
    (Jun 2019 - Jun 2020)
  • Five Users
  • $3,729
  • Limited to five authorized users
  • Print upto five copies
  • Available in
    PDF
  • Free industry update
    (Within 180 days)
  •   Free report update in next update cycle
    (Jun 2019 - Jun 2020)
  • Enterprise
    License/PDF

  • $6,201
  • Unlimited
    within
    company/enterprise
  • Available in Excel & PDF
  • Free industry update
    (Within 180 days)
  •   Free report update in next update cycle
    (Jun 2019 - Jun 2020)
  • Library
    Membership

  • $999 $ 1,175
    Per User/ Per month/ Billed annually
  • Published Content
    E-access
  • Company Profiles
    E-access
  • Newly Added Content Access
  • 10 PDF
    Downloads
  • 5 Excel Data
    Pack Downloads
  • 250 Company Profiles PDF Downloads
  • Buy Now

*Taxes/Fees, if applicable will be added during checkout. All prices in USD

RELATED REPORTS
 

Why Allied Market Research?


Infallible Methodology

To ensure high-level data integrity, accurate analysis, and impeccable forecasts

Analyst Support

For complete satisfaction

Customization

On-demand customization of scope of the report to exactly meet your needs

TARGETED MARKET VIEW

Targeted market view to provide pertinent information and save time of readers

Get fresh content delivered

Get insights on topics that are crucial for your business. Stay abreast of your interest areas.

Get Industry Data Alerts

Why Allied Market Research?

Infallible Methodology

To ensure high-level data integrity, accurate analysis, and impeccable forecasts

Analyst Support

For complete satisfaction

Customization

On-demand customization of scope of the report to exactly meet your needs

TARGETED MARKET VIEW

Targeted market view to provide pertinent information and save time of readers