0
2022
Automated Liquid Handling Market

Automated Liquid Handling Market

by Type (Standalone, Individual Benchtop Workstation, Multi Instrument System, Others), by Modality (Disposable Tips, Fixed Tips), by Procedure (Serial Dilution, Plate Reformatting, Plate Replication, Pcr Setup, High-Throughput Screening, Cell Culture, Whole Genome Amplification, Array Printing, Others), by End User (Biotechnology And Pharmaceutical Companies, Contract Research Organizations, Academic And Government Research Institutes), : Global Opportunity Analysis and Industry Forecast, 2020-2030

Report Code: A02016
Mar 2022 | Pages: 307
Tables: 172
Charts: 65
  • Formats*:

  • pdf

    Single User License, Five User
    License & Enterprise User License

  • xls

    Data Pack Excel License

  • ppt

    It comes with the additional cost
    of $2500.00 contact sales.


Automated Liquid Handling Market Research, 2030

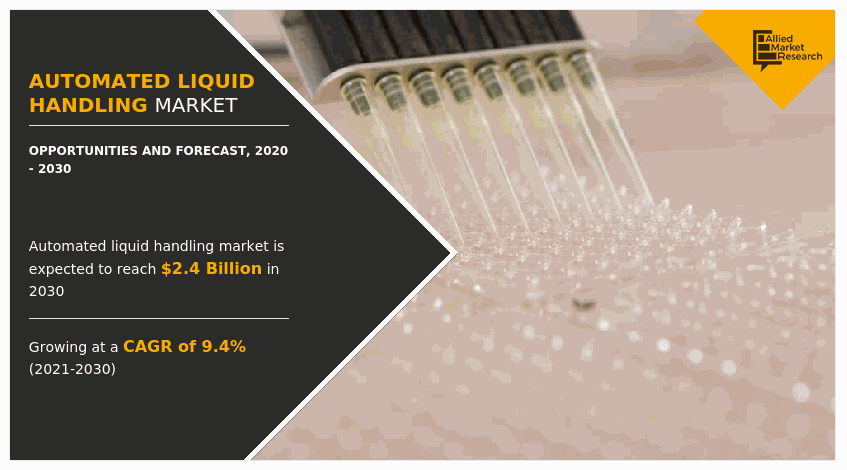
The global automated liquid handling market was valued at $960.98 million in 2020, and is projected to reach $2,385.91 million by 2030, growing at a CAGR of 9.4% from 2021 to 2030. Automated liquid handling (ALH) systems are equipment that are precisely programmed to handle liquids and deliver accurate and reproducible results without any complexity in clinical and research settings. Efficient and accurate liquid handling techniques play important role in clinical and research laboratories. Automated liquid handling systems can be optimized for use in techniques, including ELISA, time-resolved fluorescence, nucleic acid preparation, PCR setup, next-generation sequencing for genomic research, TLC spotting, SPE, and liquid– liquid extraction. Automated liquid handling instruments have various advantages like it enables simplified sample preparation with consistent high accuracy and allows labs to free up manual labor and run more samples while maintaining reproducibility. It helps to address sample preparation needs for proteins, metabolites, as well as genomics and NGS applications, reducing set up times and protocol development.
COVID-19 pandemic increased the industry growth significantly as demand for automated liquid handling increased with rise in need to process specimens faster in the laboratory for research of COVID-19 virus with the investigation of the genetic makeup of the virus, and study of genetic mutations of the COVID-19 virus. Thus, the outbreak of COVID-19 has negatively impacted the automated liquid handling market.


The automated liquid handling market growth is driven by rise in adoption of ALH, rise in adoption of ALH in emerging countries, technological advancements in ALH systems, and surge in demand for miniature process equipment. Moreover, the advantages of ALH systems over manual pipetting such as improved efficiency, enhanced safety also contributes in the growth of the market. However, rise in higher costs of ALH instruments is expected to hinder the market growth. Conversely, untapped potential of emerging markets offers automated liquid handling market opportunity.

Coronavirus (COVID-19) was discovered in late December, 2019, in Hubei province of Wuhan city in China. The disease is caused by a virus, namely, severe acute respiratory syndrome coronavirus 2 (SARS-CoV-2), which is transmitted among humans. Testing for COVID-19 has been an ongoing bottleneck in the fight against COVID-19. With growth in need to process specimens faster with greater accuracy, interest in automated liquid handlers and robotics that can handle the workload has been increasing rapidly. Overall, the impact of COVID-19 on the automated liquid handling industry was recorded to be fairly positive. This was attributed to increase in customizations of automated liquid handling systems by different automated liquid handling suppliers specifically for work related to coronavirus. For instance, in April 2020, Hamilton Company and Zymo Research Corporation announced that they have collaborated and launched MagEx STARlet assay-ready workstation with Quick-DNA/RNA Viral MagBead Kit protocol to extract pure DNA/RNA from the novel coronavirus, SARS-CoV-2. The jointly developed automated solution offers significant advantages compared to manual processing of samples via traditional time-consuming methods such as spin columns.

The automated liquid handling market is segmented on the basis of type, modality, procedure, end user, and region. On the basis of type, the market is divided into standalone, individual benchtop workstation, multi-instrument system, and others. By modality, it is bifurcated into fixed tips and disposable tips. By procedure, it is segmented into PCR-set-up, serial dilution, high-throughput screening, cell culture, whole genome amplification, plate reformatting, array printing, and others. On the basis of end user, it is classified into biotechnology & pharmaceutical companies, contract research organizations, and academic & government research institutes. Region wise, the market has been analyzed across North America, Europe, Asia-Pacific, and LAMEA.

Type segment review

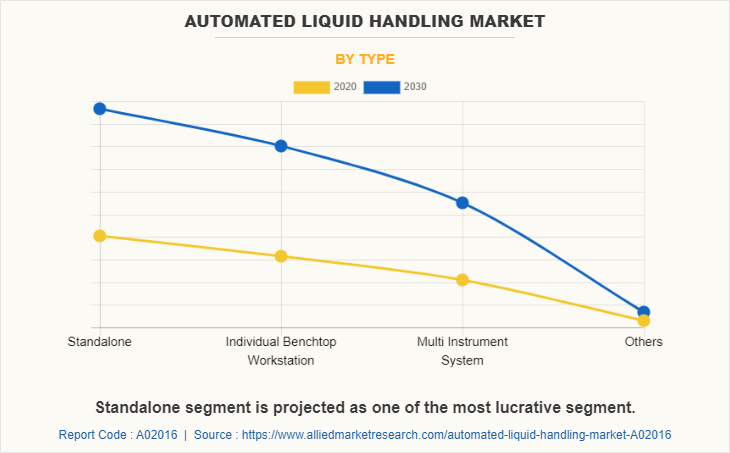
By type, the global automated liquid handling market is classified into standalone, individual benchtop workstation, multi-instrument system, and others. Standalone segment was the major contributor to the automated liquid handling market size in 2020, and is anticipated to remain dominant during the automated liquid handling market forecast period due to lower cost and higher usage among different research and clinical settings. However, the multi-instrument ALH system segment is expected to show fastest market growth during the forecast period, owing to rise in adoption of technologically advanced multi-instrument ALH. 
Automated Liquid Handling Market

Modality segment review

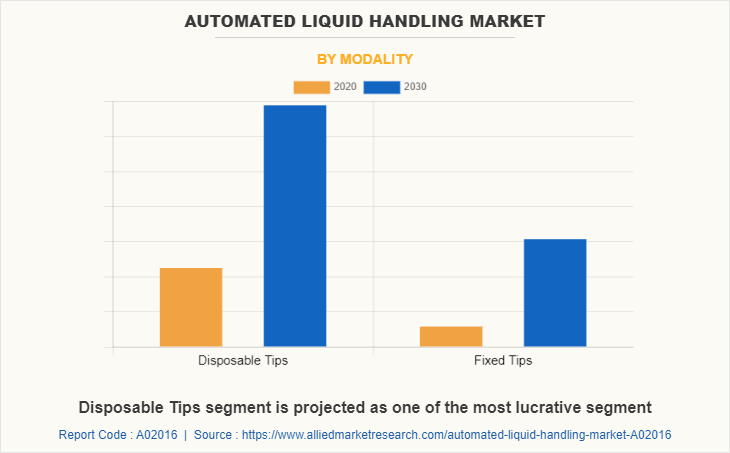
By modality, the global automated liquid handling market is classified into fixed tips and disposable tips. Disposable tips segment was the major contributor to the global automated liquid handling market size in 2020, and is anticipated to remain dominant during the forecast period due to rise in adoption of technologically advanced ALH instruments with disposable tips.
Automated Liquid Handling Market

Procedure segment review

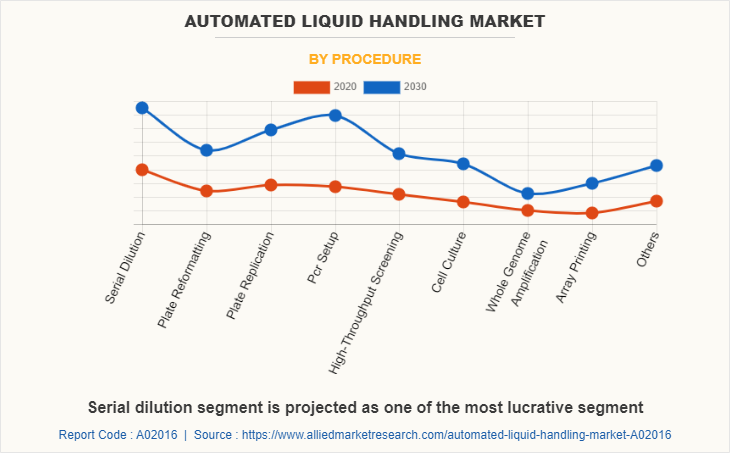
By procedure, the global automated liquid handling market is classified into PCR-set-up, serial dilution, high-throughput screening, cell culture, whole genome amplification, plate reformatting, array printing, and other. Serial dilution segment was the major automated liquid handling market share in 2020, and is anticipated to remain dominant during the forecast period due to increase in adoption of ALH within laboratories for serial dilution. However, array printing is expected to show significant market growth during the forecast period.
Automated Liquid Handling Market

End user segment review

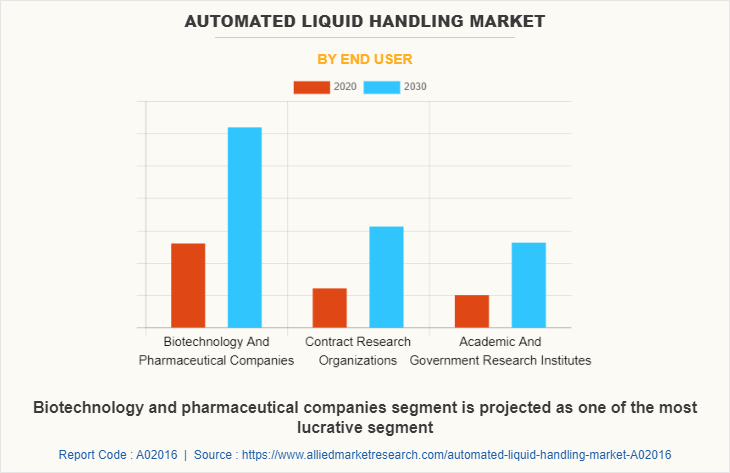
By end user, the global automated liquid handling market is classified into biotechnology & pharmaceutical companies, contract research organizations, and academic & government research institutes. Biotechnology & pharmaceutical companies segment was the major contributor to the global market in 2020, and is anticipated to remain dominant during the forecast period due to increase in the use and application of ALH systems to carry out high throughput screening in the biotechnology and pharmaceutical industry.
Automated Liquid Handling Market


Region Segment Review

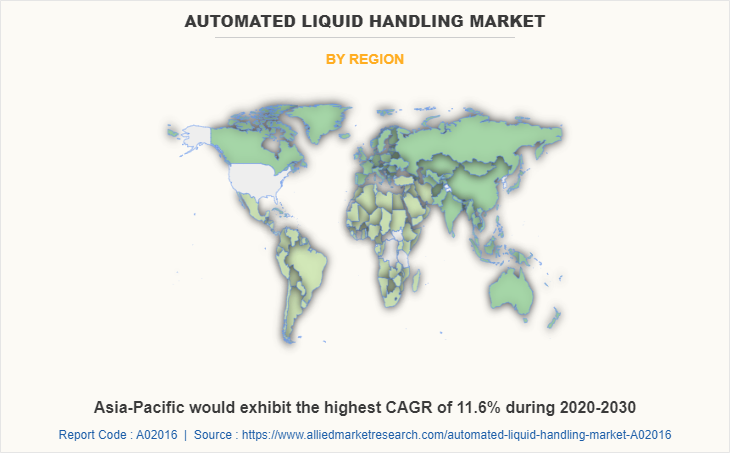
North America  generated highest revenue in 2020, and is anticipated to dominate the global ALH market. This was attributed to rise in adoption of ALH system, wide availability of advanced ALH, large presence of pharmaceutical and biotech companies and R&D laboratories, and large presence of trained professionals. However, Asia-Pacific is expected to witness highest growth rate of automated liquid handling market share during the forecast period, attributable to rise in awareness related to ALH systems, developing R&D sector, and developing infrastructure of research and clinical settings.
Automated Liquid Handling Market


Key Benefits For Stakeholders

  • This report provides a quantitative analysis of the market segments, current trends, estimations, and dynamics of the automated liquid handling market analysis from 2020 to 2030 to identify the prevailing automated liquid handling market opportunities.
  • The market research is offered along with information related to key drivers, restraints, and opportunities.
  • Porter's five forces analysis highlights the potency of buyers and suppliers to enable stakeholders make profit-oriented business decisions and strengthen their supplier-buyer network.
  • In-depth analysis of the automated liquid handling market segmentation assists to determine the prevailing market opportunities.
  • Major countries in each region are mapped according to their revenue contribution to the global market.
  • Market player positioning facilitates benchmarking and provides a clear understanding of the present position of the market players.
  • The report includes the analysis of the regional as well as global automated liquid handling market trends, key players, market segments, application areas, and market growth strategies.

Automated Liquid Handling Market Report Highlights

Aspects Details
By Type
  • Standalone
  • Individual Benchtop Workstation
  • Multi Instrument System
  • Others
By Modality
  • Disposable Tips
  • Fixed Tips
By Procedure
  • Serial Dilution
  • Plate Reformatting
  • Plate Replication
  • Pcr Setup
  • High-Throughput Screening
  • Cell Culture
  • Whole Genome Amplification
  • Array Printing
  • Others
By End User
  • Biotechnology And Pharmaceutical Companies
  • Contract Research Organizations
  • Academic And Government Research Institutes
By Region
  • North America  (U.S., Canada)
  • Europe  (Germany, France, United Kingdom, Italy, Spain, Rest of Europe)
  • Asia-Pacific  (Japan, China, Australia, India, Rest of Asia-Pacific)
  • LAMEA  (Latin America, Middle East And Africa)
Key Market Players PERKINELMER, INC., GILSON, INC., DANAHER CORPORATION (BECKMAN COULTER INC.), AURORA BIOMED INC, AGILENT TECHNOLOGIES, INC. (BIOTEK INSTRUMENTS, INC.), CORNING INCORPORATED, TECAN GROUP LTD., EPPENDORF AG, METTLER-TOLEDO INTERNATIONAL INC., HAMILTON COMPANY
 
  • CHAPTER 1:INTRODUCTION

    • 1.1.Report description

    • 1.2.Key market segments

    • 1.3.Key benefits to the stakeholders

    • 1.4.Research Methodology

      • 1.4.1.Secondary research

      • 1.4.2.Primary research

      • 1.4.3.Analyst tools and models

  • CHAPTER 2:EXECUTIVE SUMMARY

    • 2.1.Key findings of the study

    • 2.2.CXO Perspective

  • CHAPTER 3:MARKET OVERVIEW

    • 3.1.Market definition and scope

    • 3.2.Key findings

      • 3.2.1.Top investment pockets

    • 3.3.Porter’s five forces analysis

    • 3.4.Top player positioning

    • 3.5.Market dynamics

      • 3.5.1.Drivers

      • 3.5.2.Restraints

      • 3.5.3.Opportunities

    • 3.6.COVID-19 Impact Analysis on the market

  • CHAPTER 4: AUTOMATED LIQUID HANDLING MARKET, BY TYPE

    • 4.1 Overview

      • 4.1.1 Market size and forecast

    • 4.2 Standalone

      • 4.2.1 Key market trends, growth factors and opportunities

      • 4.2.2 Market size and forecast, by region

      • 4.2.3 Market analysis by country

    • 4.3 Individual Benchtop Workstation

      • 4.3.1 Key market trends, growth factors and opportunities

      • 4.3.2 Market size and forecast, by region

      • 4.3.3 Market analysis by country

    • 4.4 Multi Instrument System

      • 4.4.1 Key market trends, growth factors and opportunities

      • 4.4.2 Market size and forecast, by region

      • 4.4.3 Market analysis by country

    • 4.5 Others

      • 4.5.1 Key market trends, growth factors and opportunities

      • 4.5.2 Market size and forecast, by region

      • 4.5.3 Market analysis by country

  • CHAPTER 5: AUTOMATED LIQUID HANDLING MARKET, BY MODALITY

    • 5.1 Overview

      • 5.1.1 Market size and forecast

    • 5.2 Disposable Tips

      • 5.2.1 Key market trends, growth factors and opportunities

      • 5.2.2 Market size and forecast, by region

      • 5.2.3 Market analysis by country

    • 5.3 Fixed Tips

      • 5.3.1 Key market trends, growth factors and opportunities

      • 5.3.2 Market size and forecast, by region

      • 5.3.3 Market analysis by country

  • CHAPTER 6: AUTOMATED LIQUID HANDLING MARKET, BY PROCEDURE

    • 6.1 Overview

      • 6.1.1 Market size and forecast

    • 6.2 Serial Dilution

      • 6.2.1 Key market trends, growth factors and opportunities

      • 6.2.2 Market size and forecast, by region

      • 6.2.3 Market analysis by country

    • 6.3 Plate Reformatting

      • 6.3.1 Key market trends, growth factors and opportunities

      • 6.3.2 Market size and forecast, by region

      • 6.3.3 Market analysis by country

    • 6.4 Plate Replication

      • 6.4.1 Key market trends, growth factors and opportunities

      • 6.4.2 Market size and forecast, by region

      • 6.4.3 Market analysis by country

    • 6.5 Pcr Setup

      • 6.5.1 Key market trends, growth factors and opportunities

      • 6.5.2 Market size and forecast, by region

      • 6.5.3 Market analysis by country

    • 6.6 High-Throughput Screening

      • 6.6.1 Key market trends, growth factors and opportunities

      • 6.6.2 Market size and forecast, by region

      • 6.6.3 Market analysis by country

    • 6.7 Cell Culture

      • 6.7.1 Key market trends, growth factors and opportunities

      • 6.7.2 Market size and forecast, by region

      • 6.7.3 Market analysis by country

    • 6.8 Whole Genome Amplification

      • 6.8.1 Key market trends, growth factors and opportunities

      • 6.8.2 Market size and forecast, by region

      • 6.8.3 Market analysis by country

    • 6.9 Array Printing

      • 6.9.1 Key market trends, growth factors and opportunities

      • 6.9.2 Market size and forecast, by region

      • 6.9.3 Market analysis by country

    • 7.0 Others

      • 7.0.1 Key market trends, growth factors and opportunities

      • 7.0.2 Market size and forecast, by region

      • 7.0.3 Market analysis by country

  • CHAPTER 7: AUTOMATED LIQUID HANDLING MARKET, BY END USER

    • 7.1 Overview

      • 7.1.1 Market size and forecast

    • 7.2 Biotechnology And Pharmaceutical Companies

      • 7.2.1 Key market trends, growth factors and opportunities

      • 7.2.2 Market size and forecast, by region

      • 7.2.3 Market analysis by country

    • 7.3 Contract Research Organizations

      • 7.3.1 Key market trends, growth factors and opportunities

      • 7.3.2 Market size and forecast, by region

      • 7.3.3 Market analysis by country

    • 7.4 Academic And Government Research Institutes

      • 7.4.1 Key market trends, growth factors and opportunities

      • 7.4.2 Market size and forecast, by region

      • 7.4.3 Market analysis by country

  • CHAPTER 8: AUTOMATED LIQUID HANDLING MARKET, BY REGION

    • 8.1 Overview

      • 8.1.1 Market size and forecast

    • 8.2 North America

      • 8.2.1 Key trends and opportunities

      • 8.2.2 North America Market size and forecast, by Type

      • 8.2.3 North America Market size and forecast, by Modality

      • 8.2.4 North America Market size and forecast, by Procedure

      • 8.2.5 North America Market size and forecast, by End User

      • 8.2.6 North America Market size and forecast, by country

        • 8.2.6.1 U.S.
          • 8.2.6.1.1 Market size and forecast, by Type
          • 8.2.6.1.2 Market size and forecast, by Modality
          • 8.2.6.1.3 Market size and forecast, by Procedure
          • 8.2.6.1.4 Market size and forecast, by End User
        • 8.2.6.2 Canada
          • 8.2.6.2.1 Market size and forecast, by Type
          • 8.2.6.2.2 Market size and forecast, by Modality
          • 8.2.6.2.3 Market size and forecast, by Procedure
          • 8.2.6.2.4 Market size and forecast, by End User
    • 8.3 Europe

      • 8.3.1 Key trends and opportunities

      • 8.3.2 Europe Market size and forecast, by Type

      • 8.3.3 Europe Market size and forecast, by Modality

      • 8.3.4 Europe Market size and forecast, by Procedure

      • 8.3.5 Europe Market size and forecast, by End User

      • 8.3.6 Europe Market size and forecast, by country

        • 8.3.6.1 Germany
          • 8.3.6.1.1 Market size and forecast, by Type
          • 8.3.6.1.2 Market size and forecast, by Modality
          • 8.3.6.1.3 Market size and forecast, by Procedure
          • 8.3.6.1.4 Market size and forecast, by End User
        • 8.3.6.2 France
          • 8.3.6.2.1 Market size and forecast, by Type
          • 8.3.6.2.2 Market size and forecast, by Modality
          • 8.3.6.2.3 Market size and forecast, by Procedure
          • 8.3.6.2.4 Market size and forecast, by End User
        • 8.3.6.3 United Kingdom
          • 8.3.6.3.1 Market size and forecast, by Type
          • 8.3.6.3.2 Market size and forecast, by Modality
          • 8.3.6.3.3 Market size and forecast, by Procedure
          • 8.3.6.3.4 Market size and forecast, by End User
        • 8.3.6.4 Italy
          • 8.3.6.4.1 Market size and forecast, by Type
          • 8.3.6.4.2 Market size and forecast, by Modality
          • 8.3.6.4.3 Market size and forecast, by Procedure
          • 8.3.6.4.4 Market size and forecast, by End User
        • 8.3.6.5 Spain
          • 8.3.6.5.1 Market size and forecast, by Type
          • 8.3.6.5.2 Market size and forecast, by Modality
          • 8.3.6.5.3 Market size and forecast, by Procedure
          • 8.3.6.5.4 Market size and forecast, by End User
        • 8.3.6.6 Rest of Europe
          • 8.3.6.6.1 Market size and forecast, by Type
          • 8.3.6.6.2 Market size and forecast, by Modality
          • 8.3.6.6.3 Market size and forecast, by Procedure
          • 8.3.6.6.4 Market size and forecast, by End User
    • 8.4 Asia-Pacific

      • 8.4.1 Key trends and opportunities

      • 8.4.2 Asia-Pacific Market size and forecast, by Type

      • 8.4.3 Asia-Pacific Market size and forecast, by Modality

      • 8.4.4 Asia-Pacific Market size and forecast, by Procedure

      • 8.4.5 Asia-Pacific Market size and forecast, by End User

      • 8.4.6 Asia-Pacific Market size and forecast, by country

        • 8.4.6.1 Japan
          • 8.4.6.1.1 Market size and forecast, by Type
          • 8.4.6.1.2 Market size and forecast, by Modality
          • 8.4.6.1.3 Market size and forecast, by Procedure
          • 8.4.6.1.4 Market size and forecast, by End User
        • 8.4.6.2 China
          • 8.4.6.2.1 Market size and forecast, by Type
          • 8.4.6.2.2 Market size and forecast, by Modality
          • 8.4.6.2.3 Market size and forecast, by Procedure
          • 8.4.6.2.4 Market size and forecast, by End User
        • 8.4.6.3 Australia
          • 8.4.6.3.1 Market size and forecast, by Type
          • 8.4.6.3.2 Market size and forecast, by Modality
          • 8.4.6.3.3 Market size and forecast, by Procedure
          • 8.4.6.3.4 Market size and forecast, by End User
        • 8.4.6.4 India
          • 8.4.6.4.1 Market size and forecast, by Type
          • 8.4.6.4.2 Market size and forecast, by Modality
          • 8.4.6.4.3 Market size and forecast, by Procedure
          • 8.4.6.4.4 Market size and forecast, by End User
        • 8.4.6.5 Rest of Asia-Pacific
          • 8.4.6.5.1 Market size and forecast, by Type
          • 8.4.6.5.2 Market size and forecast, by Modality
          • 8.4.6.5.3 Market size and forecast, by Procedure
          • 8.4.6.5.4 Market size and forecast, by End User
    • 8.5 LAMEA

      • 8.5.1 Key trends and opportunities

      • 8.5.2 LAMEA Market size and forecast, by Type

      • 8.5.3 LAMEA Market size and forecast, by Modality

      • 8.5.4 LAMEA Market size and forecast, by Procedure

      • 8.5.5 LAMEA Market size and forecast, by End User

      • 8.5.6 LAMEA Market size and forecast, by country

        • 8.5.6.1 Latin America
          • 8.5.6.1.1 Market size and forecast, by Type
          • 8.5.6.1.2 Market size and forecast, by Modality
          • 8.5.6.1.3 Market size and forecast, by Procedure
          • 8.5.6.1.4 Market size and forecast, by End User
        • 8.5.6.2 Middle East And Africa
          • 8.5.6.2.1 Market size and forecast, by Type
          • 8.5.6.2.2 Market size and forecast, by Modality
          • 8.5.6.2.3 Market size and forecast, by Procedure
          • 8.5.6.2.4 Market size and forecast, by End User
  • CHAPTER 9: COMPANY LANDSCAPE

    • 9.1. Introduction

    • 9.2. Top winning strategies

    • 9.3. Product Mapping of Top 10 Player

    • 9.4. Competitive Dashboard

    • 9.5. Competitive Heatmap

    • 9.6. Key developments

  • CHAPTER 10: COMPANY PROFILES

    • 10.1 AGILENT TECHNOLOGIES, INC. (BIOTEK INSTRUMENTS, INC.)

      • 10.1.1 Company overview

      • 10.1.2 Company snapshot

      • 10.1.3 Operating business segments

      • 10.1.4 Product portfolio

      • 10.1.5 Business performance

      • 10.1.6 Key strategic moves and developments

    • 10.2 AURORA BIOMED INC

      • 10.2.1 Company overview

      • 10.2.2 Company snapshot

      • 10.2.3 Operating business segments

      • 10.2.4 Product portfolio

      • 10.2.5 Business performance

      • 10.2.6 Key strategic moves and developments

    • 10.3 CORNING INCORPORATED

      • 10.3.1 Company overview

      • 10.3.2 Company snapshot

      • 10.3.3 Operating business segments

      • 10.3.4 Product portfolio

      • 10.3.5 Business performance

      • 10.3.6 Key strategic moves and developments

    • 10.4 DANAHER CORPORATION (BECKMAN COULTER INC.)

      • 10.4.1 Company overview

      • 10.4.2 Company snapshot

      • 10.4.3 Operating business segments

      • 10.4.4 Product portfolio

      • 10.4.5 Business performance

      • 10.4.6 Key strategic moves and developments

    • 10.5 EPPENDORF AG

      • 10.5.1 Company overview

      • 10.5.2 Company snapshot

      • 10.5.3 Operating business segments

      • 10.5.4 Product portfolio

      • 10.5.5 Business performance

      • 10.5.6 Key strategic moves and developments

    • 10.6 GILSON, INC.

      • 10.6.1 Company overview

      • 10.6.2 Company snapshot

      • 10.6.3 Operating business segments

      • 10.6.4 Product portfolio

      • 10.6.5 Business performance

      • 10.6.6 Key strategic moves and developments

    • 10.7 HAMILTON COMPANY

      • 10.7.1 Company overview

      • 10.7.2 Company snapshot

      • 10.7.3 Operating business segments

      • 10.7.4 Product portfolio

      • 10.7.5 Business performance

      • 10.7.6 Key strategic moves and developments

    • 10.8 METTLER-TOLEDO INTERNATIONAL INC.

      • 10.8.1 Company overview

      • 10.8.2 Company snapshot

      • 10.8.3 Operating business segments

      • 10.8.4 Product portfolio

      • 10.8.5 Business performance

      • 10.8.6 Key strategic moves and developments

    • 10.9 PERKINELMER, INC.

      • 10.9.1 Company overview

      • 10.9.2 Company snapshot

      • 10.9.3 Operating business segments

      • 10.9.4 Product portfolio

      • 10.9.5 Business performance

      • 10.9.6 Key strategic moves and developments

    • 10.10 TECAN GROUP LTD.

      • 10.10.1 Company overview

      • 10.10.2 Company snapshot

      • 10.10.3 Operating business segments

      • 10.10.4 Product portfolio

      • 10.10.5 Business performance

      • 10.10.6 Key strategic moves and developments

  • LIST OF TABLES

  • TABLE 1. GLOBAL AUTOMATED LIQUID HANDLING MARKET, BY TYPE, 2020-2030,($MILLION)
    TABLE 2. AUTOMATED LIQUID HANDLING MARKET REVENUE, FOR STANDALONE, BY REGION , 2020-2030,($MILLION)
    TABLE 3. AUTOMATED LIQUID HANDLING MARKET STANDALONE BY COUNTRY, 2020-2030,($MILLION)
    TABLE 4. AUTOMATED LIQUID HANDLING MARKET REVENUE, FOR INDIVIDUAL BENCHTOP WORKSTATION, BY REGION , 2020-2030,($MILLION)
    TABLE 5. AUTOMATED LIQUID HANDLING MARKET INDIVIDUAL BENCHTOP WORKSTATION BY COUNTRY, 2020-2030,($MILLION)
    TABLE 6. AUTOMATED LIQUID HANDLING MARKET REVENUE, FOR MULTI INSTRUMENT SYSTEM, BY REGION , 2020-2030,($MILLION)
    TABLE 7. AUTOMATED LIQUID HANDLING MARKET MULTI INSTRUMENT SYSTEM BY COUNTRY, 2020-2030,($MILLION)
    TABLE 8. AUTOMATED LIQUID HANDLING MARKET REVENUE, FOR OTHERS, BY REGION , 2020-2030,($MILLION)
    TABLE 9. AUTOMATED LIQUID HANDLING MARKET OTHERS BY COUNTRY, 2020-2030,($MILLION)
    TABLE 10. GLOBAL AUTOMATED LIQUID HANDLING MARKET, BY MODALITY, 2020-2030,($MILLION)
    TABLE 11. AUTOMATED LIQUID HANDLING MARKET REVENUE, FOR DISPOSABLE TIPS, BY REGION , 2020-2030,($MILLION)
    TABLE 12. AUTOMATED LIQUID HANDLING MARKET DISPOSABLE TIPS BY COUNTRY, 2020-2030,($MILLION)
    TABLE 13. AUTOMATED LIQUID HANDLING MARKET REVENUE, FOR FIXED TIPS, BY REGION , 2020-2030,($MILLION)
    TABLE 14. AUTOMATED LIQUID HANDLING MARKET FIXED TIPS BY COUNTRY, 2020-2030,($MILLION)
    TABLE 15. GLOBAL AUTOMATED LIQUID HANDLING MARKET, BY PROCEDURE, 2020-2030,($MILLION)
    TABLE 16. AUTOMATED LIQUID HANDLING MARKET REVENUE, FOR SERIAL DILUTION, BY REGION , 2020-2030,($MILLION)
    TABLE 17. AUTOMATED LIQUID HANDLING MARKET SERIAL DILUTION BY COUNTRY, 2020-2030,($MILLION)
    TABLE 18. AUTOMATED LIQUID HANDLING MARKET REVENUE, FOR PLATE REFORMATTING, BY REGION , 2020-2030,($MILLION)
    TABLE 19. AUTOMATED LIQUID HANDLING MARKET PLATE REFORMATTING BY COUNTRY, 2020-2030,($MILLION)
    TABLE 20. AUTOMATED LIQUID HANDLING MARKET REVENUE, FOR PLATE REPLICATION, BY REGION , 2020-2030,($MILLION)
    TABLE 21. AUTOMATED LIQUID HANDLING MARKET PLATE REPLICATION BY COUNTRY, 2020-2030,($MILLION)
    TABLE 22. AUTOMATED LIQUID HANDLING MARKET REVENUE, FOR PCR SETUP, BY REGION , 2020-2030,($MILLION)
    TABLE 23. AUTOMATED LIQUID HANDLING MARKET PCR SETUP BY COUNTRY, 2020-2030,($MILLION)
    TABLE 24. AUTOMATED LIQUID HANDLING MARKET REVENUE, FOR HIGH-THROUGHPUT SCREENING, BY REGION , 2020-2030,($MILLION)
    TABLE 25. AUTOMATED LIQUID HANDLING MARKET HIGH-THROUGHPUT SCREENING BY COUNTRY, 2020-2030,($MILLION)
    TABLE 26. AUTOMATED LIQUID HANDLING MARKET REVENUE, FOR CELL CULTURE, BY REGION , 2020-2030,($MILLION)
    TABLE 27. AUTOMATED LIQUID HANDLING MARKET CELL CULTURE BY COUNTRY, 2020-2030,($MILLION)
    TABLE 28. AUTOMATED LIQUID HANDLING MARKET REVENUE, FOR WHOLE GENOME AMPLIFICATION, BY REGION , 2020-2030,($MILLION)
    TABLE 29. AUTOMATED LIQUID HANDLING MARKET WHOLE GENOME AMPLIFICATION BY COUNTRY, 2020-2030,($MILLION)
    TABLE 30. AUTOMATED LIQUID HANDLING MARKET REVENUE, FOR ARRAY PRINTING, BY REGION , 2020-2030,($MILLION)
    TABLE 31. AUTOMATED LIQUID HANDLING MARKET ARRAY PRINTING BY COUNTRY, 2020-2030,($MILLION)
    TABLE 32. AUTOMATED LIQUID HANDLING MARKET REVENUE, FOR OTHERS, BY REGION , 2020-2030,($MILLION)
    TABLE 33. AUTOMATED LIQUID HANDLING MARKET OTHERS BY COUNTRY, 2020-2030,($MILLION)
    TABLE 34. GLOBAL AUTOMATED LIQUID HANDLING MARKET, BY END USER, 2020-2030,($MILLION)
    TABLE 35. AUTOMATED LIQUID HANDLING MARKET REVENUE, FOR BIOTECHNOLOGY AND PHARMACEUTICAL COMPANIES, BY REGION , 2020-2030,($MILLION)
    TABLE 36. AUTOMATED LIQUID HANDLING MARKET BIOTECHNOLOGY AND PHARMACEUTICAL COMPANIES BY COUNTRY, 2020-2030,($MILLION)
    TABLE 37. AUTOMATED LIQUID HANDLING MARKET REVENUE, FOR CONTRACT RESEARCH ORGANIZATIONS, BY REGION , 2020-2030,($MILLION)
    TABLE 38. AUTOMATED LIQUID HANDLING MARKET CONTRACT RESEARCH ORGANIZATIONS BY COUNTRY, 2020-2030,($MILLION)
    TABLE 39. AUTOMATED LIQUID HANDLING MARKET REVENUE, FOR ACADEMIC AND GOVERNMENT RESEARCH INSTITUTES, BY REGION , 2020-2030,($MILLION)
    TABLE 40. AUTOMATED LIQUID HANDLING MARKET ACADEMIC AND GOVERNMENT RESEARCH INSTITUTES BY COUNTRY, 2020-2030,($MILLION)
    TABLE 41. AUTOMATED LIQUID HANDLING MARKET, BY REGION, 2020-2030,($MILLION)
    TABLE 42. NORTH AMERICA AUTOMATED LIQUID HANDLING MARKET, BY TYPE, 2020-2030,($MILLION)
    TABLE 43. NORTH AMERICA AUTOMATED LIQUID HANDLING MARKET, BY MODALITY, 2020-2030,($MILLION)
    TABLE 44. NORTH AMERICA AUTOMATED LIQUID HANDLING MARKET, BY PROCEDURE, 2020-2030,($MILLION)
    TABLE 45. NORTH AMERICA AUTOMATED LIQUID HANDLING MARKET, BY END USER, 2020-2030,($MILLION)
    TABLE 46. NORTH AMERICA AUTOMATED LIQUID HANDLING MARKET, BY COUNTRY, 2020-2030,($MILLION)
    TABLE 47. U.S. AUTOMATED LIQUID HANDLING MARKET BY TYPE 2020-2030,($MILLION)
    TABLE 48. U.S. AUTOMATED LIQUID HANDLING MARKET BY MODALITY 2020-2030,($MILLION)
    TABLE 49. U.S. AUTOMATED LIQUID HANDLING MARKET BY PROCEDURE 2020-2030,($MILLION)
    TABLE 50. U.S. AUTOMATED LIQUID HANDLING MARKET BY END USER 2020-2030,($MILLION)
    TABLE 51. CANADA AUTOMATED LIQUID HANDLING MARKET BY TYPE 2020-2030,($MILLION)
    TABLE 52. CANADA AUTOMATED LIQUID HANDLING MARKET BY MODALITY 2020-2030,($MILLION)
    TABLE 53. CANADA AUTOMATED LIQUID HANDLING MARKET BY PROCEDURE 2020-2030,($MILLION)
    TABLE 54. CANADA AUTOMATED LIQUID HANDLING MARKET BY END USER 2020-2030,($MILLION)
    TABLE 55. EUROPE AUTOMATED LIQUID HANDLING MARKET, BY TYPE, 2020-2030,($MILLION)
    TABLE 56. EUROPE AUTOMATED LIQUID HANDLING MARKET, BY MODALITY, 2020-2030,($MILLION)
    TABLE 57. EUROPE AUTOMATED LIQUID HANDLING MARKET, BY PROCEDURE, 2020-2030,($MILLION)
    TABLE 58. EUROPE AUTOMATED LIQUID HANDLING MARKET, BY END USER, 2020-2030,($MILLION)
    TABLE 59. EUROPE AUTOMATED LIQUID HANDLING MARKET, BY COUNTRY, 2020-2030,($MILLION)
    TABLE 60. GERMANY AUTOMATED LIQUID HANDLING MARKET BY TYPE 2020-2030,($MILLION)
    TABLE 61. GERMANY AUTOMATED LIQUID HANDLING MARKET BY MODALITY 2020-2030,($MILLION)
    TABLE 62. GERMANY AUTOMATED LIQUID HANDLING MARKET BY PROCEDURE 2020-2030,($MILLION)
    TABLE 63. GERMANY AUTOMATED LIQUID HANDLING MARKET BY END USER 2020-2030,($MILLION)
    TABLE 64. FRANCE AUTOMATED LIQUID HANDLING MARKET BY TYPE 2020-2030,($MILLION)
    TABLE 65. FRANCE AUTOMATED LIQUID HANDLING MARKET BY MODALITY 2020-2030,($MILLION)
    TABLE 66. FRANCE AUTOMATED LIQUID HANDLING MARKET BY PROCEDURE 2020-2030,($MILLION)
    TABLE 67. FRANCE AUTOMATED LIQUID HANDLING MARKET BY END USER 2020-2030,($MILLION)
    TABLE 68. UNITED KINGDOM AUTOMATED LIQUID HANDLING MARKET BY TYPE 2020-2030,($MILLION)
    TABLE 69. UNITED KINGDOM AUTOMATED LIQUID HANDLING MARKET BY MODALITY 2020-2030,($MILLION)
    TABLE 70. UNITED KINGDOM AUTOMATED LIQUID HANDLING MARKET BY PROCEDURE 2020-2030,($MILLION)
    TABLE 71. UNITED KINGDOM AUTOMATED LIQUID HANDLING MARKET BY END USER 2020-2030,($MILLION)
    TABLE 72. ITALY AUTOMATED LIQUID HANDLING MARKET BY TYPE 2020-2030,($MILLION)
    TABLE 73. ITALY AUTOMATED LIQUID HANDLING MARKET BY MODALITY 2020-2030,($MILLION)
    TABLE 74. ITALY AUTOMATED LIQUID HANDLING MARKET BY PROCEDURE 2020-2030,($MILLION)
    TABLE 75. ITALY AUTOMATED LIQUID HANDLING MARKET BY END USER 2020-2030,($MILLION)
    TABLE 76. SPAIN AUTOMATED LIQUID HANDLING MARKET BY TYPE 2020-2030,($MILLION)
    TABLE 77. SPAIN AUTOMATED LIQUID HANDLING MARKET BY MODALITY 2020-2030,($MILLION)
    TABLE 78. SPAIN AUTOMATED LIQUID HANDLING MARKET BY PROCEDURE 2020-2030,($MILLION)
    TABLE 79. SPAIN AUTOMATED LIQUID HANDLING MARKET BY END USER 2020-2030,($MILLION)
    TABLE 80. REST OF EUROPE AUTOMATED LIQUID HANDLING MARKET BY TYPE 2020-2030,($MILLION)
    TABLE 81. REST OF EUROPE AUTOMATED LIQUID HANDLING MARKET BY MODALITY 2020-2030,($MILLION)
    TABLE 82. REST OF EUROPE AUTOMATED LIQUID HANDLING MARKET BY PROCEDURE 2020-2030,($MILLION)
    TABLE 83. REST OF EUROPE AUTOMATED LIQUID HANDLING MARKET BY END USER 2020-2030,($MILLION)
    TABLE 84. ASIA-PACIFIC AUTOMATED LIQUID HANDLING MARKET, BY TYPE, 2020-2030,($MILLION)
    TABLE 85. ASIA-PACIFIC AUTOMATED LIQUID HANDLING MARKET, BY MODALITY, 2020-2030,($MILLION)
    TABLE 86. ASIA-PACIFIC AUTOMATED LIQUID HANDLING MARKET, BY PROCEDURE, 2020-2030,($MILLION)
    TABLE 87. ASIA-PACIFIC AUTOMATED LIQUID HANDLING MARKET, BY END USER, 2020-2030,($MILLION)
    TABLE 88. ASIA-PACIFIC AUTOMATED LIQUID HANDLING MARKET, BY COUNTRY, 2020-2030,($MILLION)
    TABLE 89. JAPAN AUTOMATED LIQUID HANDLING MARKET BY TYPE 2020-2030,($MILLION)
    TABLE 90. JAPAN AUTOMATED LIQUID HANDLING MARKET BY MODALITY 2020-2030,($MILLION)
    TABLE 91. JAPAN AUTOMATED LIQUID HANDLING MARKET BY PROCEDURE 2020-2030,($MILLION)
    TABLE 92. JAPAN AUTOMATED LIQUID HANDLING MARKET BY END USER 2020-2030,($MILLION)
    TABLE 93. CHINA AUTOMATED LIQUID HANDLING MARKET BY TYPE 2020-2030,($MILLION)
    TABLE 94. CHINA AUTOMATED LIQUID HANDLING MARKET BY MODALITY 2020-2030,($MILLION)
    TABLE 95. CHINA AUTOMATED LIQUID HANDLING MARKET BY PROCEDURE 2020-2030,($MILLION)
    TABLE 96. CHINA AUTOMATED LIQUID HANDLING MARKET BY END USER 2020-2030,($MILLION)
    TABLE 97. AUSTRALIA AUTOMATED LIQUID HANDLING MARKET BY TYPE 2020-2030,($MILLION)
    TABLE 98. AUSTRALIA AUTOMATED LIQUID HANDLING MARKET BY MODALITY 2020-2030,($MILLION)
    TABLE 99. AUSTRALIA AUTOMATED LIQUID HANDLING MARKET BY PROCEDURE 2020-2030,($MILLION)
    TABLE 100. AUSTRALIA AUTOMATED LIQUID HANDLING MARKET BY END USER 2020-2030,($MILLION)
    TABLE 101. INDIA AUTOMATED LIQUID HANDLING MARKET BY TYPE 2020-2030,($MILLION)
    TABLE 102. INDIA AUTOMATED LIQUID HANDLING MARKET BY MODALITY 2020-2030,($MILLION)
    TABLE 103. INDIA AUTOMATED LIQUID HANDLING MARKET BY PROCEDURE 2020-2030,($MILLION)
    TABLE 104. INDIA AUTOMATED LIQUID HANDLING MARKET BY END USER 2020-2030,($MILLION)
    TABLE 105. REST OF ASIA-PACIFIC AUTOMATED LIQUID HANDLING MARKET BY TYPE 2020-2030,($MILLION)
    TABLE 106. REST OF ASIA-PACIFIC AUTOMATED LIQUID HANDLING MARKET BY MODALITY 2020-2030,($MILLION)
    TABLE 107. REST OF ASIA-PACIFIC AUTOMATED LIQUID HANDLING MARKET BY PROCEDURE 2020-2030,($MILLION)
    TABLE 108. REST OF ASIA-PACIFIC AUTOMATED LIQUID HANDLING MARKET BY END USER 2020-2030,($MILLION)
    TABLE 109. LAMEA AUTOMATED LIQUID HANDLING MARKET, BY TYPE, 2020-2030,($MILLION)
    TABLE 110. LAMEA AUTOMATED LIQUID HANDLING MARKET, BY MODALITY, 2020-2030,($MILLION)
    TABLE 111. LAMEA AUTOMATED LIQUID HANDLING MARKET, BY PROCEDURE, 2020-2030,($MILLION)
    TABLE 112. LAMEA AUTOMATED LIQUID HANDLING MARKET, BY END USER, 2020-2030,($MILLION)
    TABLE 113. LAMEA AUTOMATED LIQUID HANDLING MARKET, BY COUNTRY, 2020-2030,($MILLION)
    TABLE 114. LATIN AMERICA AUTOMATED LIQUID HANDLING MARKET BY TYPE 2020-2030,($MILLION)
    TABLE 115. LATIN AMERICA AUTOMATED LIQUID HANDLING MARKET BY MODALITY 2020-2030,($MILLION)
    TABLE 116. LATIN AMERICA AUTOMATED LIQUID HANDLING MARKET BY PROCEDURE 2020-2030,($MILLION)
    TABLE 117. LATIN AMERICA AUTOMATED LIQUID HANDLING MARKET BY END USER 2020-2030,($MILLION)
    TABLE 118. MIDDLE EAST AND AFRICA AUTOMATED LIQUID HANDLING MARKET BY TYPE 2020-2030,($MILLION)
    TABLE 119. MIDDLE EAST AND AFRICA AUTOMATED LIQUID HANDLING MARKET BY MODALITY 2020-2030,($MILLION)
    TABLE 120. MIDDLE EAST AND AFRICA AUTOMATED LIQUID HANDLING MARKET BY PROCEDURE 2020-2030,($MILLION)
    TABLE 121. MIDDLE EAST AND AFRICA AUTOMATED LIQUID HANDLING MARKET BY END USER 2020-2030,($MILLION)
  • LIST OF FIGURES

  • FIGURE 01. AUTOMATED LIQUID HANDLING MARKET SEGMENTATION
    FIGURE 02. TOP INVESTMENT POCKETS
    FIGURE 03. TOP WINNING STRATEGIES, BY YEAR, 2018–2021
    FIGURE 04. TOP WINNING STRATEGIES, BY DEVELOPMENT, 2018–2021
    FIGURE 05. TOP WINNING STRATEGIES, BY COMPANY, 2018–2021
    FIGURE 06. MODERATE BARGAINING POWER OF SUPPLIERS
    FIGURE 07. MODERATE BARGAINING POWER OF BUYERS
    FIGURE 08. MODERATE THREAT OF SUBSTITUTES
    FIGURE 09. MODERATE THREAT OF NEW ENTRANTS
    FIGURE 10. HIGH INTENSITY OF RIVALRY
    FIGURE 11. TOP PLAYER POSITIONING, 2020
    FIGURE 12. IMPACT ANALYSIS
    FIGURE 13. COMPARATIVE ANALYSIS OF STANDALONE AUTOMATED LIQUID HANDLING MARKET, BY COUNTRY, 2020 & 2030 ($MILLION)
    FIGURE 14. COMPARATIVE ANALYSIS OF INDIVIDUAL BENCHTOP WORKSTATIONS AUTOMATED LIQUID HANDLING MARKET, BY COUNTRY, 2020 & 2030 ($MILLION)
    FIGURE 15. COMPARATIVE ANALYSIS OF MULTI-INSTRUMENT SYSTEM AUTOMATED LIQUID HANDLING MARKET, BY COUNTRY, 2020 & 2030 ($MILLION)
    FIGURE 16. COMPARATIVE ANALYSIS OF OTHERS AUTOMATED LIQUID HANDLING MARKET, BY COUNTRY, 2020 & 2030 ($MILLION)
    FIGURE 17. COMPARATIVE ANALYSIS OF AUTOMATED LIQUID HANDLING MARKET FOR DISPOSABLE TIP, BY COUNTRY, 2020-2030 (%)
    FIGURE 18. COMPARATIVE ANALYSIS OF AUTOMATED LIQUID HANDLING MARKET FOR FIXED TIP, BY COUNTRY, 2020- 2030 (%)
    FIGURE 19. COMPARATIVE ANALYSIS OF AUTOMATED LIQUID HANDLING MARKET FOR PCR SETUP, BY COUNTRY, 2020-2030 (%)
    FIGURE 20. AUTOMATED LIQUID HANDLING MARKET FOR PCR SETUP, BY VOLUME, 2020-2030 (THOUSAND UNITS)
    FIGURE 21. COMPARATIVE ANALYSIS OF AUTOMATED LIQUID HANDLING MARKET FOR SERIAL DILUTION, BY COUNTRY, 2020-2030 (%)
    FIGURE 22. AUTOMATED LIQUID HANDLING MARKET FOR SERIAL DILUTION, BY VOLUME, 2020-2030 (THOUSAND UNITS)
    FIGURE 23. COMPARATIVE ANALYSIS OF AUTOMATED LIQUID HANDLING MARKET FOR HIGH THROUGHPUT SCREENING, BY COUNTRY, 2020- 2030 (%)
    FIGURE 24. AUTOMATED LIQUID HANDLING MARKET FOR HIGH-THROUGHPUT SCREENING, BY VOLUME, 2020-2030 (THOUSAND UNITS)
    FIGURE 25. COMPARATIVE ANALYSIS OF AUTOMATED LIQUID HANDLING MARKET FOR CELL CULTURE, BY COUNTRY, 2020- 2030 (%)
    FIGURE 26. AUTOMATED LIQUID HANDLING MARKET FOR CELL CULTURE, BY VOLUME, 2020-2030 (THOUSAND UNITS)
    FIGURE 27. COMPARATIVE ANALYSIS OF AUTOMATED LIQUID HANDLING MARKET FOR WHOLE GENOME AMPLIFICATION, BY COUNTRY, 2020- 2030 (%)
    FIGURE 28. AUTOMATED LIQUID HANDLING MARKET FOR WHOLE GENOME AMPLIFICATION, BY VOLUME, 2020-2030 (THOUSAND UNITS)
    FIGURE 29. COMPARATIVE ANALYSIS OF AUTOMATED LIQUID HANDLING MARKET FOR PLATE REFORMATTING, BY COUNTRY, 2020- 2030 (%)
    FIGURE 30. AUTOMATED LIQUID HANDLING MARKET FOR PLATE REFORMATTING, BY VOLUME, 2020-2030 (THOUSAND UNITS)
    FIGURE 31. COMPARATIVE ANALYSIS OF AUTOMATED LIQUID HANDLING MARKET FOR PLATE REPLICATION, BY COUNTRY, 2020-2030 (%)
    FIGURE 32. AUTOMATED LIQUID HANDLING MARKET FOR PLATE REPLICATION, BY VOLUME, 2020-2030 (THOUSAND UNITS)
    FIGURE 33. COMPARATIVE ANALYSIS OF AUTOMATED LIQUID HANDLING MARKET FOR ARRAY PRINTING, BY COUNTRY, 2020- 2030 (%)
    FIGURE 34. AUTOMATED LIQUID HANDLING MARKET FOR ARRAY PRINTING, BY VOLUME, 2020-2030 (THOUSAND UNITS)
    FIGURE 35. COMPARATIVE ANALYSIS OF AUTOMATED LIQUID HANDLING MARKET FOR OTHERS, BY COUNTRY, 2020- 2030 (%)
    FIGURE 36. AUTOMATED LIQUID HANDLING MARKET FOR SERIAL DILUTION, BY VOLUME, 2020-2030 (THOUSAND UNITS)
    FIGURE 37. COMPARATIVE ANALYSIS OF AUTOMATED LIQUID HANDLING MARKET FOR PHARMACEUTICAL AND BIOTECHNOLOGY COMPANIES, BY COUNTRY, 2020 & 2030 ($MILLION)
    FIGURE 38. AUTOMATED LIQUID HANDLING MARKET FOR BIOTECHNOLOGY & PHARMACEUTICAL COMPANIES, BY VOLUME, 2020-2030 (THOUSAND UNITS)
    FIGURE 39. COMPARATIVE ANALYSIS OF AUTOMATED LIQUID HANDLING MARKET FOR CONTRACT RESEARCH ORGANIZATIONS, BY COUNTRY, 2020 & 2030 ($MILLION)
    FIGURE 40. AUTOMATED LIQUID HANDLING MARKET FOR CONTRACT RESEARCH ORGANIZATIONS, BY VOLUME, 2020-2030 (THOUSAND UNITS)
    FIGURE 41. COMPARATIVE ANALYSIS OF AUTOMATED LIQUID HANDLING MARKET FOR ACADEMIC & GOVERNMENT RESEARCH INSTITUTES, BY COUNTRY, 2020 & 2030 ($MILLION)
    FIGURE 42. AUTOMATED LIQUID HANDLING MARKET FOR ACADEMIC & GOVERNMENT RESEARCH INSTITUTES, BY VOLUME, 2020-2030 (THOUSAND UNITS)
    FIGURE 43. AGILENT: NET SALES, 2019–2021 ($MILLION)
    FIGURE 44. AGILENT: REVENUE SHARE BY SEGMENT, 2021 (%)
    FIGURE 45. AGILENT: REVENUE SHARE BY REGION, 2021 (%)
    FIGURE 46. CORNING: NET SALES, 2019–2021 ($MILLION)
    FIGURE 47. CORNING: REVENUE SHARE BY SEGMENT, 2021 (%)
    FIGURE 48. CORNING: REVENUE SHARE BY REGION, 2021 (%)
    FIGURE 49. DANAHER: NET SALES, 2018–2020 ($MILLION)
    FIGURE 50. DANAHER: REVENUE SHARE BY SEGMENT, 2020 (%)
    FIGURE 51. DANAHER: REVENUE SHARE BY REGION, 2020 (%)
    FIGURE 52. EPPENDORF: NET SALES, 2018–2020 ($MILLION)
    FIGURE 53. EPPENDORF: REVENUE SHARE BY REGION, 2020 (%)
    FIGURE 54. METTLER-TOLEDO: NET SALES, 2019–2021 ($MILLION)
    FIGURE 55. METTLER-TOLEDO: REVENUE SHARE BY SEGMENT, 2021 (%)
    FIGURE 56. METTLER-TOLEDO: REVENUE SHARE BY REGION, 2021 (%)
    FIGURE 57. PERKINELMER: NET SALES, 2018–2020 ($MILLION)
    FIGURE 58. PERKINELMER: REVENUE SHARE BY SEGMENT, 2020 (%)
    FIGURE 59. PERKINELMER: REVENUE SHARE BY REGION, 2020 (%)
    FIGURE 60. TECAN: NET SALES, 2018–2020 ($MILLION)
    FIGURE 61. TECAN: REVENUE SHARE BY SEGMENT, 2020 (%)
    FIGURE 62. TECAN: REVENUE SHARE BY REGION, 2020 (%)
    FIGURE 63. THERMO FISHER SCIENTIFIC: NET SALES, 2018–2020 ($MILLION)
    FIGURE 64. THERMO FISHER SCIENTIFIC: REVENUE SHARE BY SEGMENT, 2020 (%)
    FIGURE 65. THERMO FISHER SCIENTIFIC: REVENUE SHARE BY REGION, 2020 (%)


Automated liquid handling industry have streamlined research workflows to a great extent and have reduced manual effort required in liquid transfer operations. Manual pipetting can be prone to error and is not very reproducible. This creates additional bottlenecks in overall research experiment, when experiments are not satisfactorily reproduced. Therefore, different research laboratories globally are adopting ALH systems as they deliver error-free reproducible results. ALH systems comprise instruments and equipment that are used to handle liquids and execute different functions related to liquid transfer in a clinical and research environment.

The use of ALH systems has resulted in efficient high-throughput screening of chemical compounds. High-throughput screening is of utmost necessity in the pharmaceutical industry to execute drug discovery and development. Likewise, in research settings, routine laboratory procedures equipped with ALH through work-stations allow researchers to think deeply and unconventionally about their experiment outcomes. Furthermore, this also helps scientists and researchers design effective follow-up projects or develop alternative approaches and hypotheses for their investigations instead of repeatedly doing tedious tasks, especially pipetting.

The ALH market has gained momentum in research, innovation, and development sectors, owing to increase in productivity and profitability it offers, which reduces burden associated with manual liquid transfer operations. In addition, dearth of skilled professionals, technological advancements associated with ALH systems, and advantages of ALH systems over manual pipetting drive the market growth. High-end equipment; their continuous use, in terms of procedures such as plate reformatting, plate replication, high throughput screening array printing, and other procedures are carried out to a higher extent in the biotechnology & pharmaceutical industry, when compared to other end users. Employment of technologically advanced ALH systems is the highest in North America, owing to increase in adoption of this technology, followed by Europe and Asia-Pacific.

PURCHASE OPTIONS

Call or Email us

U.S.-Canada Toll-free: +1-800-792-5285
Int'l : +1-503-894-6022
Europe : +44-845-528-1300
Email : help@alliedmarketresearch.com
 
FREQUENTLY ASKED QUESTIONS?

A. The total market value of automated liquid handling market is $2,385.91 million in 2030.

A. Top companies such as Thermo Fisher Scientific Inc., Danaher Corporation (Beckman Coulter Life Sciences), Corning Inc., Agilent Technologies, Inc. (Biotek Instruments, Inc.), PerkinElmer, Inc., Mettler-Toledo International Inc. held a high market position in 2020. These key players held a high market postion owing to the strong geographical foothold in different regions.

A. Standalone segment is the most influencing segment owing to the technological advancements associated with ALH systems, rise in adoption of ALH in pharmaceutical companies & R&D institutes.

A. The forcast period for automated liquid handling market is 2020 to 2030

A. The market value of automated liquid handling market in 2020 is $960.98 million.

A. The base year is 2020 in automated liquid handling market

A. The technological advancements associated with ALH systems, rise in adoption of ALH in pharmaceutical companies & R&D institutes, development of R&D infrastructure in emerging economies, and advantages of ALH systems over manual pipetting, key advantages such as rise in productivity, efficiency, and enhanced accuracy are the key trends in the automated liquid handling market report.

A. Asia-Pacific has the highest growth rate of 8.6% in the market which is growing due to presence of large patient population, strong presence of key players, ease of devices availability, well developed healthcare infrastructure, favorable reimbursement policies in healthcare system, higher number of research and development.

A. Yes, the automated liquid handling market companies are profiled in the report.

A. Yes, the automated liquid handling market report provides PORTER Analysis

Looking for Customization?

 Customization Request

Have a Question?

 Speak with Analyst

Any Confusion?

 Inquire Before Buying

Have a glance of the Report

  Request Sample
RELATED TAGS

Purchase Full Report of
Automated Liquid Handling Market

Start reading instantly.
This Report and over 66,804+ more Reports, Available with Avenue Library. T&C*.

  • Online Only
  • $3,456
  • Online cloud access only
  • Restricted print, copy, paste & download
  • Read only
  • Free industry update
    (Within 180 days)
  • Free report update in next update cycle
    (Mar 2023 - Mar 2024)
  • Data Pack
  • $3,840
  • Restricted to one authorized user
  • One print only
  • Available in
    Excel
  • Free industry update
    (Within 180 days)
  •   Free report update in next update cycle
    (Mar 2023 - Mar 2024)
  • Single User
  • $5,769
  • Restricted to one authorized user
  • One print only
  • Available in
    PDF
  • Free industry update
    (Within 180 days)
  •   Free report update in next update cycle
    (Mar 2023 - Mar 2024)
  • Five Users
  • $6,450
  • Limited to five authorized users
  • Print upto five copies
  • Available in
    PDF
  • Free industry update
    (Within 180 days)
  •   Free report update in next update cycle
    (Mar 2023 - Mar 2024)
  • Enterprise
    License/PDF

  • $10,995
  • Unlimited
    within
    company/enterprise
  • Available in Excel & PDF
  • Free industry update
    (Within 180 days)
  •   Free report update in next update cycle
    (Mar 2023 - Mar 2024)
  • Library
    Membership

  • $999 $ 1,175
    Per User/ Per month/ Billed annually
  • Published Content
    E-access
  • Company Profiles
    E-access
  • Newly Added Content Access
  • 10 PDF
    Downloads
  • 5 Excel Data
    Pack Downloads
  • 250 Company Profiles PDF Downloads
  • Buy Now

*Taxes/Fees, if applicable will be added during checkout. All prices in USD

RELATED REPORTS
 

Why Allied Market Research?


Infallible Methodology

To ensure high-level data integrity, accurate analysis, and impeccable forecasts

Analyst Support

For complete satisfaction

Customization

On-demand customization of scope of the report to exactly meet your needs

TARGETED MARKET VIEW

Targeted market view to provide pertinent information and save time of readers

Get fresh content delivered

Get insights on topics that are crucial for your business. Stay abreast of your interest areas.

Get Industry Data Alerts

Why Allied Market Research?

Infallible Methodology

To ensure high-level data integrity, accurate analysis, and impeccable forecasts

Analyst Support

For complete satisfaction

Customization

On-demand customization of scope of the report to exactly meet your needs

TARGETED MARKET VIEW

Targeted market view to provide pertinent information and save time of readers