
Automotive RADAR Market Overview
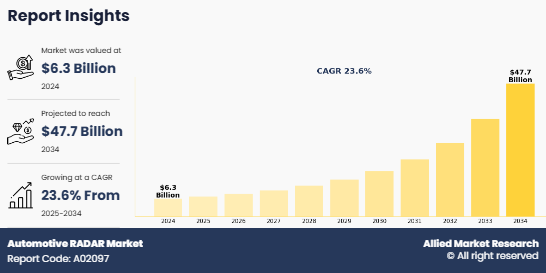
The global Automotive RADAR Market Size was valued at $6.3 billion in 2024, and is projected to reach $47.7 billion by 2034, growing at a CAGR of 23.6% from 2025 to 2034. The growth of the automotive radar market is driven by the rising demand for advanced safety features and comfortable driving experiences. Strict government regulations mandating safety technologies, such as ADAS, are further accelerating adoption. As ADAS relies heavily on radar systems for functions like collision warnings and blind-spot detection, the increasing implementation of these technologies is significantly boosting the demand for automotive radar.
Key Market Trends
Adaptive Cruise Control (ACC) continues to lead automotive RADAR applications, maintaining its dominance since 2024.
Short and Medium Range RADAR (S&MRR) dominates the market by range, driven by its suitability for multiple ADAS features.
Asia-Pacific leads the global market, fueled by robust vehicle production in China, India, and Japan, rising ADAS adoption, and supportive safety regulations.
Market Size & Forecast
2034 Projected Market Size: USD 47.7 billion
2024 Market Size: USD 6.3 billion
Compound Annual Growth Rate (CAGR) (2025-2034): 23.6%
What is the function of automotive radar
The Automotive RADAR Market refers to the global industry focused on the development, production, and integration of Radio Detection and Ranging (RADAR) systems in vehicles to enhance safety, automation, and driver assistance. These RADAR systems use radio waves to detect objects, measure their distance, speed, and direction, and are essential components of Advanced Driver Assistance Systems (ADAS) such as adaptive cruise control, collision avoidance, blind spot detection, and autonomous emergency braking. The market is driven by rising safety regulations, increasing demand for autonomous vehicles, and advancements in sensor technologies.
Key Takeaways
- The automotive RADAR market size covers 20 countries. The research includes a segment analysis of each country in terms of value ($Billion) for the projected period 2023-2033.
- More than 1,500 product literatures, industry releases, annual reports, and other such documents of major decorative coatings industry participants along with authentic industry journals, trade associations' releases, and government websites have been reviewed for generating high-value industry insights.
- The study integrated high-quality data, professional opinions and analysis, and critical independent perspectives. The research approach is intended to provide a balanced view of global markets and to assist stakeholders in making educated decisions to achieve their most ambitious Automotive RADAR Market Growth objectives.
What are the key market dynamics in the automotive RADAR market
The demand for safety features such as parking assistance, collision avoidance systems, lane departure warnings, traction control, electronic stability control, tire pressure monitors, airbags, and telematics is on the rise due to the growing number of road accidents worldwide. Automotive radar plays a crucial role in advanced driver assistance systems (ADAS), as it can detect and classify objects on the road, alert drivers to surrounding conditions, and automatically decelerate or stop the vehicle as needed. Road accidents remain one of the leading causes of death globally, with nearly 1.3 million fatalities reported annually, according to the World Health Organization. Teenagers, in particular, are among the most affected by road traffic injuries. These alarming statistics are driving increased Automotive RADAR Market Demand for safety features in vehicles. Automotive companies are actively developing and incorporating advanced safety technologies to meet customer expectations. For instance, in February 2020, HELLA announced its plans to produce cutting-edge 77 GHz radar technology. Automotive radar, as an application of complementary metal oxide semiconductors (CMOS) radar, is emerging as a critical technology in supporting the smart and autonomous capabilities of modern vehicles. These systems help reduce driver fatigue, automate repetitive tasks, and deliver life-saving interventions, all of which are contributing to a higher adoption rate of automotive radar systems during the Automotive RADAR Market Forecast period.
In addition, several countries across the globe have implemented laws and regulations requiring vehicles to be equipped with safety systems such as lane departure warning systems and tire pressure monitoring systems within a specified time frame. For example, in 2018, the Road Transport Minister of India announced at the Society of Indian Automobile Manufacturers (SIAM) conference that the Indian government was committed to improving road safety by mandating the inclusion of advanced driver-assistance systems (ADAS) in all cars by 2022. Furthermore, the installation of automotive radar systems has been made mandatory in various countries, along with related technologies such as drowsiness monitoring systems, lane departure systems, and driver monitoring systems. In the United States, automobile manufacturers are required to obtain safety ratings from agencies like the Insurance Institute of Highway Safety (IIHS) and the New Car Assessment Program (NCAP) to secure sales licenses for vehicles. These emerging safety regulations and government mandates are expected to significantly drive the growth of the automotive radar market in the coming years.
However, the high cost associated with installing sensing technologies in vehicles is a significant restraint on the growth of the automotive radar market. Automotive radar systems are expensive, limiting their installation to premium or high-end vehicles. Offering advanced features in vehicles adds extra expenses for consumers, including hardware, applications, and telecom service charges, which ultimately leads to lower adoption rates of automotive radar systems worldwide. Additionally, the serviceability of these systems is complex, requiring skilled technicians due to the involvement of multiple sensors and electronic components. As a result, the high initial cost and intricate structure of these systems are expected to negatively impact the growth of the automotive radar market during the forecast period.
Companies are integrating a broader array of features and technologies into their vehicles to offer superior safety, comfort, and enhance sales. Technological innovations in electronic components, such as automotive radar, light detection and ranging (LiDAR), and connected car technologies, supported by wireless communication and cloud systems, are providing better situational awareness and improving consumer safety. As the automotive industry advances toward higher levels of autonomy, radar systems play a pivotal role in functions such as adaptive cruise control, collision avoidance, blind-spot detection, and traffic jam assist. Advanced radar technologies operating at higher frequencies, such as 77 GHz and 79 GHz, offer greater precision, extended detection ranges, and higher resolution, which are vital for next-generation ADAS features. The growing emphasis on achieving zero-accident goals and the increasing demand for smart, connected vehicles is driving substantial opportunities in the automotive radar market, positioning it as a key enabler for future mobility solutions. Therefore, technological advancements in advanced driver assistance systems (ADAS) are expected to provide significant growth opportunities for key players in the automotive radar market during the forecast period.
Segment Analysis
The automotive radar market is segmented on the basis of application, frequency, range, vehicle type, and region. Application segment includes adaptive cruise control (ACC), autonomous emergency braking (AEB), blind spot detection (BSD), forward collision warning system, intelligent park assists, and others. By frequency, the Automotive RADAR Industry is categorized into 24 GHz, 77 GHz, and 79 GHz. By range, the market is classified into long-range radar (LRR), and short & medium range radar (S&MRR). By region, the market is analyzed across North America, Europe, Asia-Pacific, and LAMEA.
By Application

Based on applications, the Adaptive Cruise Control (ACC) segment dominated the global Automotive RADAR Industry in 2024 and is likely to remain dominant during the forecast period. This dominance is attributed to increasing demand for semi-autonomous driving features, growing consumer preference for driver assistance systems, and regulatory pushes for advanced safety features across mass-market and premium vehicles.
ACC systems use radar and camera sensors to maintain a safe following distance from the vehicle ahead, automatically adjusting the vehicle’s speed to match traffic conditions. The increasing demand for semi-autonomous driving features and growing consumer preference for driver assistance systems are key drivers for the continued expansion of ACC systems. Moreover, regulatory mandates for advanced safety features in both mass-market and premium vehicles have further fueled the adoption of ACC systems. Governments worldwide are encouraging the adoption of such systems to reduce accidents and enhance road safety, contributing to the sustained growth of the market.
The autonomous emergency braking (AEB) system, which uses radar and camera sensors to detect potential collisions and automatically applies the brakes, is another essential application gaining momentum. This system is particularly valuable in preventing rear-end collisions and minimizing the severity of accidents. Similarly, blind spot detection (BSD) systems are becoming standard in vehicles, especially in premium and luxury cars. These systems alert drivers when there is a vehicle in their blind spot, significantly reducing the likelihood of accidents during lane changes. The growing prevalence of ADAS (Advanced Driver Assistance Systems) is one of the major reasons for the increasing adoption of automotive radar across various applications.
By Frequency

Based on frequency, the 24 GHz segment led the global market in 2024, and is likely to remain dominant during the forecast period. Its leadership is driven by cost-effectiveness, suitability for short-range applications, and wide adoption in entry- and mid-level vehicles before the full transition to 77 GHz platforms.
One of the main reasons for the widespread adoption of 24 GHz radar is its cost-effectiveness and suitability for short-range applications. 24 GHz radar is often used in entry- and mid-level vehicles, offering reliable performance at an affordable cost. Its low cost makes it an attractive option for automakers looking to incorporate radar-based safety features in vehicles without significantly increasing the price of the vehicle.
On the other hand, the 77 GHz and 79 GHz radar frequencies are gaining popularity due to their higher resolution, longer detection range, and better ability to detect smaller objects at greater distances. These higher-frequency radars are crucial for more advanced applications, including adaptive cruise control (ACC), autonomous driving, and collision avoidance. These technologies offer enhanced performance, enabling more sophisticated features that are vital for the development of fully autonomous vehicles. 77 GHz radar systems, in particular, are seen as a crucial technology for next-generation ADAS, as they provide high-resolution imaging with the ability to detect pedestrians, cyclists, and other potential hazards in real time.
By Range

Based on range, the Short and Medium Range RADAR (S&MRR) segment dominated the global market in 2024 and is likely to remain dominant during the forecast period. This dominance can be attributed to the widespread adoption of S&MRR for applications such as blind-spot detection, lane-change assistance, and rear cross-traffic alerts, especially in compact and mid-sized passenger cars. These systems are crucial for increasing vehicle safety by preventing accidents during low-speed maneuvers, such as changing lanes or backing out of parking spaces.
Short and medium-range radars are typically used for monitoring the vehicle’s surroundings in real-time, providing critical information about nearby objects and road conditions. In contrast, long-range radar (LRR) is used primarily in applications requiring longer detection ranges, such as adaptive cruise control (ACC), collision avoidance, and forward collision warning systems. LRR systems are essential for detecting potential hazards at a greater distance, allowing for more time to react to dangerous situations. The demand for LRR systems is increasing, driven by the growing adoption of semi-autonomous and autonomous vehicles that require more advanced sensing technologies for safe operation.
By Region

The Asia-Pacific region emerged as the leading market for automotive RADAR systems in 2024. Asia-Pacific dominated the Automotive RADAR market due to strong automotive production hubs in China, India, and Japan, increasing electrification trends, growing demand for ADAS-equipped vehicles, and favorable government regulations supporting road safety initiatives.
The rise in electrification trends, including the increasing demand for electric vehicles (EVs), coupled with favorable government regulations supporting road safety initiatives, has further boosted the demand for automotive radar systems in this region. The presence of key automakers such as Toyota, Honda, and Nissan, as well as numerous local players, makes the Asia-Pacific region a significant market for automotive radar.
The North American and European regions are also experiencing steady growth in the adoption of automotive radar systems. In North America, regulatory requirements for advanced safety features, such as collision avoidance and lane-departure warning systems, have driven demand for radar technologies. The presence of major automotive manufacturers and their commitment to developing autonomous driving technologies have further fueled the demand for radar systems. Similarly, in Europe, the focus on road safety and the increasing push toward autonomous vehicles have been key factors driving the adoption of radar technologies.
What are the top automotive radar companies globally
The following are the leading companies in the market.
- Analog Devices, Inc.
- BorgWarner Inc.
- Continental AG
- DENSO Corporation
- NXP Semiconductors
- Robert Bosch GmbH
- Texas Instruments
- Valeo
- Veoneer Inc.
- ZF Friedrichshafen AG
These companies are heavily investing in research and development (R&D) to enhance the performance and efficiency of their radar systems, with a particular focus on improving detection range, resolution, and the integration of radar with other sensor technologies, such as LiDAR and cameras, for a more comprehensive sensing solution.
As the automotive industry moves toward higher levels of automation and autonomous driving, the demand for advanced radar systems is expected to continue growing. These key players are focusing on expanding their product portfolios, forming strategic partnerships, and increasing their presence in emerging markets to maintain their competitive edge in the automotive radar market.
Key Benefits for Stakeholders
- This report provides a quantitative analysis of the market segments, current trends, estimations, and dynamics of the automotive radar market analysis from 2024 to 2034 to identify the prevailing automotive radar market opportunities.
- The market research is offered along with information related to key drivers, restraints, and opportunities.
- Porter's five forces analysis highlights the potency of buyers and suppliers to enable stakeholders make profit-oriented business decisions and strengthen their supplier-buyer network.
- In-depth analysis of the automotive radar market segmentation assists to determine the prevailing market opportunities.
- Major countries in each region are mapped according to their revenue contribution to the global market.
- Market player positioning facilitates benchmarking and provides a clear understanding of the present position of the market players.
- The report includes the analysis of the regional as well as global automotive radar market trends, key players, market segments, application areas, and market growth strategies.
Automotive RADAR Market Report Highlights
| Aspects | Details |
| Market Size By 2034 | USD 47.7 billion |
| Growth Rate | CAGR of 23.6% |
| Forecast period | 2024 - 2034 |
| Report Pages | 300 |
| By Application |
|
| By Frequency |
|
| By Range |
|
| By Region |
|
| Key Market Players | BorgWarner Inc., Texas Instruments Incorporated, Analog Devices, Inc., DENSO CORPORATION, NXP Semiconductors, Robert Bosch GmbH, Valeo, ZF Friedrichshafen AG, Veoneer US Safety Systems, LLC., Continental AG |
Analyst Review
According to the insights of the CXOs of leading companies, the global automotive radar market is expected to grow at a remarkable rate in future owing to rising demand for safety and comfort features along with the rise in strict rules and regulations for increasing safety features in automobiles.
Factors such as rise in demand for safety features in automobiles and increase in need for comfortable driving boost the Automotive RADAR Market Growth of the market. In addition, strict rules and regulations for safety features is anticipated to propel the growth of the automotive radar market. However, factors such as high cost & complex structure and low efficiency in bad weather conditions is anticipated to hamper the growth of the market. Further, increase in technological advancement and innovation in ADAS is expected to create numerous opportunities for the players operating in the automotive radar market.
Blind-spot monitoring, collision warning & mitigation, and object identification are some of the primary applications of automotive radar in ADAS. Object detection and blind-spot monitoring applications utilize radar technology, while collision mitigation systems leverage the data from the radar-based system to take preventive actions such as braking and counter steering to prevent road accidents. The frequency of vehicle radar has switched up to the 77-81GHz band in general. The angular separation capacity and radial speed resolution improve as we increase the frequency. It will be easier to implement a wider bandwidth since the broad bandwidth will be a little component of the center frequency. Broader bandwidth will result in increased range resolution. The key market players profiled in the report include Key players including Analog Devices, Inc., BorgWarner Inc., Continental AG, DENSO Corporation, NXP Semiconductors, Robert Bosch GmbH, Texas Instruments, Valeo, Veoneer Inc. and ZF Friedrichshafen AG.
The global automotive radar market was valued at $6,304.2 million in 2024, and is projected to reach $47,729.5 million by 2034, registering a CAGR of 23.6% from 2025 to 2034.
From 2024-2034 would be forecast period in the market report.
$7,098.5 million is the market value of automotive RADAR market in 2025.
2024 is base year calculated in the automotive RADAR market report.
Analog Devices, Inc., BorgWarner Inc., Continental AG, DENSO Corporation, NXP Semiconductors, Robert Bosch GmbH are the top companies hold the market share in automotive RADAR market.
Loading Table Of Content...
Loading Research Methodology...

