
Automotive Films Market Research, 2033
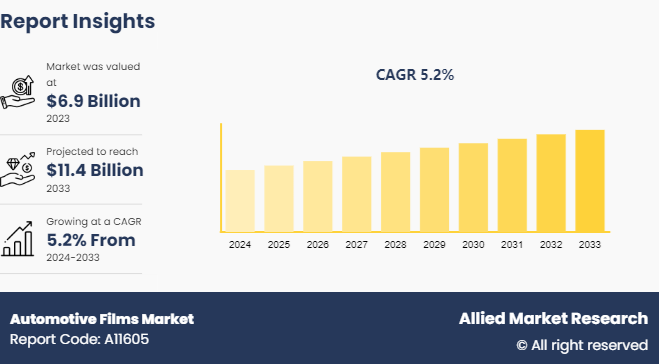
The global automotive films market size was valued at $6.9 billion in 2023, and is projected to reach $11.4 billion by 2033, growing at a CAGR of 5.2% from 2024 to 2033.
Market Introduction and Definition
Automotive films also known as automotive window films or automotive tint films are thin multi-layered films typically made of polyester or polymer materials. These films are designed to be applied to the windows of vehicles such as cars, trucks, and sport utility vehicles, for various purposes such as enhancing aesthetics, providing privacy, improving safety, and protecting occupants and interiors from UV radiation and heat.
Key Takeaways
The automotive films market share covers 20 countries. The research includes a segment analysis of each country in terms of value ($Billion) for the projected period 2023-2033.
More than 1,500 product literatures, industry releases, annual reports, and other such documents of major automotive films industry participants along with authentic industry journals, trade associations' releases, and government websites have been reviewed for generating high-value industry insights.
The study integrated high-quality data, professional opinions and analysis, and critical independent perspectives. The research approach is intended to provide a balanced view of global markets and to assist stakeholders in making educated decisions to achieve their most ambitious growth objectives.
Key Market Dynamics
Automotive films specifically designed to block up to 99% of UV radiation, offer an effective solution to these concerns. By applying these films to vehicle windows occupants protected from the harmful effects of the sun enhancing their comfort and safety during travel. This health benefit has become a significant selling point particularly in regions with high sun exposure where UV radiation levels are more intense. Moreover, protecting the interior of vehicles from UV damage extends the life of the vehicle's components, maintaining its value and appearance. This added benefit appeals to vehicle owners who wish to preserve their investments. As a result, both new car buyers and existing vehicle owners are increasingly opting for automotive films to safeguard their health and the longevity of their vehicle interiors. All these factors are expected to drive the demand for the automotive films market during the forecast period.
Automotive films offer various benefits such as improved aesthetics, solar control, and safety, the upfront investment required for purchasing and installing these films can deter some consumers. The cost of high-quality automotive films, particularly those with advanced features such as ceramic coatings or self-healing properties substantial, makes them a significant financial consideration for vehicle owners. The high initial costs associated with automotive films pose a significant challenge to the growth of the automotive films market growth.
electric vehicles often feature large windows to maximize visibility and create a sense of spaciousness in the cabin. Automotive films can be applied to these windows to provide various benefits such as reducing glare from the sun and improving insulation to maintain comfortable interior temperatures. This aligns with the priorities of EV owners who seek to optimize energy efficiency and comfort. Moreover, electric vehicles are often equipped with advanced technology and features, such as touchscreen displays and connectivity options. Automotive films can be integrated with these technologies to offer additional functionalities such as glare reduction on displays or enhanced privacy for occupants using in-car entertainment systems. All these factors are anticipated to offer new growth opportunities for global automotive firms during the forecast period.
Market Segmentation
The automotive films market is segmented by material type, film type, vehicle type, application, and region. Based on material type, the market is classified into polyethylene terephthalate (PET) , polyethylene (PE) , poly vinyl chloride (PVC) , polyurethane (PU) , and others. By film type, the market is divided into window films, paint protection films (PPF) , wrap films, and others. By function, the market is divided into protecton and NVH. By vehicle type, the market is divided into passenger vehicles and commercial vehicles. By application, the market is divided into interior and exterior. Region-wise the market is analyzed across North America, Europe, Asia-Pacific, and LAMEA.
Regional Market Outlook
Automotive films provide crucial protection against the region’s intense sunlight and high temperatures. The tropical climate prevalent in many parts of Asia-Pacific lead to excessive heat buildup inside vehicles making driving uncomfortable and even hazardous. Automotive films with heat-rejecting properties help reduce this issue by blocking a significant portion of solar heat, thereby keeping the interior cooler and reducing the need for air conditioning. In the Asia-Pacific region, the automotive films market has experienced significant growth driven by various factors such as rising consumer awareness about the benefits of automotive films, increasing demand for vehicle customization, and stringent regulations related to vehicle safety and environmental protection.
Competitive Landscape
The major players operating in the automotive films market include 3M Company, Eastman Chemical Company, Lintec of America, INC, HEXIS S.A.S, Madico, Inc., Johnson Window Films, Inc., Garware Hi - Tech Films Limited., TORAY INDUSTRIES, INC., SAINT-GOBAIN, Nexfil USA.
Recent Key Strategies and Developments
In February 2023, Eastman Chemical Company acquired Ai-Red Technology (Dalian) Co., Ltd., a leading manufacturer and supplier of paint protection and window film for automotive and architectural applications in the Asia Pacific region. This acquisition highlights Eastman's strategic focus on expanding its presence in the Performance Films sector and strengthening its position in the growing markets for paint protection and window films.
In December 2022, Toray Industries, Inc., introduced a polyethylene terephthalate (PET) film with superior applicability and adhesion for water-based and solvent-free coatings. This innovative film aims to eliminate carbon dioxide emissions derived from solvents during manufacturing processes. Toray plans to commence production of this eco-friendly film at a domestic facility by the end of March 2024, with the goal of promoting environmentally sustainable film products. These films are intended for various applications, such as release, adhesive, printing, packaging, and automotive sectors.
Global Electric Car Sale (in Million)

The surge in global electric car sales from 2018 to 2023 has significantly impacted the automotive films market. As electric vehicles (EVs) have grown from 2.1 million units in 2018 to a remarkable 13.8 million units in 2023, the demand for high-performance materials, such as automotive films, has increased correspondingly. Automotive films, known for their protective and aesthetic qualities, are essential for EVs, which often emphasize sleek designs and advanced features. The rise in EV adoption has driven innovation in film technologies, focusing on durability, lightweight properties, and thermal management to enhance the performance and efficiency of these vehicles.
Industry Trends
According to data from the China Passenger Car Association (CPCA) , February 2023 witnessed robust sales figures, totaling approximately 1.42 million units, marking a notable increase of 10.4% compared to the previous year. Moreover, the segment of new energy vehicles (NEVs) , comprising pure battery electric cars and plug-in hybrids, experienced even more significant growth, with sales surging by 61% compared to the same period last year.
Passenger cars serve as the primary mode of road transportation across the globe, with approximately 70 million new cars manufactured annually. Most of these vehicles are powered by petrol (gasoline) or diesel fuels. Passenger cars contribute to around 45% of the total global energy consumption in the transportation sector, which itself represents about 20% of the overall primary energy consumption.
The India passenger car market, valued at USD 32.70 billion in 2021, is projected to reach USD 54.84 billion by 2027, registering a Compound Annual Growth Rate (CAGR) exceeding 9% between 2022 and 2027, as per the India Brand Equity Foundation (IBEF) .
Key Sources Referred
Ministry of Heavy Industries.
India Brand Equity Foundation
Invest India
International Energy Agency.
International Renewable Energy Agency.
United Nations Development Programme
Ministry of Mines
Key Benefits For Stakeholders
This report provides a quantitative analysis of the market segments, current trends, estimations, and dynamics of the automotive films market analysis from 2024 to 2033 to identify the prevailing automotive films market opportunities.
The market research is offered along with information related to key drivers, restraints, and opportunities.
Porter's five forces analysis highlights the potency of buyers and suppliers to enable stakeholders make profit-oriented business decisions and strengthen their supplier-buyer network.
In-depth analysis of the automotive films market forecast, segmentation assists to determine the prevailing market opportunities.
Major countries in each region are mapped according to their revenue contribution to the global market.
Market player positioning facilitates benchmarking and provides a clear understanding of the present position of the market players.
The report includes the analysis of the regional as well as global automotive films market trends, key players, market segments, application areas, and market growth strategies.
Automotive Films Market Report Highlights
| Aspects | Details |
| Market Size By 2033 | USD 11.4 Billion |
| Growth Rate | CAGR of 5.2% |
| Forecast period | 2024 - 2033 |
| Report Pages | 340 |
| By Material Type |
|
| By Film Type |
|
| By Function |
|
| By Vehicle Type |
|
| By Application |
|
| By Region |
|
| Key Market Players | SAINT-GOBAIN, Eastman Chemical Company, Nexfil USA, Johnson Window Films, Inc, TORAY INDUSTRIES, INC., Lintec of America, INC, Madico, Inc, Garware Hi - Tech Films Limited, HEXIS S.A.S, 3M Company |
Exterior is the leading application of Automotive Films Market.
Increased demand for advanced protective films, growth in thermoplastic polyurethane films are the upcoming trends of Automotive Films Market in the world.
Asia-Pacific is the largest regional market for Automotive Films
$11.3 billion is the estimated industry size of Automotive Films by 2033.
3M Company, Eastman Chemical Company, Lintec of America, INC, Madico, Inc., Johnson Window Films, Inc., TORAY INDUSTRIES, INC., SAINT-GOBAIN, Nexfil USA are the top companies to hold the market share in Automotive Films
Loading Table Of Content...

