0
New
New
2023
Automotive Flywheel Market

Automotive Flywheel Market

by Type (Single Mass, Dual Mass), by Transmission Type (Manual Transmission, Semi-Automatic and Automatic Transmission, Continuously Variable Transmission), by Vehicle type (Passenger Vehicle, Commercial vehicle), by Distribution channel (OEM, Aftermarket): Global Opportunity Analysis and Industry Forecast, 2023-2032

Report Code: A04868
May 2023 | Pages: 296
Tables: 143
Charts: 69
  • Formats*:

  • pdf

    Single User License, Five User
    License & Enterprise User License

  • xls

    Data Pack Excel License

  • ppt

    It comes with the additional cost
    of $2500.00 contact sales.


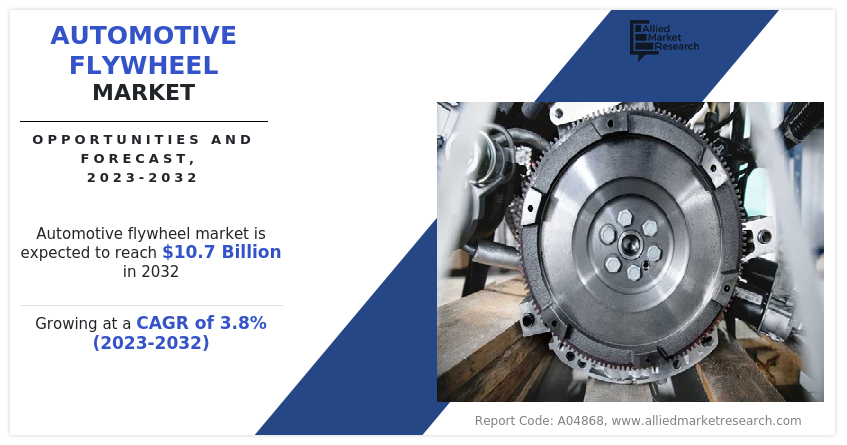
The global automotive flywheel market size was valued at $7.4 billion in 2022, and is projected to reach $10.7 billion by 2032, growing at a CAGR of 3.8% from 2023 to 2032.

Flywheel is a mechanical device used to store rotational energy in a rotating mass. It consists of a heavy disc or wheel that is attached to a shaft and is used to smooth out the delivery of power from an engine or other power source. The flywheel helps to maintain a constant speed and prevent fluctuations in torque, which can be especially important in applications in the automotive industry. On the other hand, a flexplate, also known as the flywheel flexplate, is similar to a flywheel, however, is usually an automatic transmission application. It is a thin, circular plate that is mounted to the engine's crankshaft and connects to the torque converter. The flexplate serves a similar purpose as a flywheel. It stores rotational energy and provides a stable platform for the torque converter to engage and disengage.
Automotive Flywheel Market

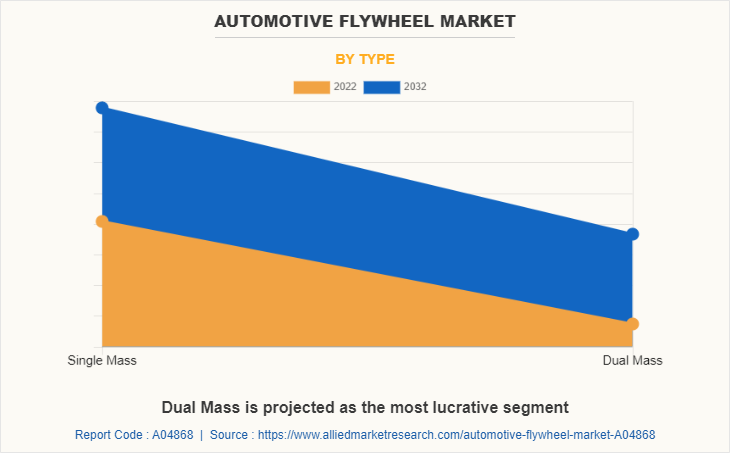
The single mass flywheel is a weighted disc that is located at the end of the engine's crankshaft before the clutch and gearbox. A single or solid mass flywheel has no moving parts, is formed of a single, substantial piece of metal or steel, and offers direct contact between the clutch assembly and the engine. However, dual mass flywheel consists of two flywheels, one coupled with the crankshaft and the other to the clutch. The primary purpose of the dual mass version is to reduce noise and vibration by storing energy from an engine-firing pulse and transferring it to the crankshaft so that it rotates smoothly until the next piston pulse. Between the two discs, several powerful springs serve as a "mechanical cushion" to absorb damage of torsional spikes against engine vibrations and shield the gearbox from them.

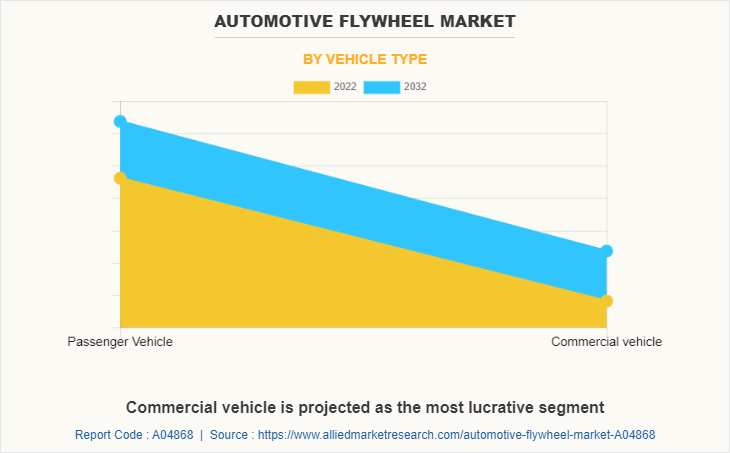
Dual-mass flywheels increase fuel efficiency due to the more effectiveness and efficient use of engine power. Owing to this, they are mostly utilized in commercial vehicles, notably those with diesel engines and manual transmissions. An increase in the penetration of commercial vehicles is anticipated to drive the growth of the dual-mass flywheel market. Moreover, due to the lack of cylinders causing undesirable anomalies in crankshaft speed and the high levels of vibration, flywheels need to keep up with the recent downsizing trend. This has helped the creation of devices such as the dual-mass flywheel, as opposed to the typical single-mass units, which  creates noise during driving. This helps to fuel the growth of the dual mass flywheels.
Automotive Flywheel Market

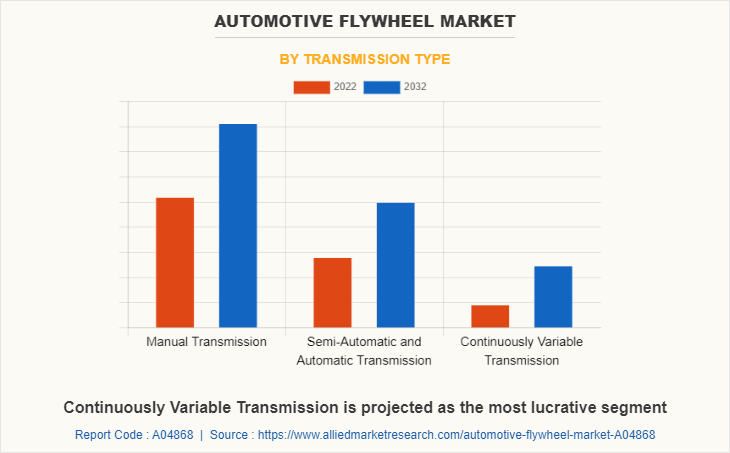
Manual transmissions are generally less expensive than automatic transmissions, making them a more affordable option for budget-conscious consumers. Manual transmissions typically have better fuel efficiency than automatic transmissions, as they allow more precise control over the engine’s power output. Many car enthusiasts prefer the driving experience of a manual transmission, as it allows for greater control over the acceleration and braking of the vehicle. Manual transmissions can provide better performance in certain situations, such as off-roading or racing, where the driver may need to shift gears quickly and frequently. Manual transmissions are generally simple and easier to maintain than automatic transmissions, as they have minimum complex parts.

The Canadian automotive industry has a greater concentration of light trucks and SUVs owing to their high residual value and functionalities. Light trucks have higher-priced parts that increases the value per part and service, which is expected to offer significant revenue potential for the automotive flywheel industry players in the country. In addition, the huge population of out-of-warranty vehicles, driven by the growth of used vehicle sales, provides vast opportunities for the automotive flywheel market. Moreover, early adoption of technology-based business models and services, such as eRetailing, service aggregations, and telematics-based prognostics, is anticipated to promote online automotive component sales and services, which in turn, propel the growth of the market during the forecast period.

Growth in penetration of dual-clutch transmission (DCT) & continuous variable transmission (CVT), increased manufacturing & sales of cars, and an increase in demand for commercial vehicles are the major factors that propel the automotive flywheel market growth. However, the increase in the adoption of electric vehicles and the rise in the trend for repair rather than replacing the flywheel are the major factors that hamper the growth of the market. Furthermore, continuous technological improvements and a surge in the electric vehicle business across the globe, and the development of lightweight vehicle components to enhance fuel efficiency are the factors that are expected to offer growth opportunities for the market during the forecast period.

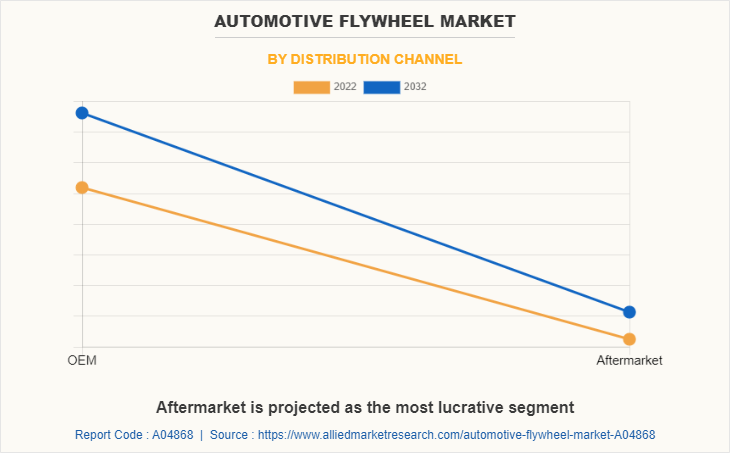
The automotive flywheel market is segmented on the basis of type, transmission type, vehicle type, distribution channel, and region. By type, it is divided into a single mass and dual mass. By transmission type, it is classified into manual, semi-automatic & automatic, and CVT. By vehicle type, it is categorized into passenger vehicle and commercial vehicle. By distribution channel, it is bifurcated into OEM and aftermarket. By region, the market is analyzed across North America, Europe, Asia-Pacific, and LAMEA.
Automotive Flywheel Market

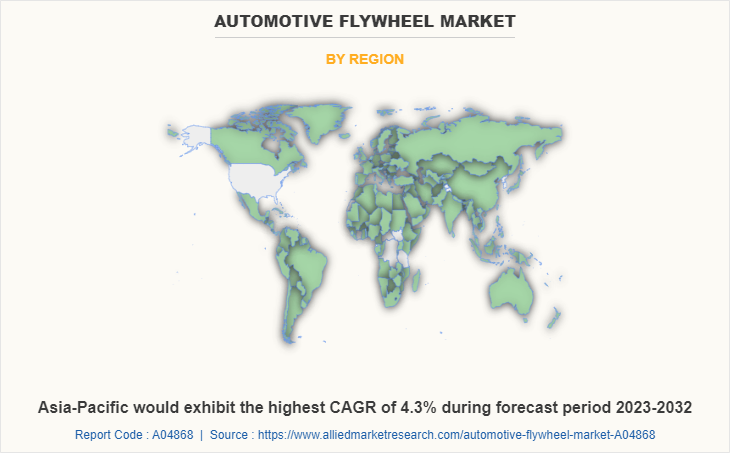
Asia-Pacific dominated the market in 2022. It is analyzed across China, India, Japan, South Korea, and the rest of Asia-Pacific has one of the most advanced automotive sectors across the globe. Rest of Asia-Pacific includes Australia, New Zealand, ASEAN, and others. Countries such as China, Japan, India, and others in the region are highly developed in terms of infrastructure and automotive manufacturing facilities.

Some leading companies profiled in the automotive flywheel market report comprises AISIN CORPORATION, EXEDY Globalparts Corp., Ford Motor Company, Pioneer Automotive Industries, Schaeffler Technologies AG & Co. KG, Skyway Precision Inc., SPEC Clutch, Inc., VALEO SERVICE, and ZF Friedrichshafen AG.
Automotive Flywheel Market

The leading companies have adopted strategies such as product launch, expansion, and product development to strengthen their market position. In February 2021, Valeo S.A launched Dual Mass Flywheel for Mahindra XUV500. These flywheels are available on vehicles with internal combustion engines to provide significant inertia for a regular regime of rotation. In addition, in March 2019, Pioneer Automotive Industries launched 25 new numbers in the Powertrain category including automatic and manual transmission shift, detent, accelerator, and clutch cables, along with automatic transmission flexplates and a manual flywheel.

Growth in penetration of dual-clutch transmission (DCT) and continuous variable transmission (CVT)

Dual clutch transmission (DCT) and Continuous variable transmission (CVT) are two types of transmission systems used in modern automobiles. DCT is a type of automatic transmission that uses two clutches instead of one. One clutch control an odd number of gears, while the other controls an even number of gears. When a gear change is required, one clutch disengages while the other engages, allowing seamless and faster gear changes. On the other hand, CVT is a type of automatic transmission that can continuously vary the gear ratio to provide the optimal engine output for any given driving condition. Instead of using a fixed number of gears, CVT uses a pulley and belt system to continuously adjust the gear ratio. This allows a smoother driving experience and improves fuel efficiency.

Stricter environmental regulations around the world have pushed automakers to develop more fuel-efficient vehicles. DCT and CVT provide improved fuel efficiency compared to traditional automatic or manual transmissions, making them an attractive option for automakers. In addition, the cost of manufacturing DCT and CVT has decreased in recent years, making them more affordable for automakers to produce and offer in their vehicles. Offering vehicles equipped with DCT and CVT can help automakers differentiate themselves from their competitors and to a wider range of customers.

Moreover, consumers are increasingly looking for vehicles that offer a smooth driving experience, improve performance, and have high fuel efficiency. This requirement is fulfilled by DCT and CVT by providing improved performance and fuel efficiency. Such improvement in performance requires high-quality flywheels that can manage the increased demand placed on them. In addition, DCT and CVT require high-quality flywheels to operate efficiently. As the penetration of these transmission systems increases, the demand for high-quality flywheels also is expected to increase, driving the growth of the automotive flywheel market.
Automotive Flywheel Market

Increased manufacturing and sales of cars

The automotive flywheel market in the area has growth potential due to a rise in consumer spending and increased use of vehicles in developing countries. In addition, the world's population has grown, and as a result, the demand for transportation has increased. The economic growth in many countries has increased disposable income, which has translated into higher demand for cars. As more people move into urban areas, the demand for cars increases. Cars provide a convenient mode of  operation in urban areas where public transportation may not be as accessible or convenient. These factors increased manufacturing and sales of care, which in turn is expected to create demand for car flywheels during the forecast period.

Moreover, developing and implementing novel transportation solutions have expanded tremendously in nations such as the U.S., India, and China, which see automobile manufacturing and production as a foundation of economic development. For instance, according to OICA, globally, 61,598,650 units of cars and 23,418,078 units of commercial vehicles were produced in the year 2022. In addition, in India 4,439,039 units of cars; in China 23,836,083 units of cars; and in the U.S., 1,751,736 units of cars were produced in the year 2022.

Government regulations that incorporate elevated levels of protection and high local content requirements have fueled the growth of the car industry in developing economies over the last few decades. While these rules have boosted local cars and related components including flywheel production, they have also helped certain local businesses survive even in an economic downturn. In addition, the emergence of global potential automobile manufacturers such as General Motors, Hyundai, Kia, Renault, and Volvo, focusing on expanding their production capacities in developing countries through joint ventures with local manufacturers, is expected propels the growth of the automotive flywheel market.

Surge in adoption of electric vehicles.

The rise in popularity and adoption of electric vehicles have presented a challenge to the growth of the automotive flywheel market. As electric vehicles do not use traditional internal combustion engines (ICEs), they do not require a flywheel to store kinetic energy (KE). In addition, in recent years, the demand and production of electric vehicles have increased significantly as electric vehicles offer several advantages over fuel-powered automobiles. Electric vehicles remove the requirement of engine components such as flywheels, fan belts, oil, air filters, head gaskets, timing belts, cylinder heads, and spark plugs, which, in turn, makes them cost-effective and efficient for IC engine-powered automobiles. This makes electric vehicles a preferred choice for automobile owners. For instance, Protean Electric and Local Motors announced the continuation of their strategic relationship in June 2021 with a new three-year agreement for U.S. $7.3 million, in which Protean Electric would provide thousands of Protean Drive in-wheel motors to power Local Motors' Olli 2.0 electric autonomous shuttle. As a result, the demand for flywheels decreased, which is likely to impact the growth of the market. This shift in demand toward electric vehicles has forced the flywheel industry to adapt and explore new avenues for growth and development.

Continuous technological improvements

The automotive industry has seen continuous technological advancements in kinetic energy recovery systems in recent years, leading to the development of improved flywheel designs and materials. During a vehicle's braking phase, kinetic energy recovery from a moving object is mostly started. An energy recovery system's shaft must be part of the powertrain and must typically be attached to the crankshaft or an axle to function. Energy recovery mechanisms such as an electric motor, flywheel, or compressor are connected to the driveline through the gearbox as the vehicle slows down. This causes the flywheels to spin up and start working with the electric motors or compressors to convert the kinetic energy to electric or hydraulic energy, depending on the system. Hence, improvement in flywheel help to increase the performance of the kinetic energy recovery systems.

Moreover, advancements in computer-aided design and manufacturing technologies have allowed more precise and complex flywheel designs, which can further improve their performance. In addition, technological advancement is in the development of hybrid flywheels, which combine the energy storage capabilities of the traditional mechanical flywheel with the benefits of an electrical system. These hybrid flywheels are being used in automotive applications, especially for motorsports. Therefore, technological developments in kinetic energy recovery systems can provide significant growth opportunities to major market players in the automotive flywheel market in the forecast period.
Automotive Flywheel Market

During the COVID-19 pandemic, there was a decline in vehicle demand from consumers due to the lockdown. Therefore, the sudden decrease in demand for vehicles impacted automaker revenue and profitability that resulted in job losses in the automotive industry. For instance, the global economic trade impact of the COVID-19 pandemic on the automotive industry was estimated to have been around $5.7 billion. Furthermore, the pandemic forced many top automotive manufacturers to post or slow down their production lines, which led to a decrease in the demand for automotive components, including flywheels. This led to a decline in the revenue of many flywheel manufacturers and forced some to re-evaluate their business models and considered new markets or product offerings.

Key Benefits For Stakeholders

  • This report provides a quantitative analysis of the market segments, current trends, estimations, and dynamics of the automotive flywheel market analysis from 2022 to 2032 to identify the prevailing automotive flywheel market opportunities.
  • The market research is offered along with information related to key drivers, restraints, and opportunities.
  • Porter's five forces analysis highlights the potency of buyers and suppliers to enable stakeholders make profit-oriented business decisions and strengthen their supplier-buyer network.
  • In-depth analysis of the automotive flywheel market segmentation assists to determine the prevailing market opportunities.
  • Major countries in each region are mapped according to their revenue contribution to the global market.
  • Market player positioning facilitates benchmarking and provides a clear understanding of the present position of the market players.
  • The report includes the analysis of the regional as well as global automotive flywheel market trends, key players, market segments, application areas, and market growth strategies.

Automotive Flywheel Market Report Highlights

Aspects Details
Market Size By 2032 USD 10.7 billion
Growth Rate CAGR of 3.8%
Forecast period 2022 - 2032
Report Pages 296
By Distribution channel
  • OEM
  • Aftermarket
By Type
  • Single Mass
  • Dual Mass
By Transmission Type
  • Manual Transmission
  • Semi-Automatic and Automatic Transmission
  • Continuously Variable Transmission
By Vehicle type
  • Passenger Vehicle
  • Commercial vehicle
By Region
  • North America  (U.S., Canada, Mexico)
  • Europe  (Germany, UK, France, Italy, Rest of Europe)
  • Asia-Pacific  (China, Japan, India, South Korea, Rest of Asia-Pacific)
  • LAMEA  (Latin America, Middle East, Africa)
Key Market Players SPEC Clutch, Inc., Ford Motor Company, Skyway Precision Inc., ZF Friedrichshafen AG, Schaeffler Technologies AG & Co. KG, Pioneer Automotive Industries, Aisin Corporation, EXEDY Globalparts Corp, AMS Automotive, Valeo S.A

Analyst Review

The Automotive flywheel market is expected to witness remarkable growth in the future, owing to increase in demand for commercial vehicles. The key factors that drive the growth of the automotive flywheel market are the surge in penetration of dual-clutch transmission (DCT) and continuous variable transmission (CVT). However, rise in trend for repair rather than replacement of the flywheel is anticipated to hinder the automotive flywheel market growth. Furthermore, development of lightweight vehicle components to enhance fuel efficiency is expected to provide remarkable growth opportunities for players operating in the used cars market.

The rise in fuel prices across the globe has further increased the demand for fuel-efficient automobiles. Automotive manufacturers have reduced the weight of automotive components including engine components such as flywheels and transmission components systems by utilizing lightweight materials such as aluminum components and plastic casing. Heavy steel automotive components can be replaced with lighter materials such as high-strength steel, aluminum, or glass fiber-reinforced polymer composites, resulting in significant weight reduction and surge in the fuel economy of the vehicle. As it takes less energy to accelerate a lighter object than a heavier one, lightweight materials offer enormous potential for increasing vehicle efficiency, which further increases the demand for lightweight automotive flywheel systems. For instance, according to the ACTION CLUTCH report presented on March 2022, swapping stock flywheels for lightweight ones has become increasingly popular among automotive enthusiasts. A lightweight flywheel makes the car snappier and allows the engine to revolve more freely. The lesser inertia in the flywheel makes the car respond to upshifting instantly, which is a notable feature for road racing and driving in canyons. In addition, it is essential to reduce the weight of the automotive components to improve the efficiency of individual driving dynamics. Moreover, the surge in demand for high-performance vehicles across the globe has further fueled the demand for high-performance automotive flywheel and kinetic energy storage systems to improve the drivability of the vehicle in high-speed tracks or off-roading environments

 
  • CHAPTER 1: INTRODUCTION

    • 1.1. Report description

    • 1.2. Key market segments

    • 1.3. Key benefits to the stakeholders

    • 1.4. Research Methodology

      • 1.4.1. Primary research

      • 1.4.2. Secondary research

      • 1.4.3. Analyst tools and models

  • CHAPTER 2: EXECUTIVE SUMMARY

    • 2.1. CXO Perspective

  • CHAPTER 3: MARKET OVERVIEW

    • 3.1. Market definition and scope

    • 3.2. Key findings

      • 3.2.1. Top impacting factors

      • 3.2.2. Top investment pockets

    • 3.3. Porter’s five forces analysis

      • 3.3.1. Bargaining power of suppliers

      • 3.3.2. Bargaining power of buyers

      • 3.3.3. Threat of substitutes

      • 3.3.4. Threat of new entrants

      • 3.3.5. Intensity of rivalry

    • 3.4. Market dynamics

      • 3.4.1. Drivers

        • 3.4.1.1. Growth in penetration of dual-clutch transmission (DCT) and continuous variable transmission (CVT)
        • 3.4.1.2. Increased manufacturing and sales of cars
        • 3.4.1.3. Increase in demand for commercial vehicles

      • 3.4.2. Restraints

        • 3.4.2.1. Increase in adoption of electric vehicles
        • 3.4.2.2. Rise in trend for repair rather than replacing the flywheel

      • 3.4.3. Opportunities

        • 3.4.3.1. Continuous technological improvements
        • 3.4.3.2. Development of lightweight vehicle components to enhance fuel efficiency

    • 3.5. COVID-19 Impact Analysis on the market

  • CHAPTER 4: AUTOMOTIVE FLYWHEEL MARKET, BY TYPE

    • 4.1. Overview

      • 4.1.1. Market size and forecast

    • 4.2. Single Mass

      • 4.2.1. Key market trends, growth factors and opportunities

      • 4.2.2. Market size and forecast, by region

      • 4.2.3. Market share analysis by country

    • 4.3. Dual Mass

      • 4.3.1. Key market trends, growth factors and opportunities

      • 4.3.2. Market size and forecast, by region

      • 4.3.3. Market share analysis by country

  • CHAPTER 5: AUTOMOTIVE FLYWHEEL MARKET, BY TRANSMISSION TYPE

    • 5.1. Overview

      • 5.1.1. Market size and forecast

    • 5.2. Manual Transmission

      • 5.2.1. Key market trends, growth factors and opportunities

      • 5.2.2. Market size and forecast, by region

      • 5.2.3. Market share analysis by country

    • 5.3. Semi-Automatic and Automatic Transmission

      • 5.3.1. Key market trends, growth factors and opportunities

      • 5.3.2. Market size and forecast, by region

      • 5.3.3. Market share analysis by country

    • 5.4. Continuously Variable Transmission

      • 5.4.1. Key market trends, growth factors and opportunities

      • 5.4.2. Market size and forecast, by region

      • 5.4.3. Market share analysis by country

  • CHAPTER 6: AUTOMOTIVE FLYWHEEL MARKET, BY VEHICLE TYPE

    • 6.1. Overview

      • 6.1.1. Market size and forecast

    • 6.2. Passenger Vehicle

      • 6.2.1. Key market trends, growth factors and opportunities

      • 6.2.2. Market size and forecast, by region

      • 6.2.3. Market share analysis by country

    • 6.3. Commercial vehicle

      • 6.3.1. Key market trends, growth factors and opportunities

      • 6.3.2. Market size and forecast, by region

      • 6.3.3. Market share analysis by country

  • CHAPTER 7: AUTOMOTIVE FLYWHEEL MARKET, BY DISTRIBUTION CHANNEL

    • 7.1. Overview

      • 7.1.1. Market size and forecast

    • 7.2. OEM

      • 7.2.1. Key market trends, growth factors and opportunities

      • 7.2.2. Market size and forecast, by region

      • 7.2.3. Market share analysis by country

    • 7.3. Aftermarket

      • 7.3.1. Key market trends, growth factors and opportunities

      • 7.3.2. Market size and forecast, by region

      • 7.3.3. Market share analysis by country

  • CHAPTER 8: AUTOMOTIVE FLYWHEEL MARKET, BY REGION

    • 8.1. Overview

      • 8.1.1. Market size and forecast By Region

    • 8.2. North America

      • 8.2.1. Key trends and opportunities

      • 8.2.2. Market size and forecast, by Type

      • 8.2.3. Market size and forecast, by Transmission Type

      • 8.2.4. Market size and forecast, by Vehicle type

      • 8.2.5. Market size and forecast, by Distribution channel

      • 8.2.6. Market size and forecast, by country

        • 8.2.6.1. U.S.
          • 8.2.6.1.1. Key market trends, growth factors and opportunities
          • 8.2.6.1.2. Market size and forecast, by Type
          • 8.2.6.1.3. Market size and forecast, by Transmission Type
          • 8.2.6.1.4. Market size and forecast, by Vehicle type
          • 8.2.6.1.5. Market size and forecast, by Distribution channel
        • 8.2.6.2. Canada
          • 8.2.6.2.1. Key market trends, growth factors and opportunities
          • 8.2.6.2.2. Market size and forecast, by Type
          • 8.2.6.2.3. Market size and forecast, by Transmission Type
          • 8.2.6.2.4. Market size and forecast, by Vehicle type
          • 8.2.6.2.5. Market size and forecast, by Distribution channel
        • 8.2.6.3. Mexico
          • 8.2.6.3.1. Key market trends, growth factors and opportunities
          • 8.2.6.3.2. Market size and forecast, by Type
          • 8.2.6.3.3. Market size and forecast, by Transmission Type
          • 8.2.6.3.4. Market size and forecast, by Vehicle type
          • 8.2.6.3.5. Market size and forecast, by Distribution channel
    • 8.3. Europe

      • 8.3.1. Key trends and opportunities

      • 8.3.2. Market size and forecast, by Type

      • 8.3.3. Market size and forecast, by Transmission Type

      • 8.3.4. Market size and forecast, by Vehicle type

      • 8.3.5. Market size and forecast, by Distribution channel

      • 8.3.6. Market size and forecast, by country

        • 8.3.6.1. Germany
          • 8.3.6.1.1. Key market trends, growth factors and opportunities
          • 8.3.6.1.2. Market size and forecast, by Type
          • 8.3.6.1.3. Market size and forecast, by Transmission Type
          • 8.3.6.1.4. Market size and forecast, by Vehicle type
          • 8.3.6.1.5. Market size and forecast, by Distribution channel
        • 8.3.6.2. UK
          • 8.3.6.2.1. Key market trends, growth factors and opportunities
          • 8.3.6.2.2. Market size and forecast, by Type
          • 8.3.6.2.3. Market size and forecast, by Transmission Type
          • 8.3.6.2.4. Market size and forecast, by Vehicle type
          • 8.3.6.2.5. Market size and forecast, by Distribution channel
        • 8.3.6.3. France
          • 8.3.6.3.1. Key market trends, growth factors and opportunities
          • 8.3.6.3.2. Market size and forecast, by Type
          • 8.3.6.3.3. Market size and forecast, by Transmission Type
          • 8.3.6.3.4. Market size and forecast, by Vehicle type
          • 8.3.6.3.5. Market size and forecast, by Distribution channel
        • 8.3.6.4. Italy
          • 8.3.6.4.1. Key market trends, growth factors and opportunities
          • 8.3.6.4.2. Market size and forecast, by Type
          • 8.3.6.4.3. Market size and forecast, by Transmission Type
          • 8.3.6.4.4. Market size and forecast, by Vehicle type
          • 8.3.6.4.5. Market size and forecast, by Distribution channel
        • 8.3.6.5. Rest of Europe
          • 8.3.6.5.1. Key market trends, growth factors and opportunities
          • 8.3.6.5.2. Market size and forecast, by Type
          • 8.3.6.5.3. Market size and forecast, by Transmission Type
          • 8.3.6.5.4. Market size and forecast, by Vehicle type
          • 8.3.6.5.5. Market size and forecast, by Distribution channel
    • 8.4. Asia-Pacific

      • 8.4.1. Key trends and opportunities

      • 8.4.2. Market size and forecast, by Type

      • 8.4.3. Market size and forecast, by Transmission Type

      • 8.4.4. Market size and forecast, by Vehicle type

      • 8.4.5. Market size and forecast, by Distribution channel

      • 8.4.6. Market size and forecast, by country

        • 8.4.6.1. China
          • 8.4.6.1.1. Key market trends, growth factors and opportunities
          • 8.4.6.1.2. Market size and forecast, by Type
          • 8.4.6.1.3. Market size and forecast, by Transmission Type
          • 8.4.6.1.4. Market size and forecast, by Vehicle type
          • 8.4.6.1.5. Market size and forecast, by Distribution channel
        • 8.4.6.2. Japan
          • 8.4.6.2.1. Key market trends, growth factors and opportunities
          • 8.4.6.2.2. Market size and forecast, by Type
          • 8.4.6.2.3. Market size and forecast, by Transmission Type
          • 8.4.6.2.4. Market size and forecast, by Vehicle type
          • 8.4.6.2.5. Market size and forecast, by Distribution channel
        • 8.4.6.3. India
          • 8.4.6.3.1. Key market trends, growth factors and opportunities
          • 8.4.6.3.2. Market size and forecast, by Type
          • 8.4.6.3.3. Market size and forecast, by Transmission Type
          • 8.4.6.3.4. Market size and forecast, by Vehicle type
          • 8.4.6.3.5. Market size and forecast, by Distribution channel
        • 8.4.6.4. South Korea
          • 8.4.6.4.1. Key market trends, growth factors and opportunities
          • 8.4.6.4.2. Market size and forecast, by Type
          • 8.4.6.4.3. Market size and forecast, by Transmission Type
          • 8.4.6.4.4. Market size and forecast, by Vehicle type
          • 8.4.6.4.5. Market size and forecast, by Distribution channel
        • 8.4.6.5. Rest of Asia-Pacific
          • 8.4.6.5.1. Key market trends, growth factors and opportunities
          • 8.4.6.5.2. Market size and forecast, by Type
          • 8.4.6.5.3. Market size and forecast, by Transmission Type
          • 8.4.6.5.4. Market size and forecast, by Vehicle type
          • 8.4.6.5.5. Market size and forecast, by Distribution channel
    • 8.5. LAMEA

      • 8.5.1. Key trends and opportunities

      • 8.5.2. Market size and forecast, by Type

      • 8.5.3. Market size and forecast, by Transmission Type

      • 8.5.4. Market size and forecast, by Vehicle type

      • 8.5.5. Market size and forecast, by Distribution channel

      • 8.5.6. Market size and forecast, by country

        • 8.5.6.1. Latin America
          • 8.5.6.1.1. Key market trends, growth factors and opportunities
          • 8.5.6.1.2. Market size and forecast, by Type
          • 8.5.6.1.3. Market size and forecast, by Transmission Type
          • 8.5.6.1.4. Market size and forecast, by Vehicle type
          • 8.5.6.1.5. Market size and forecast, by Distribution channel
        • 8.5.6.2. Middle East
          • 8.5.6.2.1. Key market trends, growth factors and opportunities
          • 8.5.6.2.2. Market size and forecast, by Type
          • 8.5.6.2.3. Market size and forecast, by Transmission Type
          • 8.5.6.2.4. Market size and forecast, by Vehicle type
          • 8.5.6.2.5. Market size and forecast, by Distribution channel
        • 8.5.6.3. Africa
          • 8.5.6.3.1. Key market trends, growth factors and opportunities
          • 8.5.6.3.2. Market size and forecast, by Type
          • 8.5.6.3.3. Market size and forecast, by Transmission Type
          • 8.5.6.3.4. Market size and forecast, by Vehicle type
          • 8.5.6.3.5. Market size and forecast, by Distribution channel
  • CHAPTER 9: COMPETITIVE LANDSCAPE

    • 9.1. Introduction

    • 9.2. Top winning strategies

    • 9.3. Product Mapping of Top 10 Player

    • 9.4. Competitive Dashboard

    • 9.5. Competitive Heatmap

    • 9.6. Top player positioning, 2022

  • CHAPTER 10: COMPANY PROFILES

    • 10.1. Aisin Corporation

      • 10.1.1. Company overview

      • 10.1.2. Key Executives

      • 10.1.3. Company snapshot

      • 10.1.4. Operating business segments

      • 10.1.5. Product portfolio

      • 10.1.6. Business performance

      • 10.1.7. Key strategic moves and developments

    • 10.2. AMS Automotive

      • 10.2.1. Company overview

      • 10.2.2. Key Executives

      • 10.2.3. Company snapshot

      • 10.2.4. Operating business segments

      • 10.2.5. Product portfolio

    • 10.3. EXEDY Globalparts Corp

      • 10.3.1. Company overview

      • 10.3.2. Key Executives

      • 10.3.3. Company snapshot

      • 10.3.4. Operating business segments

      • 10.3.5. Product portfolio

      • 10.3.6. Business performance

    • 10.4. Ford Motor Company

      • 10.4.1. Company overview

      • 10.4.2. Key Executives

      • 10.4.3. Company snapshot

      • 10.4.4. Operating business segments

      • 10.4.5. Product portfolio

      • 10.4.6. Business performance

    • 10.5. Pioneer Automotive Industries

      • 10.5.1. Company overview

      • 10.5.2. Key Executives

      • 10.5.3. Company snapshot

      • 10.5.4. Operating business segments

      • 10.5.5. Product portfolio

      • 10.5.6. Key strategic moves and developments

    • 10.6. Schaeffler Technologies AG & Co. KG

      • 10.6.1. Company overview

      • 10.6.2. Key Executives

      • 10.6.3. Company snapshot

      • 10.6.4. Operating business segments

      • 10.6.5. Product portfolio

      • 10.6.6. Business performance

      • 10.6.7. Key strategic moves and developments

    • 10.7. Skyway Precision Inc.

      • 10.7.1. Company overview

      • 10.7.2. Key Executives

      • 10.7.3. Company snapshot

      • 10.7.4. Operating business segments

      • 10.7.5. Product portfolio

    • 10.8. SPEC Clutch, Inc.

      • 10.8.1. Company overview

      • 10.8.2. Key Executives

      • 10.8.3. Company snapshot

      • 10.8.4. Operating business segments

      • 10.8.5. Product portfolio

    • 10.9. Valeo S.A

      • 10.9.1. Company overview

      • 10.9.2. Key Executives

      • 10.9.3. Company snapshot

      • 10.9.4. Operating business segments

      • 10.9.5. Product portfolio

      • 10.9.6. Business performance

      • 10.9.7. Key strategic moves and developments

    • 10.10. ZF Friedrichshafen AG

      • 10.10.1. Company overview

      • 10.10.2. Key Executives

      • 10.10.3. Company snapshot

      • 10.10.4. Operating business segments

      • 10.10.5. Product portfolio

      • 10.10.6. Business performance

      • 10.10.7. Key strategic moves and developments

  • LIST OF TABLES

  • TABLE 01. GLOBAL AUTOMOTIVE FLYWHEEL MARKET, BY TYPE, 2022-2032 ($MILLION)
    TABLE 02. AUTOMOTIVE FLYWHEEL MARKET FOR SINGLE MASS, BY REGION, 2022-2032 ($MILLION)
    TABLE 03. AUTOMOTIVE FLYWHEEL MARKET FOR DUAL MASS, BY REGION, 2022-2032 ($MILLION)
    TABLE 04. GLOBAL AUTOMOTIVE FLYWHEEL MARKET, BY TRANSMISSION TYPE, 2022-2032 ($MILLION)
    TABLE 05. AUTOMOTIVE FLYWHEEL MARKET FOR MANUAL TRANSMISSION, BY REGION, 2022-2032 ($MILLION)
    TABLE 06. AUTOMOTIVE FLYWHEEL MARKET FOR SEMI-AUTOMATIC AND AUTOMATIC TRANSMISSION, BY REGION, 2022-2032 ($MILLION)
    TABLE 07. AUTOMOTIVE FLYWHEEL MARKET FOR CONTINUOUSLY VARIABLE TRANSMISSION, BY REGION, 2022-2032 ($MILLION)
    TABLE 08. GLOBAL AUTOMOTIVE FLYWHEEL MARKET, BY VEHICLE TYPE, 2022-2032 ($MILLION)
    TABLE 09. AUTOMOTIVE FLYWHEEL MARKET FOR PASSENGER VEHICLE, BY REGION, 2022-2032 ($MILLION)
    TABLE 10. AUTOMOTIVE FLYWHEEL MARKET FOR COMMERCIAL VEHICLE, BY REGION, 2022-2032 ($MILLION)
    TABLE 11. GLOBAL AUTOMOTIVE FLYWHEEL MARKET, BY DISTRIBUTION CHANNEL, 2022-2032 ($MILLION)
    TABLE 12. AUTOMOTIVE FLYWHEEL MARKET FOR OEM, BY REGION, 2022-2032 ($MILLION)
    TABLE 13. AUTOMOTIVE FLYWHEEL MARKET FOR AFTERMARKET, BY REGION, 2022-2032 ($MILLION)
    TABLE 14. AUTOMOTIVE FLYWHEEL MARKET, BY REGION, 2022-2032 ($MILLION)
    TABLE 15. NORTH AMERICA AUTOMOTIVE FLYWHEEL MARKET, BY TYPE, 2022-2032 ($MILLION)
    TABLE 16. NORTH AMERICA AUTOMOTIVE FLYWHEEL MARKET, BY TRANSMISSION TYPE, 2022-2032 ($MILLION)
    TABLE 17. NORTH AMERICA AUTOMOTIVE FLYWHEEL MARKET, BY VEHICLE TYPE, 2022-2032 ($MILLION)
    TABLE 18. NORTH AMERICA AUTOMOTIVE FLYWHEEL MARKET, BY DISTRIBUTION CHANNEL, 2022-2032 ($MILLION)
    TABLE 19. NORTH AMERICA AUTOMOTIVE FLYWHEEL MARKET, BY COUNTRY, 2022-2032 ($MILLION)
    TABLE 20. U.S. AUTOMOTIVE FLYWHEEL MARKET, BY TYPE, 2022-2032 ($MILLION)
    TABLE 21. U.S. AUTOMOTIVE FLYWHEEL MARKET, BY TRANSMISSION TYPE, 2022-2032 ($MILLION)
    TABLE 22. U.S. AUTOMOTIVE FLYWHEEL MARKET, BY VEHICLE TYPE, 2022-2032 ($MILLION)
    TABLE 23. U.S. AUTOMOTIVE FLYWHEEL MARKET, BY DISTRIBUTION CHANNEL, 2022-2032 ($MILLION)
    TABLE 24. CANADA AUTOMOTIVE FLYWHEEL MARKET, BY TYPE, 2022-2032 ($MILLION)
    TABLE 25. CANADA AUTOMOTIVE FLYWHEEL MARKET, BY TRANSMISSION TYPE, 2022-2032 ($MILLION)
    TABLE 26. CANADA AUTOMOTIVE FLYWHEEL MARKET, BY VEHICLE TYPE, 2022-2032 ($MILLION)
    TABLE 27. CANADA AUTOMOTIVE FLYWHEEL MARKET, BY DISTRIBUTION CHANNEL, 2022-2032 ($MILLION)
    TABLE 28. MEXICO AUTOMOTIVE FLYWHEEL MARKET, BY TYPE, 2022-2032 ($MILLION)
    TABLE 29. MEXICO AUTOMOTIVE FLYWHEEL MARKET, BY TRANSMISSION TYPE, 2022-2032 ($MILLION)
    TABLE 30. MEXICO AUTOMOTIVE FLYWHEEL MARKET, BY VEHICLE TYPE, 2022-2032 ($MILLION)
    TABLE 31. MEXICO AUTOMOTIVE FLYWHEEL MARKET, BY DISTRIBUTION CHANNEL, 2022-2032 ($MILLION)
    TABLE 32. EUROPE AUTOMOTIVE FLYWHEEL MARKET, BY TYPE, 2022-2032 ($MILLION)
    TABLE 33. EUROPE AUTOMOTIVE FLYWHEEL MARKET, BY TRANSMISSION TYPE, 2022-2032 ($MILLION)
    TABLE 34. EUROPE AUTOMOTIVE FLYWHEEL MARKET, BY VEHICLE TYPE, 2022-2032 ($MILLION)
    TABLE 35. EUROPE AUTOMOTIVE FLYWHEEL MARKET, BY DISTRIBUTION CHANNEL, 2022-2032 ($MILLION)
    TABLE 36. EUROPE AUTOMOTIVE FLYWHEEL MARKET, BY COUNTRY, 2022-2032 ($MILLION)
    TABLE 37. GERMANY AUTOMOTIVE FLYWHEEL MARKET, BY TYPE, 2022-2032 ($MILLION)
    TABLE 38. GERMANY AUTOMOTIVE FLYWHEEL MARKET, BY TRANSMISSION TYPE, 2022-2032 ($MILLION)
    TABLE 39. GERMANY AUTOMOTIVE FLYWHEEL MARKET, BY VEHICLE TYPE, 2022-2032 ($MILLION)
    TABLE 40. GERMANY AUTOMOTIVE FLYWHEEL MARKET, BY DISTRIBUTION CHANNEL, 2022-2032 ($MILLION)
    TABLE 41. UK AUTOMOTIVE FLYWHEEL MARKET, BY TYPE, 2022-2032 ($MILLION)
    TABLE 42. UK AUTOMOTIVE FLYWHEEL MARKET, BY TRANSMISSION TYPE, 2022-2032 ($MILLION)
    TABLE 43. UK AUTOMOTIVE FLYWHEEL MARKET, BY VEHICLE TYPE, 2022-2032 ($MILLION)
    TABLE 44. UK AUTOMOTIVE FLYWHEEL MARKET, BY DISTRIBUTION CHANNEL, 2022-2032 ($MILLION)
    TABLE 45. FRANCE AUTOMOTIVE FLYWHEEL MARKET, BY TYPE, 2022-2032 ($MILLION)
    TABLE 46. FRANCE AUTOMOTIVE FLYWHEEL MARKET, BY TRANSMISSION TYPE, 2022-2032 ($MILLION)
    TABLE 47. FRANCE AUTOMOTIVE FLYWHEEL MARKET, BY VEHICLE TYPE, 2022-2032 ($MILLION)
    TABLE 48. FRANCE AUTOMOTIVE FLYWHEEL MARKET, BY DISTRIBUTION CHANNEL, 2022-2032 ($MILLION)
    TABLE 49. ITALY AUTOMOTIVE FLYWHEEL MARKET, BY TYPE, 2022-2032 ($MILLION)
    TABLE 50. ITALY AUTOMOTIVE FLYWHEEL MARKET, BY TRANSMISSION TYPE, 2022-2032 ($MILLION)
    TABLE 51. ITALY AUTOMOTIVE FLYWHEEL MARKET, BY VEHICLE TYPE, 2022-2032 ($MILLION)
    TABLE 52. ITALY AUTOMOTIVE FLYWHEEL MARKET, BY DISTRIBUTION CHANNEL, 2022-2032 ($MILLION)
    TABLE 53. REST OF EUROPE AUTOMOTIVE FLYWHEEL MARKET, BY TYPE, 2022-2032 ($MILLION)
    TABLE 54. REST OF EUROPE AUTOMOTIVE FLYWHEEL MARKET, BY TRANSMISSION TYPE, 2022-2032 ($MILLION)
    TABLE 55. REST OF EUROPE AUTOMOTIVE FLYWHEEL MARKET, BY VEHICLE TYPE, 2022-2032 ($MILLION)
    TABLE 56. REST OF EUROPE AUTOMOTIVE FLYWHEEL MARKET, BY DISTRIBUTION CHANNEL, 2022-2032 ($MILLION)
    TABLE 57. ASIA-PACIFIC AUTOMOTIVE FLYWHEEL MARKET, BY TYPE, 2022-2032 ($MILLION)
    TABLE 58. ASIA-PACIFIC AUTOMOTIVE FLYWHEEL MARKET, BY TRANSMISSION TYPE, 2022-2032 ($MILLION)
    TABLE 59. ASIA-PACIFIC AUTOMOTIVE FLYWHEEL MARKET, BY VEHICLE TYPE, 2022-2032 ($MILLION)
    TABLE 60. ASIA-PACIFIC AUTOMOTIVE FLYWHEEL MARKET, BY DISTRIBUTION CHANNEL, 2022-2032 ($MILLION)
    TABLE 61. ASIA-PACIFIC AUTOMOTIVE FLYWHEEL MARKET, BY COUNTRY, 2022-2032 ($MILLION)
    TABLE 62. CHINA AUTOMOTIVE FLYWHEEL MARKET, BY TYPE, 2022-2032 ($MILLION)
    TABLE 63. CHINA AUTOMOTIVE FLYWHEEL MARKET, BY TRANSMISSION TYPE, 2022-2032 ($MILLION)
    TABLE 64. CHINA AUTOMOTIVE FLYWHEEL MARKET, BY VEHICLE TYPE, 2022-2032 ($MILLION)
    TABLE 65. CHINA AUTOMOTIVE FLYWHEEL MARKET, BY DISTRIBUTION CHANNEL, 2022-2032 ($MILLION)
    TABLE 66. JAPAN AUTOMOTIVE FLYWHEEL MARKET, BY TYPE, 2022-2032 ($MILLION)
    TABLE 67. JAPAN AUTOMOTIVE FLYWHEEL MARKET, BY TRANSMISSION TYPE, 2022-2032 ($MILLION)
    TABLE 68. JAPAN AUTOMOTIVE FLYWHEEL MARKET, BY VEHICLE TYPE, 2022-2032 ($MILLION)
    TABLE 69. JAPAN AUTOMOTIVE FLYWHEEL MARKET, BY DISTRIBUTION CHANNEL, 2022-2032 ($MILLION)
    TABLE 70. INDIA AUTOMOTIVE FLYWHEEL MARKET, BY TYPE, 2022-2032 ($MILLION)
    TABLE 71. INDIA AUTOMOTIVE FLYWHEEL MARKET, BY TRANSMISSION TYPE, 2022-2032 ($MILLION)
    TABLE 72. INDIA AUTOMOTIVE FLYWHEEL MARKET, BY VEHICLE TYPE, 2022-2032 ($MILLION)
    TABLE 73. INDIA AUTOMOTIVE FLYWHEEL MARKET, BY DISTRIBUTION CHANNEL, 2022-2032 ($MILLION)
    TABLE 74. SOUTH KOREA AUTOMOTIVE FLYWHEEL MARKET, BY TYPE, 2022-2032 ($MILLION)
    TABLE 75. SOUTH KOREA AUTOMOTIVE FLYWHEEL MARKET, BY TRANSMISSION TYPE, 2022-2032 ($MILLION)
    TABLE 76. SOUTH KOREA AUTOMOTIVE FLYWHEEL MARKET, BY VEHICLE TYPE, 2022-2032 ($MILLION)
    TABLE 77. SOUTH KOREA AUTOMOTIVE FLYWHEEL MARKET, BY DISTRIBUTION CHANNEL, 2022-2032 ($MILLION)
    TABLE 78. REST OF ASIA-PACIFIC AUTOMOTIVE FLYWHEEL MARKET, BY TYPE, 2022-2032 ($MILLION)
    TABLE 79. REST OF ASIA-PACIFIC AUTOMOTIVE FLYWHEEL MARKET, BY TRANSMISSION TYPE, 2022-2032 ($MILLION)
    TABLE 80. REST OF ASIA-PACIFIC AUTOMOTIVE FLYWHEEL MARKET, BY VEHICLE TYPE, 2022-2032 ($MILLION)
    TABLE 81. REST OF ASIA-PACIFIC AUTOMOTIVE FLYWHEEL MARKET, BY DISTRIBUTION CHANNEL, 2022-2032 ($MILLION)
    TABLE 82. LAMEA AUTOMOTIVE FLYWHEEL MARKET, BY TYPE, 2022-2032 ($MILLION)
    TABLE 83. LAMEA AUTOMOTIVE FLYWHEEL MARKET, BY TRANSMISSION TYPE, 2022-2032 ($MILLION)
    TABLE 84. LAMEA AUTOMOTIVE FLYWHEEL MARKET, BY VEHICLE TYPE, 2022-2032 ($MILLION)
    TABLE 85. LAMEA AUTOMOTIVE FLYWHEEL MARKET, BY DISTRIBUTION CHANNEL, 2022-2032 ($MILLION)
    TABLE 86. LAMEA AUTOMOTIVE FLYWHEEL MARKET, BY COUNTRY, 2022-2032 ($MILLION)
    TABLE 87. LATIN AMERICA AUTOMOTIVE FLYWHEEL MARKET, BY TYPE, 2022-2032 ($MILLION)
    TABLE 88. LATIN AMERICA AUTOMOTIVE FLYWHEEL MARKET, BY TRANSMISSION TYPE, 2022-2032 ($MILLION)
    TABLE 89. LATIN AMERICA AUTOMOTIVE FLYWHEEL MARKET, BY VEHICLE TYPE, 2022-2032 ($MILLION)
    TABLE 90. LATIN AMERICA AUTOMOTIVE FLYWHEEL MARKET, BY DISTRIBUTION CHANNEL, 2022-2032 ($MILLION)
    TABLE 91. MIDDLE EAST AUTOMOTIVE FLYWHEEL MARKET, BY TYPE, 2022-2032 ($MILLION)
    TABLE 92. MIDDLE EAST AUTOMOTIVE FLYWHEEL MARKET, BY TRANSMISSION TYPE, 2022-2032 ($MILLION)
    TABLE 93. MIDDLE EAST AUTOMOTIVE FLYWHEEL MARKET, BY VEHICLE TYPE, 2022-2032 ($MILLION)
    TABLE 94. MIDDLE EAST AUTOMOTIVE FLYWHEEL MARKET, BY DISTRIBUTION CHANNEL, 2022-2032 ($MILLION)
    TABLE 95. AFRICA AUTOMOTIVE FLYWHEEL MARKET, BY TYPE, 2022-2032 ($MILLION)
    TABLE 96. AFRICA AUTOMOTIVE FLYWHEEL MARKET, BY TRANSMISSION TYPE, 2022-2032 ($MILLION)
    TABLE 97. AFRICA AUTOMOTIVE FLYWHEEL MARKET, BY VEHICLE TYPE, 2022-2032 ($MILLION)
    TABLE 98. AFRICA AUTOMOTIVE FLYWHEEL MARKET, BY DISTRIBUTION CHANNEL, 2022-2032 ($MILLION)
    TABLE 99. AISIN CORPORATION: KEY EXECUTIVES
    TABLE 100. AISIN CORPORATION: COMPANY SNAPSHOT
    TABLE 101. AISIN CORPORATION: PRODUCT SEGMENTS
    TABLE 102. AISIN CORPORATION: PRODUCT PORTFOLIO
    TABLE 103. AISIN CORPORATION: KEY STRATERGIES
    TABLE 104. AMS AUTOMOTIVE: KEY EXECUTIVES
    TABLE 105. AMS AUTOMOTIVE: COMPANY SNAPSHOT
    TABLE 106. AMS AUTOMOTIVE: PRODUCT SEGMENTS
    TABLE 107. AMS AUTOMOTIVE: PRODUCT PORTFOLIO
    TABLE 108. EXEDY GLOBALPARTS CORP: KEY EXECUTIVES
    TABLE 109. EXEDY GLOBALPARTS CORP: COMPANY SNAPSHOT
    TABLE 110. EXEDY GLOBALPARTS CORP: PRODUCT SEGMENTS
    TABLE 111. EXEDY GLOBALPARTS CORP: PRODUCT PORTFOLIO
    TABLE 112. FORD MOTOR COMPANY: KEY EXECUTIVES
    TABLE 113. FORD MOTOR COMPANY: COMPANY SNAPSHOT
    TABLE 114. FORD MOTOR COMPANY: SERVICE SEGMENTS
    TABLE 115. FORD MOTOR COMPANY: PRODUCT PORTFOLIO
    TABLE 116. PIONEER AUTOMOTIVE INDUSTRIES: KEY EXECUTIVES
    TABLE 117. PIONEER AUTOMOTIVE INDUSTRIES: COMPANY SNAPSHOT
    TABLE 118. PIONEER AUTOMOTIVE INDUSTRIES: PRODUCT SEGMENTS
    TABLE 119. PIONEER AUTOMOTIVE INDUSTRIES: PRODUCT PORTFOLIO
    TABLE 120. PIONEER AUTOMOTIVE INDUSTRIES: KEY STRATERGIES
    TABLE 121. SCHAEFFLER TECHNOLOGIES AG & CO. KG: KEY EXECUTIVES
    TABLE 122. SCHAEFFLER TECHNOLOGIES AG & CO. KG: COMPANY SNAPSHOT
    TABLE 123. SCHAEFFLER TECHNOLOGIES AG & CO. KG: PRODUCT SEGMENTS
    TABLE 124. SCHAEFFLER TECHNOLOGIES AG & CO. KG: PRODUCT PORTFOLIO
    TABLE 125. SCHAEFFLER TECHNOLOGIES AG & CO. KG: KEY STRATERGIES
    TABLE 126. SKYWAY PRECISION INC.: KEY EXECUTIVES
    TABLE 127. SKYWAY PRECISION INC.: COMPANY SNAPSHOT
    TABLE 128. SKYWAY PRECISION INC.: PRODUCT SEGMENTS
    TABLE 129. SKYWAY PRECISION INC.: PRODUCT PORTFOLIO
    TABLE 130. SPEC CLUTCH, INC.: KEY EXECUTIVES
    TABLE 131. SPEC CLUTCH, INC.: COMPANY SNAPSHOT
    TABLE 132. SPEC CLUTCH, INC.: PRODUCT SEGMENTS
    TABLE 133. SPEC CLUTCH, INC.: PRODUCT PORTFOLIO
    TABLE 134. VALEO S.A: KEY EXECUTIVES
    TABLE 135. VALEO S.A: COMPANY SNAPSHOT
    TABLE 136. VALEO S.A: PRODUCT SEGMENTS
    TABLE 137. VALEO S.A: PRODUCT PORTFOLIO
    TABLE 138. VALEO S.A: KEY STRATERGIES
    TABLE 139. ZF FRIEDRICHSHAFEN AG: KEY EXECUTIVES
    TABLE 140. ZF FRIEDRICHSHAFEN AG: COMPANY SNAPSHOT
    TABLE 141. ZF FRIEDRICHSHAFEN AG: PRODUCT SEGMENTS
    TABLE 142. ZF FRIEDRICHSHAFEN AG: PRODUCT PORTFOLIO
    TABLE 143. ZF FRIEDRICHSHAFEN AG: KEY STRATERGIES
  • LIST OF FIGURES

  • FIGURE 01. AUTOMOTIVE FLYWHEEL MARKET, 2022-2032
    FIGURE 02. SEGMENTATION OF AUTOMOTIVE FLYWHEEL MARKET, 2022-2032
    FIGURE 03. TOP INVESTMENT POCKETS IN AUTOMOTIVE FLYWHEEL MARKET (2023-2032)
    FIGURE 04. LOW BARGAINING POWER OF SUPPLIERS
    FIGURE 05. LOW BARGAINING POWER OF BUYERS
    FIGURE 06. LOW THREAT OF SUBSTITUTES
    FIGURE 07. LOW THREAT OF NEW ENTRANTS
    FIGURE 08. LOW INTENSITY OF RIVALRY
    FIGURE 09. DRIVERS, RESTRAINTS AND OPPORTUNITIES: GLOBALAUTOMOTIVE FLYWHEEL MARKET
    FIGURE 10. AUTOMOTIVE FLYWHEEL MARKET, BY TYPE, 2022(%)
    FIGURE 11. COMPARATIVE SHARE ANALYSIS OF AUTOMOTIVE FLYWHEEL MARKET FOR SINGLE MASS, BY COUNTRY 2022 AND 2032(%)
    FIGURE 12. COMPARATIVE SHARE ANALYSIS OF AUTOMOTIVE FLYWHEEL MARKET FOR DUAL MASS, BY COUNTRY 2022 AND 2032(%)
    FIGURE 13. AUTOMOTIVE FLYWHEEL MARKET, BY TRANSMISSION TYPE, 2022(%)
    FIGURE 14. COMPARATIVE SHARE ANALYSIS OF AUTOMOTIVE FLYWHEEL MARKET FOR MANUAL TRANSMISSION, BY COUNTRY 2022 AND 2032(%)
    FIGURE 15. COMPARATIVE SHARE ANALYSIS OF AUTOMOTIVE FLYWHEEL MARKET FOR SEMI-AUTOMATIC AND AUTOMATIC TRANSMISSION, BY COUNTRY 2022 AND 2032(%)
    FIGURE 16. COMPARATIVE SHARE ANALYSIS OF AUTOMOTIVE FLYWHEEL MARKET FOR CONTINUOUSLY VARIABLE TRANSMISSION, BY COUNTRY 2022 AND 2032(%)
    FIGURE 17. AUTOMOTIVE FLYWHEEL MARKET, BY VEHICLE TYPE, 2022(%)
    FIGURE 18. COMPARATIVE SHARE ANALYSIS OF AUTOMOTIVE FLYWHEEL MARKET FOR PASSENGER VEHICLE, BY COUNTRY 2022 AND 2032(%)
    FIGURE 19. COMPARATIVE SHARE ANALYSIS OF AUTOMOTIVE FLYWHEEL MARKET FOR COMMERCIAL VEHICLE, BY COUNTRY 2022 AND 2032(%)
    FIGURE 20. AUTOMOTIVE FLYWHEEL MARKET, BY DISTRIBUTION CHANNEL, 2022(%)
    FIGURE 21. COMPARATIVE SHARE ANALYSIS OF AUTOMOTIVE FLYWHEEL MARKET FOR OEM, BY COUNTRY 2022 AND 2032(%)
    FIGURE 22. COMPARATIVE SHARE ANALYSIS OF AUTOMOTIVE FLYWHEEL MARKET FOR AFTERMARKET, BY COUNTRY 2022 AND 2032(%)
    FIGURE 23. AUTOMOTIVE FLYWHEEL MARKET BY REGION, 2022
    FIGURE 24. U.S. AUTOMOTIVE FLYWHEEL MARKET, 2022-2032 ($MILLION)
    FIGURE 25. CANADA AUTOMOTIVE FLYWHEEL MARKET, 2022-2032 ($MILLION)
    FIGURE 26. MEXICO AUTOMOTIVE FLYWHEEL MARKET, 2022-2032 ($MILLION)
    FIGURE 27. GERMANY AUTOMOTIVE FLYWHEEL MARKET, 2022-2032 ($MILLION)
    FIGURE 28. UK AUTOMOTIVE FLYWHEEL MARKET, 2022-2032 ($MILLION)
    FIGURE 29. FRANCE AUTOMOTIVE FLYWHEEL MARKET, 2022-2032 ($MILLION)
    FIGURE 30. ITALY AUTOMOTIVE FLYWHEEL MARKET, 2022-2032 ($MILLION)
    FIGURE 31. REST OF EUROPE AUTOMOTIVE FLYWHEEL MARKET, 2022-2032 ($MILLION)
    FIGURE 32. CHINA AUTOMOTIVE FLYWHEEL MARKET, 2022-2032 ($MILLION)
    FIGURE 33. JAPAN AUTOMOTIVE FLYWHEEL MARKET, 2022-2032 ($MILLION)
    FIGURE 34. INDIA AUTOMOTIVE FLYWHEEL MARKET, 2022-2032 ($MILLION)
    FIGURE 35. SOUTH KOREA AUTOMOTIVE FLYWHEEL MARKET, 2022-2032 ($MILLION)
    FIGURE 36. REST OF ASIA-PACIFIC AUTOMOTIVE FLYWHEEL MARKET, 2022-2032 ($MILLION)
    FIGURE 37. LATIN AMERICA AUTOMOTIVE FLYWHEEL MARKET, 2022-2032 ($MILLION)
    FIGURE 38. MIDDLE EAST AUTOMOTIVE FLYWHEEL MARKET, 2022-2032 ($MILLION)
    FIGURE 39. AFRICA AUTOMOTIVE FLYWHEEL MARKET, 2022-2032 ($MILLION)
    FIGURE 40. TOP WINNING STRATEGIES, BY YEAR
    FIGURE 41. TOP WINNING STRATEGIES, BY DEVELOPMENT
    FIGURE 42. TOP WINNING STRATEGIES, BY COMPANY
    FIGURE 43. PRODUCT MAPPING OF TOP 10 PLAYERS
    FIGURE 44. COMPETITIVE DASHBOARD
    FIGURE 45. COMPETITIVE HEATMAP: AUTOMOTIVE FLYWHEEL MARKET
    FIGURE 46. TOP PLAYER POSITIONING, 2022
    FIGURE 47. AISIN CORPORATION: NET REVENUE, 2020-2022 ($MILLION)
    FIGURE 48. AISIN CORPORATION: RESEARCH & DEVELOPMENT EXPENDITURE, 2020-2022 ($MILLION)
    FIGURE 49. AISIN CORPORATION: REVENUE SHARE BY SEGMENT, 2022 (%)
    FIGURE 50. AISIN CORPORATION: REVENUE SHARE BY REGION, 2022 (%)
    FIGURE 51. EXEDY GLOBALPARTS CORP: NET SALES, 2020-2022 ($MILLION)
    FIGURE 52. EXEDY GLOBALPARTS CORP: REVENUE SHARE BY SEGMENT, 2022 (%)
    FIGURE 53. EXEDY GLOBALPARTS CORP: REVENUE SHARE BY REGION, 2022 (%)
    FIGURE 54. FORD MOTOR COMPANY: RESEARCH & DEVELOPMENT EXPENDITURE, 2020-2022 ($MILLION)
    FIGURE 55. FORD MOTOR COMPANY: NET SALES, 2020-2022 ($MILLION)
    FIGURE 56. FORD MOTOR COMPANY: REVENUE SHARE BY SEGMENT, 2022 (%)
    FIGURE 57. FORD MOTOR COMPANY: REVENUE SHARE BY REGION, 2022 (%)
    FIGURE 58. SCHAEFFLER TECHNOLOGIES AG & CO. KG: RESEARCH & DEVELOPMENT EXPENDITURE, 2020-2022 ($MILLION)
    FIGURE 59. SCHAEFFLER TECHNOLOGIES AG & CO. KG: NET SALES, 2020-2022 ($MILLION)
    FIGURE 60. SCHAEFFLER TECHNOLOGIES AG & CO. KG: REVENUE SHARE BY REGION, 2022 (%)
    FIGURE 61. SCHAEFFLER TECHNOLOGIES AG & CO. KG: REVENUE SHARE BY SEGMENT, 2022 (%)
    FIGURE 62. VALEO S.A: RESEARCH & DEVELOPMENT EXPENDITURE, 2020-2022 ($MILLION)
    FIGURE 63. VALEO S.A: NET SALES, 2020-2022 ($MILLION)
    FIGURE 64. VALEO S.A: REVENUE SHARE BY SEGMENT, 2022 (%)
    FIGURE 65. VALEO S.A: REVENUE SHARE BY REGION, 2021 (%)
    FIGURE 66. ZF FRIEDRICHSHAFEN AG: NET SALES, 2020-2022 ($MILLION)
    FIGURE 67. ZF FRIEDRICHSHAFEN AG: RESEARCH & DEVELOPMENT EXPENDITURE, 2020-2022 ($MILLION)
    FIGURE 68. ZF FRIEDRICHSHAFEN AG: REVENUE SHARE BY REGION, 2022 (%)
    FIGURE 69. ZF FRIEDRICHSHAFEN AG: REVENUE SHARE BY REGION, 2022 (%)


PURCHASE OPTIONS

Call or Email us

U.S.-Canada Toll-free: +1-800-792-5285
Int'l : +1-503-894-6022
Europe : +44-845-528-1300
Email : help@alliedmarketresearch.com
 
FREQUENTLY ASKED QUESTIONS?

A. The global automotive flywheel market was valued at $7,410.8 million in 2022, and is projected to reach $10,727.2 million by 2032.

A. Growth in penetration of dual-clutch transmission (DCT) & continuous variable transmission (CVT), the development of lightweight vehicle components to enhance fuel efficiency, and an increase in demand for commercial vehicles are the upcoming trends of automotive flywheel market

A. Single Mass flywheel is the leading application of automotive flywheel market

A. Asia-Pacific is the largest regional market for automotive flywheel

A. Some major companies operating in the market include AISIN CORPORATION, EXEDY Globalparts Corp., Ford Motor Company, Pioneer Automotive Industries, Schaeffler Technologies AG & Co. KG, Skyway Precision Inc., SPEC Clutch, Inc., VALEO SERVICE, and ZF Friedrichshafen AG.

Looking for Customization?

 Customization Request

Have a Question?

 Speak with Analyst

Any Confusion?

 Inquire Before Buying

Have a glance of the Report

  Request Sample
RELATED TAGS

Purchase Full Report of
Automotive Flywheel Market

Start reading instantly.
This Report and over 66,905+ more Reports, Available with Avenue Library. T&C*.

  • Online Only
  • $3,570
  • Online cloud access only
  • Restricted print, copy, paste & download
  • Read only
  • Free industry update
    (Within 180 days)
  • Free report update in next update cycle
    (May 2024 - May 2025)
  • Data Pack
  • $3,840
  • Restricted to one authorized user
  • One print only
  • Available in
    Excel
  • Free industry update
    (Within 180 days)
  •   Free report update in next update cycle
    (May 2024 - May 2025)
  • Single User
  • $5,730
  • Restricted to one authorized user
  • One print only
  • Available in
    PDF
  • Free industry update
    (Within 180 days)
  •   Free report update in next update cycle
    (May 2024 - May 2025)
  • Five Users
  • $6,450
  • Limited to five authorized users
  • Print upto five copies
  • Available in
    PDF
  • Free industry update
    (Within 180 days)
  •   Free report update in next update cycle
    (May 2024 - May 2025)
  • Enterprise
    License/PDF

  • $9,600
  • Unlimited
    within
    company/enterprise
  • Available in Excel & PDF
  • Free industry update
    (Within 180 days)
  •   Free report update in next update cycle
    (May 2024 - May 2025)
  • Library
    Membership

  • $999 $ 1,175
    Per User/ Per month/ Billed annually
  • Published Content
    E-access
  • Company Profiles
    E-access
  • Newly Added Content Access
  • 10 PDF
    Downloads
  • 5 Excel Data
    Pack Downloads
  • 250 Company Profiles PDF Downloads
  • Buy Now

*Taxes/Fees, if applicable will be added during checkout. All prices in USD

RELATED REPORTS
 

Why Allied Market Research?


Infallible Methodology

To ensure high-level data integrity, accurate analysis, and impeccable forecasts

Analyst Support

For complete satisfaction

Customization

On-demand customization of scope of the report to exactly meet your needs

TARGETED MARKET VIEW

Targeted market view to provide pertinent information and save time of readers

Get fresh content delivered

Get insights on topics that are crucial for your business. Stay abreast of your interest areas.

Get Industry Data Alerts

Why Allied Market Research?

Infallible Methodology

To ensure high-level data integrity, accurate analysis, and impeccable forecasts

Analyst Support

For complete satisfaction

Customization

On-demand customization of scope of the report to exactly meet your needs

TARGETED MARKET VIEW

Targeted market view to provide pertinent information and save time of readers