0
2019
Automotive Hmi Market

Automotive HMI Market

by Product (Central Display, Instrument Cluster, Head-up Display, and Others) and Technology (Visual Interface, Acoustic, Mechanical, and Others): Global Opportunity Analysis and Industry Forecast, 2018 - 2025

Report Code: A04406
Mar 2019 | Pages: 218
Tables: 71
Charts: 73
  • Formats*:

  • pdf

    Single User License, Five User
    License & Enterprise User License

  • xls

    Data Pack Excel License

  • ppt

    It comes with the additional cost
    of $2500.00 contact sales.


COVID-19

Pandemic disrupted the entire world and affected many industries.

Get detailed COVID-19 impact analysis on the Automotive Hmi Market

Request Now !

Automotive HMI Market Outlook - 2025

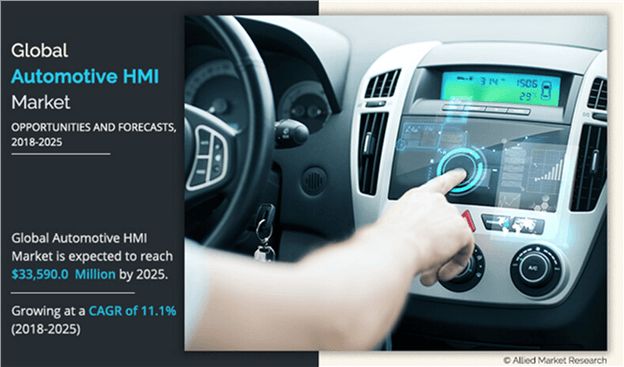
The global automotive HMI market size was valued at $14,807.4 million in 2017, and is projected to reach $33,590.4 million by 2025, registering a CAGR of 11.1% from 2018 to 2025. The central display segment was the highest contributor to the market, with $6,527.1 million in 2017, and is estimated to reach $13,725.6 million by 2025, at a CAGR of 10.0% during the forecast period. In 2017, Asia-Pacific accounted for the highest share in the global automotive HMI market analysis.

The HMI system uses display units as a main component. HMI system is used as a communication medium for information and entertainment. The ADAS systems gather data from various sensors and showcases through display systems. The display systems help the driver in taking measures for better control of the vehicle.

Automotive HMI Market Overview

The increase in number of displays and communication modes in human vehicles are a major source of distraction for drivers with multifunctional switches, entertainment media, internet streaming, voice controls, and others. Sometimes way too much information or entertainment distracts the driver and reduces the concentration of the driver. ADAS and HMI may create complexity for drivers who are in transition and are adopting HMI displays, in-steering controls, and central displays. A study by the University of Toronto states that HUDs are increasing distraction rather than increasing and assisting the driver toward safe driving, which limits their adoption.

Increase in adoption of better interior for vehicles, rise in concern of consumer toward safety & security features, are the main factors that boost the growth of the automotive HMI market. In addition, growth in production and sales of vehicles in developing countries of Asia-Pacific is also influencing the automotive HMI market growth. The growth of the automotive HMI market share directly depends on the advancement of infotainment and communication systems.

The global automotive HMI market is segmented based on product, technology, and region. Based on product type, the market is segmented into central display, instrument cluster, head-up display, and others. In 2017, central display segment dominated the market, in terms of revenue, and is expected to maintain this trend in the coming years. On the basis of technology, the market is categorized into visual interface, acoustic, mechanical, and others. Visual interface is expected to secure the highest share during the forecast period.

Automotive HMI Market Regional Analysis

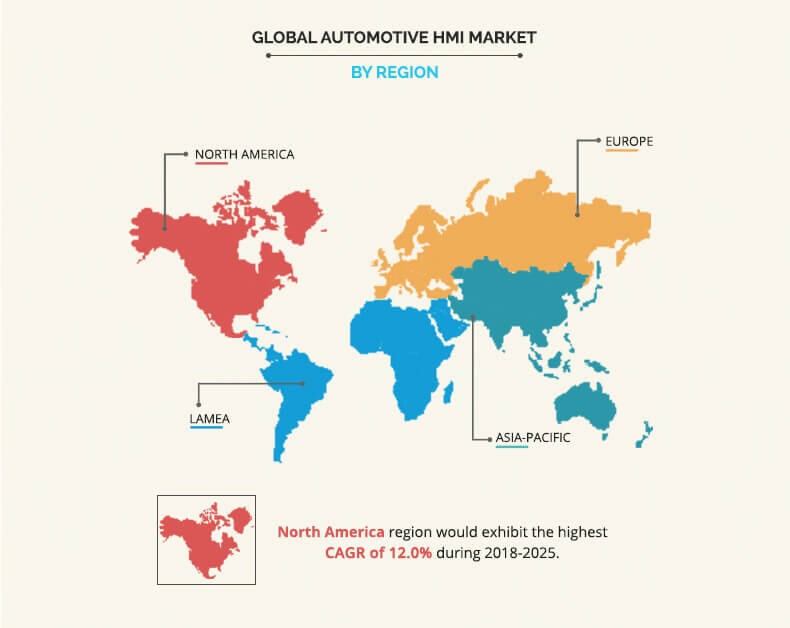
Based on region, the market is analyzed across North America, Europe, Asia-Pacific, and LAMEA. In 2017, Asia-Pacific accounted for the highest share in the automotive HMI market and is anticipated to secure the leading position during the forecast period.

The North American automotive HMI market is expected to grow at a considerable rate during the forecast period, owing to rise in need to enhance the communication channels of drivers and passengers with the vehicle. Moreover, Increase in deployment of smart technologies, and advent & integration of IoT & information, communication, & technology particularly into automobiles are the factors responsible for the growth of the North America automotive HMI market. In addition, increase in demand for enhanced infotainment systems is the major growth factor of the market. Moreover, rise in investment in emerging areas of in-vehicle entertainment systems is expected to provide lucrative opportunities for the automotive HMI market. By product, instrument cluster is expected to be the largest segment for automotive HMI market. In recent years, several modifications have been witnessed in the instrument cluster system from various OEMs and OEM suppliers. New instrument clusters introduced in the market have optimized display of information and well-structured display as well as vibrant color. For instance, Continental focuses on different illumination concepts and pointer types such as encapsulated ring pointer, disc pointer, 3D pointer, and stepper motor with precise & smooth movement.

Automotive HMI Market Top Impacting Factors

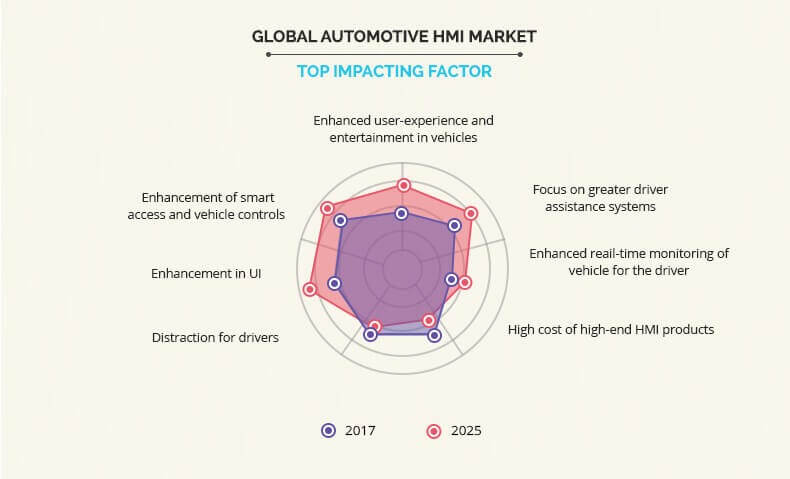
Enhanced User Experience and Entertainment In Vehicles

All vehicle OEMs are focusing on enhanced capabilities on visibility and display of information for the driver. With rear seat entertainment, the overall entertainment facilities in vehicles are enhanced. With better connectivity and internet speed, HMI vendors are offering best-in class experience for drivers and passengers with mobile features, voice recognition and controls. The interactivity and communication of vehicles and humans have increased tremendously in the past few years. Moreover, consumer interest to connect multiple electronic devices in a vehicle are fueling OEMs to provide more features that allow connectivity to various electronic devices. For example, HARMAN can offer HMI with designs either from OEMs, tier-1 suppliers or HARMAN itself for instrument cluster system, complex 3D scenes development and multiscreen HMI solutions. All these elements help in providing relevant information helping the driver to focus on roads.

Focus on Greater Driver Assistance Systems

With increase in adoption of connected and autonomous vehicles, the automotive HMI industry is expected to witness greater emphasis on various ADAS and automotive HMI market segmentation to satisfy the vehicle customers as per automotive HMI market forecast. With the help of head-up display (HUD), the driver gets assistance in finding the road lines, thus helping in fog and rainfall. While designing the ADAS, the HMI visualization is an important criteria , as HMI and ADAS are expected to jointly enhance the capabilities of autonomous driving. ADAS communicates information to driver and HMI provides the interface for the communication between humans and vehicle. the ADAS transmits data or video collected by sensors through HMI display or an alert system detecting road condition or call for attention when there is a probability of collision and immediate collision avoidance operation is required. It is important for HMI developers to provide most reasonable and easy to access communication mode and UI for the driver to respond quickly.

Increase in Automotive Sales Across the Globe

The automotive environment is changing at a rapid pace due to globalization. The increase in automotive sales has been caused due to the improvement in manufacturing facilities in most of the emerging countries such as China, India, and Brazil. Global automotive sector promises better productivity and sales as this sector consists of different segments such as passenger car and commercial vehicles, which in turn drives excellent profitability. This factor majorly influences prominent players of automotive sector to invest and expand the business through different segments to gain better profitability. Also, increase in disposable income of consumers and surge in car sale across the globe fuel the rise in sale of automotive vehicle. Developing countries such as India, China, and Brazil, are the most promising countries for the automotive sector. China, being the world’s largest market for vehicles, is expected to grow further over the next few years as most OEMs are also making large investments in this sector. Along with China, the U.S. automotive HMI market is also anticipated to grow in the near future.

High Cost

High cost of advanced HMI systems pre-installed in vehicles are restricting the adoption of HMI among cost-sensitive consumers. The cost of the display and touchscreens make HMI costlier than the earlier used analog instrument clusters. Moreover, many vehicle OEMs are focusing on integrated central displays eliminating the instrument clusters behind steering. The manufacturing cost of primary display systems that provides an integrated view of car components and also a medium for ADAS visualization for safer driving. The head-up display (HUDs) are high-cost HMI products but is expected to grow substantially during the forecast period. The increasing adoption of ADAS and safety features are expected to fuel the growth momentum of HMI market. However, the high cost of rear-seat entertainment and HUDs are restricting the growth of automotive HMI market.

Rise in Demand for Autonomous Vehicles

In recent years, consumers have shifted their interest to automotive vehicles, as these vehicles do not consume any kind of fuel such as petrol, diesel, or gasoline and are technologically advanced as against traditional vehicles and cost low amount of maintenance, and thereby reduce the customer’s expense. With increasing adoption of autonomous vehicles, the emphasis on connected vehicles and infotainment for drivers and passengers have increased. Moreover, the information related to safe driving and surround view of the vehicles are being focused for the OEMs. Most OEMS are looking to leverage the HMI systems to enhance the interiors of the vehicles as well. The evolution of display systems are expected to impact the automotive HMI market trends. Such rise in the sales of the autonomous vehicles due to their advanced features is expected to create numerous automotive HMI market opportunity.

Key players operating in the global automotive HMI market are Continental AG, Robert Bosch GmbH, Panasonic Corporation, Visteon Corporation, Alpine Electronics, Inc., Clarion Co. Ltd., Nuance Communications, Inc., Samsung Electronics Co. Ltd. (Harman International Industries, Inc.), Nuance Communications, Inc., and Valeo.

Key Benefits For Automotive HMI Market:

  • This study presents analytical depiction of the automotive HMI market analysis along with the current trends and future estimations to depict the imminent investment pockets.
  • The overall automotive HMI market potential is determined to understand the profitable trends to gain a stronger foothold.
  • The report presents information related to the key drivers, restraints, and opportunities of the market with a detailed impact analysis.
  • The current automotive HMI market is quantitatively analyzed from 2017 to 2025 to benchmark the financial competency.
  • Porter’s five forces analysis illustrates the potency of the buyers and suppliers in the industry.

Automotive HMI Market Report Highlights

Aspects Details
By PRODUCT
  • Instrument Cluster
  • Central Display
  • Head-up Display
  • Others
By TECHNOLOGY
  • Visual Interface
  • Acoustic
  • Mechanical
  • Others
By Region
  • North America  (U.S, Canada, Mexico)
  • Europe  (UK, Germany, France, Italy, Rest of Europe)
  • Asia-Pacific  (China, Japan, India, South Korea, Rest of Asia-Pacific)
  • LAMEA  (Latin America, Middle East, Africa)
Key Market Players CONTINENTAL AG, NUANCE COMMUNICATIONS, INC, VISTEON CORPORATION, VALEO, ROBERT BOSCH GMBH, ALPINE ELECTRONICS, INC, CLARION CO., LTD, SAMSUNG ELECTRONICS CO. LTD. (HARMAN INTERNATIONAL INDUSTRIES, INC.), DENSO CORPORATION, PANASONIC CORPORATION
 

CHAPTER 1:INTRODUCTION

1.1.REPORT DESCRIPTION
1.2.KEY BENEFITS FOR STAKEHOLDERS
1.3.KEY MARKET SEGMENTS
1.4.RESEARCH METHODOLOGY

1.4.1.PRIMARY RESEARCH
1.4.2.SECONDARY RESEARCH
1.4.3.ANALYST TOOLS AND MODELS

CHAPTER 2:EXECUTIVE SUMMARY

2.1.CXO PERSPECTIVE

CHAPTER 3:MARKET OVERVIEW

3.1.MARKET DEFINITION AND SCOPE
3.2.KEY FINDINGS

3.2.1.TOP IMPACTING FACTORS
3.2.2.TOP INVESTMENT POCKETS
3.2.3.TOP WINNING STRATEGIES

3.3.PORTER’S FIVE FORCES ANALYSIS
3.4.MARKET SHARE ANALYSIS, 2017
3.5.MARKET DYNAMICS

3.5.1.DRIVERS

3.5.1.1.ENHANCED USER EXPERIENCE AND ENTERTAINMENT IN VEHICLES
3.5.1.2.FOCUS ON GREATER DRIVER ASSISTANCE SYSTEMS
3.5.1.3.ENHANCED REAL-TIME MONITORING OF VEHICLE FOR THE DRIVER

3.5.2.RESTRAINTS

3.5.2.1.HIGH COST OF HIGH-END HMI PRODUCTS
3.5.2.2.DISTRACTION FOR DRIVERS

3.5.3.OPPORTUNITIES

3.5.3.1.ENHANCEMENT IN UI
3.5.3.2.ENHANCEMENT OF SMART ACCESS AND VEHICLE CONTROLS

CHAPTER 4:AUTOMOTIVE HMI MARKET, BY PRODUCT

4.1.OVERVIEW
4.2.INSTRUMENT CLUSTER

4.2.1.KEY MARKET TRENDS, GROWTH FACTORS, AND OPPORTUNITIES
4.2.2.MARKET SIZE AND FORECAST, BY REGION
4.2.3.MARKET ANALYSIS, BY COUNTRY

4.3.CENTRAL DISPLAY

4.3.1.KEY MARKET TRENDS, GROWTH FACTORS, AND OPPORTUNITIES
4.3.2.MARKET SIZE AND FORECAST, BY REGION
4.3.3.MARKET ANALYSIS, BY COUNTRY

4.4.HEAD-UP DISPLAY

4.4.1.KEY MARKET TRENDS, GROWTH FACTORS, AND OPPORTUNITIES
4.4.2.MARKET SIZE AND FORECAST, BY REGION
4.4.3.MARKET ANALYSIS, BY COUNTRY

4.5.OTHERS

4.5.1.KEY MARKET TRENDS, GROWTH FACTORS, AND OPPORTUNITIES
4.5.2.MARKET SIZE AND FORECAST, BY REGION
4.5.3.MARKET ANALYSIS, BY COUNTRY

CHAPTER 5:AUTOMOTIVE HMI MARKET, BY TECHNOLOGY

5.1.OVERVIEW
5.2.VISUAL INTERFACE

5.2.1.KEY MARKET TRENDS, GROWTH FACTORS, AND OPPORTUNITIES
5.2.2.MARKET SIZE AND FORECAST, BY REGION
5.2.3.MARKET ANALYSIS, BY COUNTRY

5.3.ACOUSTIC

5.3.1.KEY MARKET TRENDS, GROWTH FACTORS, AND OPPORTUNITIES
5.3.2.MARKET SIZE AND FORECAST, BY REGION
5.3.3.MARKET ANALYSIS, BY COUNTRY

5.4.MECHANICAL

5.4.1.KEY MARKET TRENDS, GROWTH FACTORS, AND OPPORTUNITIES
5.4.2.MARKET SIZE AND FORECAST, BY REGION
5.4.3.MARKET ANALYSIS, BY COUNTRY

5.5.OTHERS

5.5.1.KEY MARKET TRENDS, GROWTH FACTORS, AND OPPORTUNITIES
5.5.2.MARKET SIZE AND FORECAST, BY REGION
5.5.3.MARKET ANALYSIS, BY COUNTRY

CHAPTER 6:AUTOMOTIVE HMI MARKET, BY REGION

6.1.OVERVIEW
6.2.NORTH AMERICA

6.2.1.KEY MARKET TRENDS, GROWTH FACTORS, AND OPPORTUNITIES
6.2.2.MARKET SIZE AND FORECAST, BY MODE OF TRANSPORTATION
6.2.3.MARKET SIZE AND FORECAST, BY APPLICATION
6.2.4.MARKET ANALYSIS, BY COUNTRY

6.2.4.1.U.S.

6.2.4.1.1.MARKET SIZE AND FORECAST, BY MODE OF TRANSPORTATION
6.2.4.1.2.MARKET SIZE AND FORECAST, BY APPLICATION

6.2.4.2.CANADA

6.2.4.2.1.MARKET SIZE AND FORECAST, BY MODE OF TRANSPORTATION
6.2.4.2.2.MARKET SIZE AND FORECAST, BY APPLICATION

6.2.4.3.MEXICO

6.2.4.3.1.MARKET SIZE AND FORECAST, BY MODE OF TRANSPORTATION
6.2.4.3.2.MARKET SIZE AND FORECAST, BY APPLICATION

6.3.EUROPE

6.3.1.KEY MARKET TRENDS, GROWTH FACTORS, AND OPPORTUNITIES
6.3.2.MARKET SIZE AND FORECAST, BY MODE OF TRANSPORTATION
6.3.3.MARKET SIZE AND FORECAST, BY APPLICATION
6.3.4.MARKET ANALYSIS, BY COUNTRY

6.3.4.1.UK

6.3.4.1.1.MARKET SIZE AND FORECAST, BY MODE OF TRANSPORTATION
6.3.4.1.2.MARKET SIZE AND FORECAST, BY APPLICATION

6.3.4.2.GERMANY

6.3.4.2.1.MARKET SIZE AND FORECAST, BY MODE OF TRANSPORTATION
6.3.4.2.2.MARKET SIZE AND FORECAST, BY APPLICATION

6.3.4.3.FRANCE

6.3.4.3.1.MARKET SIZE AND FORECAST, BY MODE OF TRANSPORTATION
6.3.4.3.2.MARKET SIZE AND FORECAST, BY APPLICATION

6.3.4.4.ITALY

6.3.4.4.1.MARKET SIZE AND FORECAST, BY MODE OF TRANSPORTATION
6.3.4.4.2.MARKET SIZE AND FORECAST, BY APPLICATION

6.3.4.5.REST OF EUROPE

6.3.4.5.1.MARKET SIZE AND FORECAST, BY MODE OF TRANSPORTATION
6.3.4.5.2.MARKET SIZE AND FORECAST, BY APPLICATION

6.4.ASIA-PACIFIC

6.4.1.KEY MARKET TRENDS, GROWTH FACTORS, AND OPPORTUNITIES
6.4.2.MARKET SIZE AND FORECAST, BY MODE OF TRANSPORTATION
6.4.3.MARKET SIZE AND FORECAST, BY APPLICATION
6.4.4.MARKET ANALYSIS, BY COUNTRY

6.4.4.1.CHINA

6.4.4.1.1.MARKET SIZE AND FORECAST, BY MODE OF TRANSPORTATION
6.4.4.1.2.MARKET SIZE AND FORECAST, BY APPLICATION

6.4.4.2.JAPAN

6.4.4.2.1.MARKET SIZE AND FORECAST, BY MODE OF TRANSPORTATION
6.4.4.2.2.MARKET SIZE AND FORECAST, BY APPLICATION

6.4.4.3.INDIA

6.4.4.3.1.MARKET SIZE AND FORECAST, BY MODE OF TRANSPORTATION
6.4.4.3.2.MARKET SIZE AND FORECAST, BY APPLICATION

6.4.4.4.SOUTH KOREA

6.4.4.4.1.MARKET SIZE AND FORECAST, BY MODE OF TRANSPORTATION
6.4.4.4.2.MARKET SIZE AND FORECAST, BY APPLICATION

6.4.4.5.REST OF ASIA-PACIFIC

6.4.4.5.1.MARKET SIZE AND FORECAST, BY MODE OF TRANSPORTATION
6.4.4.5.2.MARKET SIZE AND FORECAST, BY APPLICATION

6.5.LAMEA

6.5.1.KEY MARKET TRENDS, GROWTH FACTORS, AND OPPORTUNITIES
6.5.2.MARKET SIZE AND FORECAST, BY MODE OF TRANSPORTATION
6.5.3.MARKET SIZE AND FORECAST, BY APPLICATION
6.5.4.MARKET ANALYSIS, BY COUNTRY

6.5.4.1.LATIN AMERICA

6.5.4.1.1.MARKET SIZE AND FORECAST, BY MODE OF TRANSPORTATION
6.5.4.1.2.MARKET SIZE AND FORECAST, BY APPLICATION

6.5.4.2.MIDDLE EAST

6.5.4.2.1.MARKET SIZE AND FORECAST, BY MODE OF TRANSPORTATION
6.5.4.2.2.MARKET SIZE AND FORECAST, BY APPLICATION

6.5.4.3.AFRICA

6.5.4.3.1.MARKET SIZE AND FORECAST, BY MODE OF TRANSPORTATION
6.5.4.3.2.MARKET SIZE AND FORECAST, BY APPLICATION

CHAPTER 7:COMPANY PROFILES

7.1.1.ALPINE ELECTRONICS, INC.

7.1.1.1.COMPANY OVERVIEW
7.1.1.2.COMPANY SNAPSHOT
7.1.1.3.OPERATING BUSINESS SEGMENTS
7.1.1.4.PRODUCT PORTFOLIO
7.1.1.5.BUSINESS PERFORMANCE
7.1.1.6.KEY STRATEGIC MOVES AND DEVELOPMENTS

7.1.2.CLARION CO., LTD.

7.1.2.1.COMPANY OVERVIEW
7.1.2.2.COMPANY SNAPSHOT
7.1.2.3.OPERATING BUSINESS SEGMENTS
7.1.2.4.PRODUCT PORTFOLIO
7.1.2.5.BUSINESS PERFORMANCE
7.1.2.6.KEY STRATEGIC MOVES AND DEVELOPMENTS

7.1.3.CONTINENTAL AG

7.1.3.1.COMPANY OVERVIEW
7.1.3.2.COMPANY SNAPSHOT
7.1.3.3.OPERATING BUSINESS SEGMENTS
7.1.3.4.PRODUCT PORTFOLIO
7.1.3.5.BUSINESS PERFORMANCE
7.1.3.6.KEY STRATEGIC MOVES AND DEVELOPMENTS

7.1.4.DENSO CORPORATION

7.1.4.1.COMPANY OVERVIEW
7.1.4.2.COMPANY SNAPSHOT
7.1.4.3.OPERATING BUSINESS SEGMENTS
7.1.4.4.PRODUCT PORTFOLIO
7.1.4.5.BUSINESS PERFORMANCE
7.1.4.6.KEY STRATEGIC MOVES AND DEVELOPMENTS

7.1.5.NUANCE COMMUNICATIONS, INC.

7.1.5.1.COMPANY OVERVIEW
7.1.5.2.COMPANY SNAPSHOT
7.1.5.3.OPERATING BUSINESS SEGMENTS
7.1.5.4.PRODUCT PORTFOLIO
7.1.5.5.BUSINESS PERFORMANCE
7.1.5.6.KEY STRATEGIC MOVES AND DEVELOPMENTS

7.1.6.PANASONIC CORPORATION

7.1.6.1.COMPANY OVERVIEW
7.1.6.2.COMPANY SNAPSHOT
7.1.6.3.PRODUCT PORTFOLIO
7.1.6.4.BUSINESS PERFORMANCE
7.1.6.5.KEY STRATEGIC MOVES AND DEVELOPMENTS

7.1.7.ROBERT BOSCH GMBH

7.1.7.1.COMPANY OVERVIEW
7.1.7.2.COMPANY SNAPSHOT
7.1.7.3.OPERATING BUSINESS SEGMENTS
7.1.7.4.PRODUCT PORTFOLIO
7.1.7.5.BUSINESS PERFORMANCE
7.1.7.6.KEY STRATEGIC MOVES AND DEVELOPMENTS

7.1.8.SAMSUNG ELECTRONICS CO. LTD. (HARMAN INTERNATIONAL INDUSTRIES, INC.)

7.1.8.1.COMPANY OVERVIEW
7.1.8.2.COMPANY SNAPSHOT
7.1.8.3.OPERATING BUSINESS SEGMENTS
7.1.8.4.PRODUCT PORTFOLIO
7.1.8.5.BUSINESS PERFORMANCE
7.1.8.6.KEY STRATEGIC MOVES AND DEVELOPMENTS

7.1.9.VALEO

7.1.9.1.COMPANY OVERVIEW
7.1.9.2.COMPANY SNAPSHOT
7.1.9.3.OPERATING BUSINESS SEGMENTS
7.1.9.4.PRODUCT PORTFOLIO
7.1.9.5.BUSINESS PERFORMANCE
7.1.9.6.KEY STRATEGIC MOVES AND DEVELOPMENTS

7.1.10.VISTEON CORPORATION

7.1.10.1.COMPANY OVERVIEW
7.1.10.2.COMPANY SNAPSHOT
7.1.10.3.OPERATING BUSINESS SEGMENTS
7.1.10.4.PRODUCT PORTFOLIO
7.1.10.5.BUSINESS PERFORMANCE
7.1.10.6.KEY STRATEGIC MOVES AND DEVELOPMENTS

LIST OF TABLES

TABLE 01.GLOBAL AUTOMOTIVE HMI MARKET, BY PRODUCTS, 2017–2025 ($MILLION)
TABLE 02.AUTOMOTIVE HMI MARKET REVENUE FOR INSTRUMENT CLUSTER, BY REGION, 2017–2025 ($MILLION)
TABLE 03.AUTOMOTIVE HMI MARKET REVENUE FOR CENTRAL DISPLAY, BY REGION, 2017–2025 ($MILLION)
TABLE 04.AUTOMOTIVE HMI MARKET REVENUE FOR HEAD-UP DISPLAYS, BY REGION,  2017–2025 ($MILLION)
TABLE 05.AUTOMOTIVE HMI MARKET REVENUE FOR OTHERS, BY REGION, 2017–2025 ($MILLION)
TABLE 06.GLOBAL AUTOMOTIVE HMI MARKET, BY TECHNOLOGY, 2017–2025 ($MILLION)
TABLE 07.AUTOMOTIVE HMI MARKET REVENUE BY VISUAL INTERFACE, BY REGION, 2017–2025 ($MILLION)
TABLE 08.AUTOMOTIVE HMI MARKET REVENUE BY ACOUSTIC, BY REGION, 2017–2025 ($MILLION)
TABLE 09.AUTOMOTIVE HMI MARKET REVENUE BY MECHANICAL, BY REGION, 2017–2025 ($MILLION)
TABLE 10.AUTOMOTIVE HMI MARKET REVENUE BY OTHERS, BY REGION, 2017–2025 ($MILLION)
TABLE 11.NORTH AMERICAN AUTOMOTIVE HMI MARKET, BY PRODUCT, 2017–2025 ($MILLION)
TABLE 12.NORTH AMERICAN AUTOMOTIVE HMI MARKET, BY TECHNOLOGY, 2017–2025 ($MILLION)
TABLE 13.U. S. AUTOMOTIVE HMI MARKET, BY PRODUCT, 2017–2025 ($MILLION)
TABLE 14.U. S. AUTOMOTIVE HMI, BY TECHNOLOGY, 2017–2025 ($MILLION)
TABLE 15.CANADA AUTOMOTIVE HMI MARKET, BY PRODUCT, 2017–2025 ($MILLION)
TABLE 16.CANADA AUTOMOTIVE HMI MARKET, BY TECHNOLOGY, 2017–2025 ($MILLION)
TABLE 17.MEXICO AUTOMOTIVE HMI MARKET, BY PRODUCT, 2017–2025 ($MILLION)
TABLE 18.MEXICO AUTOMOTIVE HMI MARKET, BY TECHNOLOGY, 2017–2025 ($MILLION)
TABLE 19.EUROPEAN AUTOMOTIVE HMI  MARKET, BY PRODUCT, 2017–2025 ($MILLION)
TABLE 20.EUROPEAN AUTOMOTIVE HMI  MARKET, BY TECHNOLOGY, 2017–2025 ($MILLION)
TABLE 21.U.K. AUTOMOTIVE HMI MARKET, BY PRODUCT, 2017–2025 ($MILLION)
TABLE 22.U.K. AUTOMOTIVE HMI MARKET, BY TECHNOLOGY, 2017–2025 ($MILLION)
TABLE 23.GERMANY AUTOMOTIVE HMI MARKET, BY PRODUCT, 2017–2025 ($MILLION)
TABLE 24.GERMANY AUTOMOTIVE HMI MARKET, BY TECHNOLOGY, 2017–2025 ($MILLION)
TABLE 25.FRANCE AUTOMOTIVE HMI MARKET, BY PRODUCT, 2017–2025 ($MILLION)
TABLE 26.FRANCE AUTOMOTIVE HMI MARKET, BY TECHNOLOGY, 2017–2025 ($MILLION)
TABLE 27.ITALY AUTOMOTIVE HMI MARKET, BY PRODUCT, 2017–2025 ($MILLION)
TABLE 28.ITALY AUTOMOTIVE HMI MARKET, BY TECHNOLOGY, 2017–2025 ($MILLION)
TABLE 29.REST OF EUROPE AUTOMOTIVE HMI MARKET, BY PRODUCT, 2017–2025 ($MILLION)
TABLE 30.REST OF EUROPE AUTOMOTIVE HMI MARKET, BY TECHNOLOGY, 2017–2025 ($MILLION)
TABLE 31.ASIA-PACIFIC AUTOMOTIVE HMI MARKET, BY PRODUCT, 2017–2025 ($MILLION)
TABLE 32.ASIA-PACIFIC AUTOMOTIVE HMI MARKET, BY TECHNOLOGY, 2017–2025 ($MILLION)
TABLE 33.CHINA AUTOMOTIVE HMI MARKET, BY PRODUCT, 2017–2025 ($MILLION)
TABLE 34.CHINA AUTOMOTIVE HMI MARKET, BY TECHNOLOGY, 2017–2025 ($MILLION)
TABLE 35.JAPAN AUTOMOTIVE HMI MARKET, BY PRODUCT, 2017–2025 ($MILLION)
TABLE 36.JAPAN AUTOMOTIVE HMI MARKET, BY TECHNOLOGY, 2017–2025 ($MILLION)
TABLE 37.INDIA AUTOMOTIVE HMI MARKET, BY PRODUCT, 2017–2025 ($MILLION)
TABLE 38.INDIA AUTOMOTIVE HMI MARKET, BY TECHNOLOGY, 2017–2025 ($MILLION)
TABLE 39.SOUTH KOREA AUTOMOTIVE HMI MARKET, BY PRODUCT, 2017–2025 ($MILLION)
TABLE 40.SOUTH KOREA AUTOMOTIVE HMI MARKET, BY TECHNOLOGY, 2017–2025 ($MILLION)
TABLE 41.REST OF ASIA-PACIFIC AUTOMOTIVE HMI MARKET, BY PRODUCT, 2017–2025 ($MILLION)
TABLE 42.REST OF ASIA-PACIFIC AUTOMOTIVE HMI MARKET, BY TECHNOLOGY, 2017–2025 ($MILLION)
TABLE 43.LAMEA AUTOMOTIVE HMI MARKET, BY PRODUCT, 2017–2025 ($MILLION)
TABLE 44.LAMEA AUTOMOTIVE HMI MARKET, BY TECHNOLOGY, 2017–2025 ($MILLION)
TABLE 45.LATIN AMERICA AUTOMOTIVE HMI MARKET, BY PRODUCT, 2017–2025 ($MILLION)
TABLE 46.LATIN AMERICA AUTOMOTIVE HMI MARKET, BY TECHNOLOGY, 2017–2025 ($MILLION)
TABLE 47.MIDDLE EAST AUTOMOTIVE HMI MARKET, BY PRODUCT, 2017–2025 ($MILLION)
TABLE 48.MIDDLE EAST AUTOMOTIVE HMI MARKET, BY TECHNOLOGY, 2017–2025 ($MILLION)
TABLE 49.AFRICA AUTOMOTIVE HMI MARKET, BY PRODUCT, 2017–2025 ($MILLION)
TABLE 50.AFRICA AUTOMOTIVE HMI MARKET, BY TECHNOLOGY, 2017–2025 ($MILLION)
TABLE 51.ALPINE ELECTRONICS, INC.: COMPANY SNAPSHOT
TABLE 52.ALPINE ELECTRONICS, INC.: OPERATING SEGMENTS
TABLE 53.ALPINE ELECTRONICS, INC.: PRODUCT PORTFOLIO
TABLE 54.ALPINE ELECTRONICS, INC.: KEY STRATEGIC MOVES AND DEVELOPMENTS
TABLE 55.CLARION CO. LTD.: COMPANY SNAPSHOT
TABLE 56.CLARION: OPERATING SEGMENTS
TABLE 57.CLARION: PRODUCT PORTFOLIO
TABLE 58.CLARION: KEY STRATEGIC MOVES AND DEVELOPMENTS
TABLE 59.CONTINENTAL AG.: COMPANY SNAPSHOT
TABLE 60.CONTINENTAL AG: OPERATING SEGMENTS
TABLE 61.CONTINENTAL AG: PRODUCT PORTFOLIO
TABLE 62.CONTINENTAL AG: KEY STRATEGIC MOVES AND DEVELOPMENTS
TABLE 63.DENSO CORPORATION: COMPANY SNAPSHOT
TABLE 64.DENSO CORPORATION: OPERATING SEGMENTS
TABLE 65.DENSO CORPORATION: PRODUCT PORTFOLIO
TABLE 66.DENSO: KEY STRATEGIC MOVES AND DEVELOPMENTS
TABLE 67.NUANCE COMMUNICATIONS, INC.: COMPANY SNAPSHOT
TABLE 68.NUANCE COMMUNICATIONS: OPERATING SEGMENTS
TABLE 69.NUANCE COMMUNICATIONS: PRODUCT PORTFOLIO
TABLE 70.NUANCE COMMUNICATIONS: KEY STRATEGIC MOVES AND DEVELOPMENTS
TABLE 71.PANASONIC CORPORATION: COMPANY SNAPSHOT
TABLE 72.PANASONIC CORPORATION: PRODUCT PORTFOLIO
TABLE 73.PANASONIC: KEY STRATEGIC MOVES AND DEVELOPMENTS
TABLE 74.ROBERT BOSCH GMBH: COMPANY SNAPSHOT
TABLE 75.ROBERT BOSCH GMBH: OPERATING SEGMENTS
TABLE 76.ROBERT BOSCH GMBH: PRODUCT PORTFOLIO
TABLE 77.ROBERT BOSCH GMBH: REVENUE, 2015–2017 ($MILLION)
TABLE 78.ROBERT BOSCH: KEY STRATEGIC MOVES AND DEVELOPMENTS
TABLE 79.SAMSUNG ELECTRONICS CO. LTD.: COMPANY SNAPSHOT
TABLE 80.SAMSUNG ELECTRONICS CO. LTD.: OPERATING SEGMENTS
TABLE 81.VALEO: PRODUCT PORTFOLIO
TABLE 82.HARMAN: KEY STRATEGIC MOVES AND DEVELOPMENTS
TABLE 83.VALEO: COMPANY SNAPSHOT
TABLE 84.VALEO: OPERATING SEGMENTS
TABLE 85.VALEO: PRODUCT PORTFOLIO
TABLE 86.VALEO: KEY STRATEGIC MOVES AND DEVELOPMENTS
TABLE 87.VISTEON CORPORATION: COMPANY SNAPSHOT
TABLE 88.VISTEON CORPORATION: OPERATING SEGMENTS
TABLE 89.VISTEON CORPORATION: PRODUCT PORTFOLIO
TABLE 90.VISTEON: KEY STRATEGIC MOVES AND DEVELOPMENTS

LIST OF FIGURES

FIGURE 01.KEY MARKET SEGMENTS
FIGURE 02.EXECUTIVE SUMMARY
FIGURE 03.EXECUTIVE SUMMARY
FIGURE 04.TOP IMPACTING FACTORS
FIGURE 05.TOP INVESTMENT POCKETS
FIGURE 06.TOP WINNING STRATEGIES, BY YEAR, 2016–2019*
FIGURE 07.TOP WINNING STRATEGIES, BY YEAR, 2016–2019*
FIGURE 08.TOP WINNING STRATEGIES, BY COMPANY, 2015–2019*
FIGURE 09.MODERATE-TO-MODERATE BARGAINING POWER OF SUPPLIERS
FIGURE 10.HIGH-TO-MODERATE THREAT OF NEW ENTRANTS
FIGURE 11.MODERATE-TO-MODERATE THREAT OF SUBSTITUTES
FIGURE 12.HIGH-TO-MODERATE INTENSITY OF RIVALRY
FIGURE 13.MODERATE-TO-MODERATE BARGAINING POWER OF BUYERS
FIGURE 14.MARKET SHARE ANALYSIS, 2017
FIGURE 15.GLOBAL AUTOMOTIVE HMI MARKET SHARE, BY PRODUCTS, 2017–2025 (%)
FIGURE 16.COMPARATIVE SHARE ANALYSIS OF AUTOMOTIVE HMI MARKET FOR INSTRUMENT CLUSTER, BY COUNTRY, 2017 & 2025 (%)
FIGURE 17.COMPARATIVE SHARE ANALYSIS OF AUTOMOTIVE HMI MARKET FOR CENTRAL DISPLAY, BY COUNTRY, 2017 & 2025 (%)
FIGURE 18.COMPARATIVE SHARE ANALYSIS OF AUTOMOTIVE HMI MARKET FOR HEAD-UP DISPLAYS, BY COUNTRY, 2017 & 2025 (%)
FIGURE 19.COMPARATIVE SHARE ANALYSIS OF AUTOMOTIVE HMI MARKET FOR OTHERS, BY COUNTRY, 2017 & 2025 (%)
FIGURE 20.GLOBAL AUTOMOTIVE HMI MARKET SHARE, BY TECHNOLOGY, 2017–2025 (%)
FIGURE 21.COMPARATIVE SHARE ANALYSIS OF AUTOMOTIVE HMI MARKET BY VISUAL INTERFACE, BY COUNTRY, 2017 & 2025 (%)
FIGURE 22.COMPARATIVE SHARE ANALYSIS OF AUTOMOTIVE HMI MARKET BY ACOUSTIC, BY COUNTRY, 2017 & 2025 (%)
FIGURE 23.COMPARATIVE SHARE ANALYSIS OF AUTOMOTIVE HMI MARKET BY MECHANICAL, BY COUNTRY, 2017 & 2025 (%)
FIGURE 24.COMPARATIVE SHARE ANALYSIS OF AUTOMOTIVE HMI MARKET FOR OTHERS, BY COUNTRY, 2017 & 2025 (%)
FIGURE 25.AUTOMOTIVE HMI MARKET, BY REGION, 2017–2025 (%)
FIGURE 26.COMPARATIVE SHARE ANALYSIS OF AUTOMOTIVE HMI MARKET, BY COUNTRY, 2017–2025 (%)
FIGURE 27.U. S. AUTOMOTIVE HMI MARKET, 2017–2025 ($MILLION)
FIGURE 28.CANADA AUTOMOTIVE HMI MARKET, 2017–2025 ($MILLION)
FIGURE 29.MEXICO AUTOMOTIVE HMI MARKET, 2017–2025 ($MILLION)
FIGURE 30.COMPARATIVE SHARE ANALYSIS OF AUTOMOTIVE HMI MARKET, BY COUNTRY, 2017–2025 (%)
FIGURE 31.U.K. AUTOMOTIVE HMI MARKET, 2017–2025 ($MILLION)
FIGURE 32.GERMANY AUTOMOTIVE HMI MARKET, 2017–2025 ($MILLION)
FIGURE 33.FRANCE AUTOMOTIVE HMI MARKET, 2017–2025 ($MILLION)
FIGURE 34.ITALY AUTOMOTIVE HMI MARKET, 2017–2025 ($MILLION)
FIGURE 35.REST OF EUROPE AUTOMOTIVE HMI MARKET, 2017–2025 ($MILLION)
FIGURE 36.COMPARATIVE SHARE ANALYSIS OF AUTOMOTIVE HMI MARKET, BY COUNTRY, 2017–2025 (%)
FIGURE 37.CHINA AUTOMOTIVE HMI MARKET, 2017–2025 ($MILLION)
FIGURE 38.JAPAN AUTOMOTIVE HMI MARKET, 2017–2025 ($MILLION)
FIGURE 39.INDIA AUTOMOTIVE HMI MARKET, 2017–2025 ($MILLION)
FIGURE 40.SOUTH KOREA AUTOMOTIVE HMI MARKET, 2017–2025 ($MILLION)
FIGURE 41.REST OF ASIA-PACIFIC AUTOMOTIVE HMI MARKET, 2017–2025 ($MILLION)
FIGURE 42.COMPARATIVE SHARE ANALYSIS OF AUTOMOTIVE HMI MARKET, BY COUNTRY, 2017–2025 (%)
FIGURE 43.LATIN AMERICA AUTOMOTIVE HMI MARKET, 2017–2025 ($MILLION)
FIGURE 44.MIDDLE EAST AUTOMOTIVE HMI MARKET, 2017–2025 ($MILLION)
FIGURE 45.AFRICA AUTOMOTIVE HMI MARKET, 2017–2025 ($MILLION)
FIGURE 46.ALPINE ELECTRONICS, INC.: REVENUE, 2016–2018 ($MILLION)
FIGURE 47.ALPINE ELECTRONICS, INC.: REVENUE SHARE BY SEGMENT, 2018 (%)
FIGURE 48.ALPINE ELECTRONICS, INC.: REVENUE SHARE BY GEOGRAPHY, 2018 (%)
FIGURE 49.CLARION: REVENUE, 2016–2018 ($BILLION)
FIGURE 50.CLARION: REVENUE SHARE BY SEGMENT, 2018 (%)
FIGURE 51.CLARION: REVENUE SHARE BY GEOGRAPHY, 2018 (%)
FIGURE 52.CONTINENTAL AG: REVENUE, 2015–2017 ($MILLION)
FIGURE 53.CONTINENTAL AG: REVENUE SHARE BY SEGMENT, 2017 (%)
FIGURE 54.CONTINENTAL AG: REVENUE SHARE BY GEOGRAPHY, 2017 (%)
FIGURE 55.DENSO CORPORATION: REVENUE, 2015–2017 ($MILLION)
FIGURE 56.DENSO CORPORATION: REVENUE SHARE BY SEGMENT, 2017 (%)
FIGURE 57.DENSO CORPORATION: REVENUE SHARE BY GEOGRAPHY, 2017 (%)
FIGURE 58.NUANCE COMMUNICATIONS, INC.: REVENUE, 2016–2018 ($MILLION)
FIGURE 59.NUANCE COMMUNICATIONS, INC.: REVENUE SHARE BY SEGMENT, 2017 (%)
FIGURE 60.NUANCE COMMUNICATIONS, INC.: REVENUE SHARE BY GEOGRAPHY, 2017 (%)
FIGURE 61.PANASONIC CORPORATION: REVENUE, 2016–2018 ($MILLION)
FIGURE 62.PANASONIC CORPORATION.: REVENUE SHARE BY GEOGRAPHY, 2018 (%)
FIGURE 63.ROBERT BOSCH GMBH: REVENUE SHARE BY SEGMENT, 2017 (%)
FIGURE 64.ROBERT BOSCH GMBH: REVENUE SHARE BY GEOGRAPHY, 2017 (%)
FIGURE 65.SAMSUNG ELECTRONICS CO. LTD.: REVENUE, 2015–2017 ($MILLION)
FIGURE 66.SAMSUNG ELECTRONICS CO. LTD.: REVENUE SHARE BY SEGMENT, 2017 (%)
FIGURE 67.SAMSUNG ELECTRONICS CO. LTD.: REVENUE SHARE BY GEOGRAPHY, 2017 (%)
FIGURE 68.VALEO: REVENUE, 2016–2018 ($BILLION)
FIGURE 69.VALEO: REVENUE SHARE BY SEGMENT, 2017 (%)
FIGURE 70.VALEO: REVENUE SHARE BY GEOGRAPHY, 2017 (%)
FIGURE 71.VISTEON CORPORATION: REVENUE, 2016–2018 ($MILLION)
FIGURE 72.VISTEON CORPORATION: REVENUE SHARE BY SEGMENT, 2018 (%)
FIGURE 73.VISTEON CORPORATION: REVENUE SHARE BY GEOGRAPHY, 2018 (%)


The HMI system uses display units as main component. The HMI products are communication channels for drivers and passengers with the vehicle. The HMI products are used for in-vehicle information and entertainment purposes. The sensors integrated in vehicles capture various images, videos, and data of the surroundings, which are displayed or notified via the HMI systems. The HMI products are evolving with touchscreens, voice controls, gesture recognition, and others. Furthermore, betterment of vehicle interiors is also driving the automotive HMI market.

Increase in adoption of HMI system for vehicles and rise in digital information display toward safety & security features boost the growth of the automotive HMI market. In addition, growth in production and sale of vehicles in developing countries of Asia-Pacific is also influencing the growth of automotive HMI market. The growth of the automotive HMI market directly depends on the advancement & expansion of infotainment system.

Among the analyzed regions, currently, Asia-Pacific is the highest revenue contributor, and is expected to remain dominant during the forecast period, followed by North America, Europe and LAMEA. This growth is attributed to increase in demand for various types of vehicles.

PURCHASE OPTIONS

Call or Email us

U.S.-Canada Toll-free: +1-800-792-5285
Int'l : +1-503-894-6022
Europe : +44-845-528-1300
Email : help@alliedmarketresearch.com

Looking for Customization?

 Customization Request

Have a Question?

 Speak with Analyst

Any Confusion?

 Inquire Before Buying

Have a glance of the Report

  Request Sample

Purchase Full Report of
Automotive Hmi Market

Start reading instantly.
This Report and over 67,068+ more Reports, Available with Avenue Library. T&C*.

  • Online Only
  • $3,456
  • Online cloud access only
  • Restricted print, copy, paste & download
  • Read only
  • Free industry update
    (Within 180 days)
  • Free report update in next update cycle
    (Mar 2020 - Mar 2021)
  • Data Pack
  • $3,840
  • Restricted to one authorized user
  • One print only
  • Available in
    Excel
  • Free industry update
    (Within 180 days)
  •   Free report update in next update cycle
    (Mar 2020 - Mar 2021)
  • Single User
  • $5,769
  • Restricted to one authorized user
  • One print only
  • Available in
    PDF
  • Free industry update
    (Within 180 days)
  •   Free report update in next update cycle
    (Mar 2020 - Mar 2021)
  • Five Users
  • $6,450
  • Limited to five authorized users
  • Print upto five copies
  • Available in
    PDF
  • Free industry update
    (Within 180 days)
  •   Free report update in next update cycle
    (Mar 2020 - Mar 2021)
  • Enterprise
    License/PDF

  • $10,995
  • Unlimited
    within
    company/enterprise
  • Available in Excel & PDF
  • Free industry update
    (Within 180 days)
  •   Free report update in next update cycle
    (Mar 2020 - Mar 2021)
  • Library
    Membership

  • $999 $ 1,175
    Per User/ Per month/ Billed annually
  • Published Content
    E-access
  • Company Profiles
    E-access
  • Newly Added Content Access
  • 10 PDF
    Downloads
  • 5 Excel Data
    Pack Downloads
  • 250 Company Profiles PDF Downloads
  • Buy Now

*Taxes/Fees, if applicable will be added during checkout. All prices in USD

RELATED REPORTS
 

Why Allied Market Research?


Infallible Methodology

To ensure high-level data integrity, accurate analysis, and impeccable forecasts

Analyst Support

For complete satisfaction

Customization

On-demand customization of scope of the report to exactly meet your needs

TARGETED MARKET VIEW

Targeted market view to provide pertinent information and save time of readers

Get fresh content delivered

Get insights on topics that are crucial for your business. Stay abreast of your interest areas.

Get Industry Data Alerts

Why Allied Market Research?

Infallible Methodology

To ensure high-level data integrity, accurate analysis, and impeccable forecasts

Analyst Support

For complete satisfaction

Customization

On-demand customization of scope of the report to exactly meet your needs

TARGETED MARKET VIEW

Targeted market view to provide pertinent information and save time of readers