
Automotive Hypervisor Market Overview
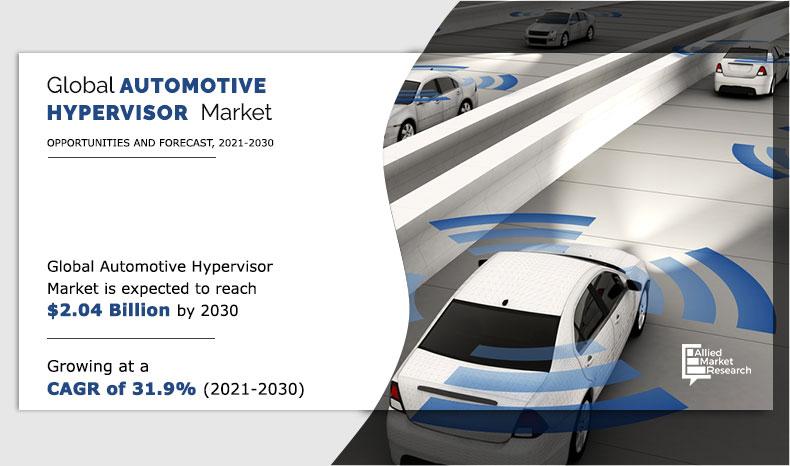
The global automotive hypervisor market was valued at USD 131.20 million in 2020, and is projected to reach USD 2,037.60 million by 2030, registering a CAGR of 31.9% from 2021 to 2030.
Factors such as growth of connected infrastructure, adoption of ADAS features in vehicles and intervention of innovative technologies for advanced user interface (UI) supplements the growth of the global automotive hypervisor market. Moreover, the factors such as high manufacturing cost and troubleshooting & maintenance of automotive software hampers the growth of the global automotive hypervisor market. However, the factors such as improved performance of autonomous vehicles and data monetization in extended automotive ecosystem are the factors that are expected to create a positive impact on the growth of the automotive hypervisor market in the near future.
Introduction
Automotive hypervisor is an embedded technology specially designed for automobiles and is used for in-vehicle infotainment purpose. It is a set of programs which is capable to perform numerous virtual machine operations through operating system (OS) on a host system. Typically, hypervisors are low-level programs designed in virtualization that allows a single processor to be shared with multiple applications that run on different operating systems. Moreover, hypervisor can be called as a computer software that allows multiple operating systems to utilize a common CPU, memory, etc. and also decides the hardware allocation for each of the program. Generally two types of hypervisors i.e. Type 1 & Type 2 are designed, which are used in automobiles and its application depends on the architecture of the vehicle system.
Segment Overview
The global automotive hypervisor market is segmented into vehicle type, type, level of automation, vehicle class and region. Based on the vehicle type, the market has been segmented into passenger cars, light commercial vehicles and heavy commercial vehicles. Based on type, the automotive hypervisor market has been segmented into Type 1 and Type 2. Based on the level of automation, the market has been segmented into semi-autonomous and fully autonomous. Based on the vehicle class, the market has been segmented into mid-priced and luxury. By region, the global market is analyzed across North America, Europe, Asia-Pacific and LAMEA.
By Vehicle Type
Heavy Commercial Vehicles is projected as the most lucrative segments
Key Market Players
Automotive hypervisor key players include BlackBerry, Green Hills, IBM, NXP Semiconductors, Panasonic Corporation, Renesas Electronic Corporation, Sasken, Siemens AG, Visteon and Wind River.
By Type
Type 1 is projected as the most lucrative segments
Top Impacting Factors
Growth of connected infrastructure
With the rapid adoption of Internet of Things (IoT), the transportation infrastructure across the globe is evolving quickly. Companies such as Cisco and IBM, have created digital platforms, which can automate street and traffic lights, optimize trash pickup, and augment surveillance. For instance, installation of IoT sensors in Las Vegas streets has managed to control traffic congestion and solve environmental issues. Connected infrastructure includes car parks, toll booths, and smart-street and traffic lights.
Autonomous vehicles can interact with intelligent street lights to enable fluid traffic without any congestion. Furthermore, development of ITS corridors are also one of the growth factors for autonomous vehicles as ITS corridors have connecting services and allow communication between vehicle and infrastructure (V2I), thus easing the traffic flow. Therefore, growth in connected infrastructure is projected to boost the demand for advanced vehicle thereby leading to the growth of automotive hypervisor market.
By Level Of Automation
Fully Anutonomous is projected as the most lucrative segments
Intervention of innovative technologies for advanced user interface (UI)
User interface is an interactive platform that is used as a medium for the user and the application to interact. New vehicles are being equipped with innovative technologies such as visual info-gratification including digital speedometers, climate control, navigation, driving assistance and other car settings. These digital info-graphics systems can be accessed through touchscreen display, which is placed on the vehicle’s dashboard. In addition, in order to provide the same digital human experience to the users, leading automotive companies are improving the user interface (UI) inside the next vehicle generation by adding digital screens and human-interfaces to the interior of a car. Such interfaces require software for technology integration, which in turn, boost the automotive hypervisor market growth.
For instance, in January 2020, Rightware, the leading provider of automotive user interface software, introduced new Kanzi reference HMI (Human-Machine Interface) platform, which combines the company’s suite of automotive user interface design software into an integrated solution to help automakers and suppliers deliver the best possible user experience in multi-display digital cockpits.
By Vehicle Class
Luxury is projected as the most lucrative segments
Troubleshooting and maintenance of automotive software
The integration of software solutions on cars has added computer-like specs to cars. The digitization of vehicles has enhanced performance, efficiency and convenience. However, software failures pose a huge challenge to the automotive industry. Software is transforming car capabilities but also creating development challenges for automotive players. In addition, the automotive software market is in developing phase, thus, there is a limited number of resources with hands-on experience in the latest and trending technologies to maintain or troubleshoot the software problems. Moreover, not only consumers need to learn more about software-based features and maintenance, but also car manufacturers, vendors, automotive & transportation industry players yet have little understanding of software-based services, as well as maintenance and troubleshooting of that software. Therefore, the factors such as lack of skilled workforce, automotive software engineers and expertise is limiting the automotive hypervisor market growth.
Data monetization in extended automotive ecosystem
One major trend emerging in the global automotive sector is vehicle connectivity. The connectivity ecosystem of automotive includes various stakeholders such as insurers, cellular network providers, software providers, IT companies, and hardware and electronic devices providers. Vehicles are now able to capture and share many types of data, including geolocation, vehicle performance, driver behavior, and biometrics data. Hence, it is a dynamic ecosystem where every stakeholder including software providers monetizes the data generated from the vehicles. In addition, the growing attraction of connected cars has compelled automotive companies to develop skills in web technology, chip design, and embedded systems, starting with smartphone integration. Therefore, the data monetization is expected to create growth opportunities for the automotive hypervisor market in near future.
By Region
Asia-Pacific would exhibit the highest CAGR of 35.7% during 2021-2030.
Covid-19 Impact Analysis
COVID-19 has presented the world with an unprecedented economic, humanitarian, and healthcare challenge.
It has also affected general lifestyle and behavior pertaining to travel, consumption of goods, and services as well as working style of individuals.
Moreover, owing to the pandemic and its rapid spread across the globe, demand & supply chain for numerous products came to a halt due to unavailability of transportation medium.
This has increased demand for electric vehicles and resulted in the electric vehicle industry to witness lucrative growth at the end of 2020.
Moreover, numerous companies, which are inclined toward production of advanced technologies to be used in vehicles have carried out numerous developmental strategies such as agreements, expansions, product developments, and product launches.
Key Benefits For Stakeholders
This study presents analytical depiction of the global automotive hypervisor market analysis along with current trends and future estimations to depict imminent investment pockets.
The overall automotive hypervisor market opportunity is determined by understanding profitable trends to gain a stronger foothold.
The report presents information related to the key drivers, restraints, and opportunities of the global automotive hypervisor market with a detailed impact analysis.
The current automotive hypervisor market is quantitatively analyzed from 2021 to 2030 to benchmark the financial competency.
Porter’s five forces analysis illustrates the potency of the buyers and suppliers in the industry.
Automotive Hypervisor Market Report Highlights
| Aspects | Details |
| By VEHICLE TYPE |
|
| By TYPE |
|
| By LEVEL OF AUTOMATION |
|
| By VEHICLE CLASS |
|
| By Region |
|
| Key Market Players | Sasken Technologies Ltd, Siemens, Wind River Systems, Inc., Renesas Electronics Corporation, NXP Semiconductors, Visteon Corporation, BlackBerry Limited, Green Hills Software, Panasonic Corporation, IBM |
Analyst Review
Automotive hypervisor market is supplemented by numerous developments carried out by the top automotive hypervisor manufacturers which has led to the growth of the market. Moreover, technological advancements in vehicle developments followed by the introduction of advanced vehicle technology such as ADAS, connected services & others leads to the growth of the global market.
The growth of connected infrastructure, adoption of ADAS features in vehicles and intervention of innovative technologies for advanced user interface (UI) provides lucrative opportunities for the growth of the global market. Moreover, the presence of technology driven companies such as Blackberry, IBM and others, provides a lucrative growth opportunities for automotive hypervisor market. For instance, in April 2021, Blackberry Limited announced a joint venture with Volvo Group, one of the world’s leading manufacturers of heavy-duty trucks, buses and construction equipment, has selected BlackBerry QNX as the foundational software for its main domain controller ECUs in more than 300,000 heavy vehicles Volvo Group manufactures every year. Similarly, in January 2021, Green Hills Software launched µ-visor, a new version of hypervisor, which has higher availability applications running on multicore microcontrollers like Renesas’ RH850. It's designed to meet critical levels of safety and security in automobiles and has typical automotive applications such as self-driving cars or advanced driver-assistance systems (ADAS).
Factors such as growth of connected infrastructure, adoption of ADAS features in vehicles and intervention of innovative technologies for advanced user interface (UI) supplements the growth of the global automotive hypervisor market. Moreover, the factors such as high manufacturing cost and troubleshooting & maintenance of automotive software, hampers the growth of the global automotive hypervisor market. However, the factors such as improved performance of autonomous vehicles and data monetization in extended automotive ecosystem are the factors that are expected to create a positive impact on the growth of automotive hypervisor market in the near future.
Among the analyzed regions, North America is the highest revenue contributor, followed by Europe, Asia-Pacific and LAMEA. On the basis of forecast analysis, Asia-Pacific is expected to maintain its lead during the forecast period, owing to increase in demand for luxury vehicles with advanced features followed by LAMEA as compared to other regions.
The global automotive hypervisor market was valued at USD 131.20 million in 2020, and is projected to reach USD 2,037.60 million by 2030.
The global automotive hypervisor market is projected to grow at a compound annual growth rate of 31.9% from 2021-2030 to reach USD 2,037.60 million by 2030.
The key players that operate in the automotive hypervisor market such as BlackBerry, Green Hills, IBM, NXP Semiconductors, Panasonic Corporation, Renesas Electronic Corporation, Sasken, Siemens AG, Visteon and Wind River.
North America is the highest revenue contributor.
Factors such as growth of connected infrastructure, adoption of ADAS features in vehicles and intervention of innovative technologies for advanced user interface (UI) supplements the growth of the global automotive hypervisor market.
Loading Table Of Content...

