
In-Wheel Motor Market Outlook 2030
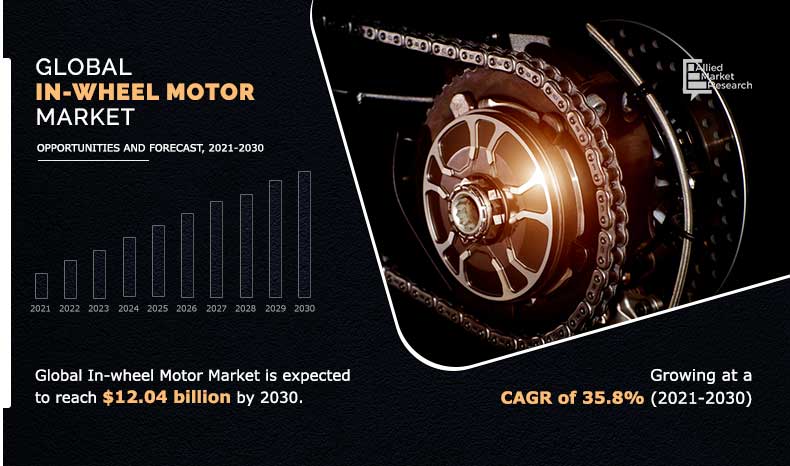
The global in-wheel motors market was valued at $577.20 million in 2020, and is projected to reach $12,041.50 million by 2030, registering a CAGR of 35.8% from 2021 to 2030.
In-wheel motors are type of electric motors, which are installed in wheels of electric vehicles and are required to offer a better performance by directly powering wheels of the vehicle. Conventional electric vehicles involved only one motor responsible for propelling all wheels of an EV whereas with introduction of in-wheel motor system, independent motors were installed to wheels of vehicles and were responsible for individual operations. In-wheel motor installed around wheels of vehicles directly powers the wheel thereby offering a good accelerator response. Moreover, introduction of in-wheel motors in electric vehicles makes driving more aligned as well as increases fun and intuitiveness of driving experience.
Factors such as high demand for safety and convenience features, rise in demand for electric vehicles, and stringent safety regulations set by governments for the automotive industry supplements growth of the global in-wheel motor market. Moreover, high manufacturing cost and decrease in global vehicle production are the restraining factors that hampers the growth of the global market. However, wide number of applications employing use of electric motors and increase in penetration of electric vehicles are the factors that are expected to provide lucrative opportunities thereby supplementing growth of the global in-wheel motor market.
The global in-wheel motor market is segmented into propulsion type, vehicle type, vehicle class, cooling type, power output type, weight, and region. By propulsion type, the global market has been segmented into battery electric vehicles (BEV), hybrid electric vehicles (HEV) and plug-in hybrid electric vehicles (PHEV). By vehicle type, the global market has been segmented into passenger cars and commercial vehicles. By vehicle class, it is segmented into mid-priced and luxury. By cooling type, it has segmented into air cooling and liquid cooling. By power output type, it is segmented into up to 60 KW, 60–90 KW, and above 90 KW. By weight, it is divided into less than 20 kg, 20 kg to 30 kg and more than 31 kg. By region, the global market has been segmented into North America, Europe, Asia-Pacific, and LAMEA.
By Propulsion Type
Battery Electric Vehicle is projected as the most lucrative segments
Key Market Players
The key players profiled in the global in-wheel motor market includes Ecomove GmbH, Elaphe Ltd., e-Traction B.V., Lordstown Motors, MW Motors, NSK, NTN Corporation, Schaeffler AG, Nissan Motor Company, LTD., and Ziehl-Abegg SE.
By Vehicle Type
Commercial Vehicle is projected as the most lucrative segments
High demand for safety and convenience features
Over past few years, the automotive industry has been witnessing increased demand for advanced features in vehicles such as power steering system, climate control system, anti-lock braking system, and others. This has led to rise in applications of motor in automobile, thereby driving growth of this market. Moreover, in developed economies, such as the U.S., there is a rise in demand for enhanced convenience, safety, and comfort in automobiles. Features such as comfort, luxury, safety, and security benefits, such as steering-mounted controls, heads-up displays, advanced infotainment systems, gesture control systems, telematics, and central controllers, are in demand. Furthermore, the automotive market has witnessed increase in number of electronic components & software content in vehicles across the globe that offers latest technology-based infotainment and telematics system.
By Vehicle Class
Luxury is projected as the most lucrative segments
For instance, in September 2018, Renault-Nissan-Mitsubishi and Google collaborated for in-vehicle next-gen infotainment system. Launch for embedded android-based operating system for vehicles is expected by 2021. Further, safety and convenience features, such as automatic emergency braking system (AEBS), lane-keeping assist, blind-spot warning, lane-departure warning system (LDWS), pedestrian & cyclist detection, and automatic high-beam headlights are trending in the market. All these factors are expected to fuel demand for in-wheel motors.
By Cooling Type
Air Cooling is projected as the most lucrative segments
Stringent safety regulations set by governments for automotive industry
The automotive market is positively affected by safety regulations implemented by government for installation of power window, airbags, and anti-lock braking systems (ABS) in every vehicle. Europe and North America have been witnessed to follow these regulations more stringently as compared to Asia-Pacific and rest of the world. However, in developing countries, OEMs are providing key less entry and anti-lock braking system (ABS) as standard features in vehicles, supporting the government to improve safety measures, thereby boosting sales of motors for vehicles. These safety systems need separate motors to function smoothly and to communicate with other components of vehicle to provide complete safety to passengers. Therefore, as incorporation of safety features has been made obligatory, demand for vehicular motors is anticipated to grow, which fuels growth of the market.
By Power Output Type
Above 90 kW is projected as the most lucrative segments
Decrease in global vehicle production
After 8 successful years of increasing sales till 2017, the global automotive production has witnessed decrease in vehicle sales (passenger vehicles as well as commercial vehicles). As compared to 2017, the overall vehicle sales in 2018 decreased by 1%, which was the highest ever in the history. Moreover, vehicle sales statistics in 2019 is not positive and vehicle sale is on a continuous decline rate, especially in developing countries, such as India and China, which hampers growth of the in-wheel motors market. Further, Asia-Pacific, which accounts for more than half of the global production, witnessed decrease in vehicle production for about 2% in 2018, which resulted in the reduced sales of motors to be used in vehicles.
By Weight
20 kg to 30 kg is projected as the most lucrative segments
Increase in penetration of electric vehicles
In recent years, demand and production of electric vehicles has increased significantly as electric vehicles have several advantages over fuel-powered automobiles. Components such as fan belts, oil, air filters, head caskets, timing belts, cylinder heads, and spark plugs do not require replacement, which makes it cheaper and efficient for fuel-powered automobiles. This makes electric vehicle a preferred choice; thereby, restraining growth of the fuel-powered automobile market. In addition, automobile manufacturers are focusing toward development of electric vehicles with in-wheel motor, owing to improved vehicle dynamics and traction control. Thus, growth in production of electric vehicles is anticipated to offer lucrative growth opportunity for players operating in the in-wheel motor market.
By Region
LAMEA would exhibit the highest CAGR of 40.2% during 2021-2030.
Covid-19 Impact Analysis
- COVID-19 outbreak impacted the automotive industry significantly, which in turn, resulted in substantial decline in automobile sales, shortage of raw material, and others.
- Automotive industry players are facing issues such as complete halt of production activities and mandated plant closures by governments.
- Loss of production is anticipated to increase if the lockdown in countries is extended.
- Global sales of light vehicles have dropped down by around 20% (Y-o-Y) from 6,335 thousand in February 2019 to 5,077 thousand in February 2020.
- Demand for automobiles experienced a decline in all parts of Europe and North America, owing to surge in quarantine measures and increase in COVID-19 cases across the world.
Key Benefits For Stakeholders
This study presents analytical depiction of the global in-wheel motor market analysis along with current trends and future estimations to depict imminent investment pockets.
- The overall in-wheel motor market opportunity is determined by understanding profitable trends to gain a stronger foothold.
- The report presents information related to the key drivers, restraints, and opportunities of the global in-wheel motor market with a detailed impact analysis.
- The current in-wheel motor market is quantitatively analyzed from 2020 to 2030 to benchmark the financial competency.
- Porter’s five forces analysis illustrates the potency of the buyers and suppliers in the industry.
Key Market Segments
By Propulsion type
- Battery Electric Vehicles
- Hybrid Electric Vehicles
- Plug-in Hybrid Electric Vehicles
By Vehicle Type
- Passenger Cars
- Commercial Vehicles
By Vehicle Class
- Mid-priced
- Luxury
By Cooling Type
- Air Cooling
- Liquid Cooling
By Power Output Type
- Up to 60 KW
- 60–90 KW
- Above 90 KW
By Weight
- Less than 20 kg
- 20 kg to 30 kg
- More than 31 kg
By Region
- North America
- U.S.
- Canada
- Mexico
- Europe
- UK
- Germany
- France
- Netherlands
- Rest of Europe
- Asia-Pacific
- China
- Japan
- South Korea
- Singapore
- Rest of Asia-Pacific
- LAMEA
- Latin America
- Middle East
- Africa
Key Players
- Ecomove GmbH
- Elaphe Ltd.
- e-Traction B.V.
- Lordstown Motors
- MW Motors
- NSK
- NTN Corporation
- Schaeffler AG
- Nissan Motor Company LTD
- Ziehl-Abegg SE
In-Wheel Motor Market Report Highlights
| Aspects | Details |
| By Propulsion type |
|
| By Vehicle Type |
|
| By Vehicle Class |
|
| By Cooling Type |
|
| By Power Output Type |
|
| By Weight |
|
| By Region |
|
| Key Market Players | NTN Corporation, .NISSAN MOTOR CO., LTD., Schaeffler AG, ZIEHL-ABEGG SE, NSK Ltd., e-Traction B.V., MW Motors, Elaphe Propulsion Technologies Ltd., ECOMOVE, Lordstown Motors |
Analyst Review
Automotive industry is supplemented by numerous developments carried out by top in-wheel motor manufacturers, which has led to growth of the market. Moreover, technological advancements in vehicular technology followed by increased trend for electric vehicles with increased efficiency supplements growth of the global market.
Increase in advanced vehicle demand and shift from fuel-based vehicles to electric vehicles has led to growth of the global in-wheel motor market. However, unavailability of suitable infrastructure supporting electric vehicles followed by high cost of associated components creates a negative impact on growth of the in-wheel motor market.
Moreover, rise in investments on building efficient vehicles and technological advancements in electric vehicle systems are expected to provide lucrative opportunities for growth of the global market in the future
Factors such as high demand for safety and convenience features, rise in demand for electric vehicles and stringent safety regulations set by governments for automotive industry supplements growth of the global in-wheel motor market. Moreover, high manufacturing cost and decrease in global vehicle production hamper growth of the global market. However, wide number of applications employing use of electric motors and increase in penetration of electric vehicles are the factors that are expected to provide lucrative opportunities thereby supplementing growth of the global in-wheel motor market.
Among the analyzed regions, Asia-Pacific is the highest revenue contributor, followed by Europe, North America, and LAMEA. On the basis of forecast analysis, LAMEA is expected to maintain its lead during the forecast period, owing to increase in demand for luxury vehicles with advanced features followed by North America as compared to other regions.
The global in-wheel motors market was valued at $577.20 million in 2020, and is projected to reach $12,041.50 million by 2030, registering a CAGR of 35.8% from 2021 to 2030
Installation of in-wheel motror in Evs increases the efficiency of the vehicle as all the wheels have their own motor rather than depending on a central motor.
The sample for global in-wheel motor market report can be obtained on demand from the AMR website. Also, the 24*7 chat support and direct call services are provided to procure the sample report.
Continuous product development & product launch are the new competitive developments in in-wheel motor
Electric vehicle manufacturers are the potential customers of in-wheel motor.
The company profiles of the top market players of in-wheel motor market can be obtained from the company profile section mentioned in the report. This section includes analysis of top ten player’s operating in the in-wheel motor market.
NSK Corporation, Schaeffler, NTN Nissan are the top companies hold the market share in in-wheel motor.
The propulsion type is the most influencing segment growing in the in-wheel motor report
China, Japan, Germany, France, U.S. are the key matured markets growing in the in-wheel motor report
Asia-Pacific leads the market in terms of market value whereas LAMEA is expected to provide lucrative opportunities for the growth of the market due to suitable growth rate.
Loading Table Of Content...

