0
2017
Automotive Oem Coatings Market

Automotive OEM Coatings Market

by Type (Solvent-Borne, Waterborne, Powdered), Layer (Primer, Basecoat, Electrocoat, and Clearcoat), and Vehicle Type (Passenger Cars, Light Commercial Vehicles, Heavy Commercial Vehicles) - Global Opportunity Analysis and Industry Forecast, 2014-2022

Report Code: A01810
Apr 2017 | Pages: 198
Tables: 122
Charts: 28
  • Formats*:

  • pdf

    Single User License, Five User
    License & Enterprise User License

  • xls

    Data Pack Excel License

  • ppt

    It comes with the additional cost
    of $2500.00 contact sales.


COVID-19

Pandemic disrupted the entire world and affected many industries.

Get detailed COVID-19 impact analysis on the Automotive Oem Coatings Market

Request Now !

Automotive OEM Coatings Market Overview:

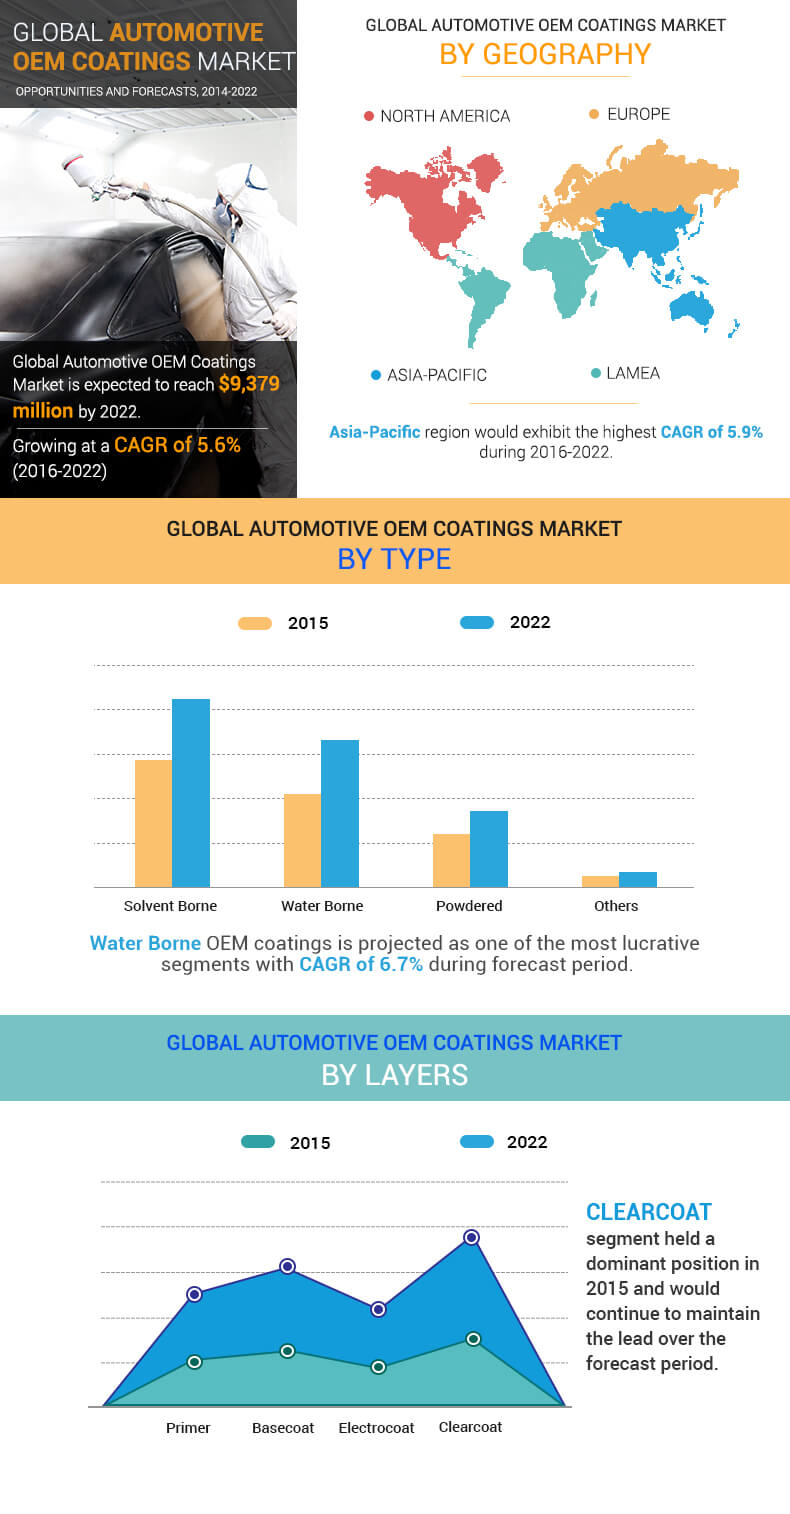
Global Automotive OEM Coatings Market size was valued at $6,426 million in 2015, and is expected to reach $9,379 million by 2022, registering a CAGR of 5.6% between 2016 and 2022. Automotive coatings are used to coat the surfaces of automobiles and exemplify the futuristic technologies, which are capable of manufacturing durable surfaces, maximizing overall efficiency while meeting environmental norms. Moreover, they enhance the overall durability and appearance of a vehicle and also safeguard it from UV radiation, extreme temperature, and foreign particles.

The global automotive OEM coatings market is segmented based on type, layer, vehicle type, and geography. The type segment is categorized into solvent-borne, waterborne, powdered, and others. Based on layer, the market is divided into primer, basecoat, electrocoat, and clearcoat. On the basis of vehicle type, the market is divided into passenger cars, light commercial vehicles, heavy commercial vehicles, and others. The light commercial vehicles segment is anticipated to register a significant CAGR during the forecast period. Geographically, the market is analyzed across market is segmented into North America, Europe, Asia-Pacific, and LAMEA.

Top Investment Pockets

The passenger cars segment offers maximum market potential in the automotive OEM coatings market, owing to increase in demand for passenger cars and general utility vehicles globally with rise in public transportation expenditure and increase in inclination of consumers towards efficient and easy transportation needs boost the overall demand for automotive OEM coatings in the passenger cars segment. The use of automotive OEM coatings in light commercial vehicles has witnessed major developments, owing to constant growth in per capita disposable incomes and rise in demand for commercial utility vehicles. The passenger cars segment is expected to register a CAGR of 5.8% during the forecast period. However, rise in concerns related to the environmental hazards associated with the solvent-borne automotive coatings may affect the overall market growth in the developed and the developing countries, but investments in R&D in new production alternatives are expected to provide opportunities for growth in the future.

Segment Review

The clearcoat segment dominated the global market in 2014 and is anticipated to maintain its dominance throughout the forecast period growing at a significant CAGR of 5.8%.

Geography Review

The European region accounted for more than 30% share of the total revenue in 2015, followed by Asia-Pacific and North America. Developing countries in the Asia-Pacific region are anticipated to register steady growth rates owing to increase in growth of the overall economy. Moreover, rise in investments by key manufacturers in the region is another key aspect that fuels the growth in the market.

Key players have economically invested higher values in R&D activities to develop advanced products to cater the requirements of the market. The key players operating in the automotive OEM coatings industry include Axalta Coating Systems, BASF SE, PPG Industries, Nippon Paint, Kansai Paint, AkzoNobel, Sherwin-Williams Company, KCC Paint, Bayer AG, and Arkema SA.

The other players in the automotive OEM coatings market value chain (profiles not included in the report) include Beckers Group, Cabot Corporation, Berger Paints, Eastman Chemical Company, Valspar Corporation, Clariant AG, Deft, Inc., Jotun A/S, Royal DSM, Lord Corporation, and Solvay S.A. among others.

Key Benefits for Automotive OEM Coatings Market:

  • Porter’s five forces analysis helps analyze the potential of buyers & suppliers and their automotive OEM coatings market share for building strategies. 
  • It outlines the current trends and future scenario of the automotive OEM coatings market size from 2015 to 2022 to understand the prevailing opportunities and potential investment pockets.
  • Major countries in four major regions, namely, North America, Asia-Pacific, Europe, and LAMEA have been mapped according to their individual revenue contribution in the automotive OEM coatings market analysis at regional and country level.
  • The key drivers, restraints, and opportunities and their detailed impact analyses are elucidated in the study.
  • The profiles of key players along with their contribution in automotive OEM coatings market growth are enlisted in the report.

Automotive OEM Coatings Market Report Highlights

Aspects Details
By Type
  • Solvent Borne
  • Water borne
  • Powdered
  • Others
By Layer
  • Primer
  • Basecoat
  • Electrocoat
  • Clearcoat
By Vehicle Type
  • Passenger Cars
  • Light Commercial Vehicles
  • Heavy Commercial Vehicles
  • Others
By Geography
  • North America
    • U.S.
    • Canada
    • Mexico
  • Europe
    • Germany
    • France
    • UK
    • Spain
    • Italy
    • Rest of Europe
  • Asia-Pacific
    • India
    • China
    • Japan
    • Australia
    • Korea
    • Rest of Asia-Pacific
  • LAMEA
    • Brazil
    • KSA
    • South Africa
    • Rest of LAMEA
Key Market Players NIPPON PAINT, PPG INDUSTRIES, KANSAI PAINT, BASF SE, BAYER AG, SHERWIN WILLIAMS COMPANY, AKZO NOBEL, AXALTA COATING SYSTEMS, ARKEMA SA, KCC PAINT
 

CHAPTER 1. INTRODUCTION

1.1. REPORT DESCRIPTION
1.2. KEY BENEFITS
1.3. KEY MARKET SEGMENT
1.4. RESEARCH METHODOLOGY

1.4.1. Secondary Research
1.4.2. Primary Research
1.4.3. Analyst Tool & Model

CHAPTER 2. EXECUTIVE SUMMARY

2.1. MARKET SNAPSHOT
2.2. CXO PERSPECTIVES

CHAPTER 3. MARKET OVERVIEW

3.1. MARKET DEFINITION AND SCOPE
3.2. KEY FINDINGS

3.2.1. Top Investment Pockets
3.2.2. Top winning strategies

3.3. PORTERS FIVE FORCES ANALYSIS
3.4. MARKET DYNAMICS

3.4.1. Drivers

3.4.1.1. Increasing consumer preference
3.4.1.2. Increasing vehicle production
3.4.1.3. Increasing competition among key market players
3.4.1.4. Rapid development of transportation infrastructure

3.4.2. Restraints

3.4.2.1. Volatile nature of raw material prices
3.4.2.2. Harmful environmental impact of conventional coatings

3.4.3. Opportunities

3.4.3.1. Increasing demand for eco-friendly coatings

3.5. TOP PLAYER POSITIONING

CHAPTER 4. GLOBAL AUTOMOTIVE OEM COATINGS MARKET, BY TYPE

4.1. INTRODUCTION

4.1.1. Market Size and Forecast

4.2. SOLVENT BORNE

4.2.1. Key Market Trends, Growth Factors and Opportunities
4.2.2. Market Size and Forecast

4.3. WATER BORNE

4.3.1. Key Market Trends, Growth Factors and Opportunities
4.3.2. Market Size and Forecast

4.4. POWDERED

4.4.1. Key Market Trends, Growth Factors and Opportunities
4.4.2. Market Size and Forecast

4.5. OTHERS

4.5.1. Key Market Trends, Growth Factors and Opportunities
4.5.2. Market Size and Forecast

CHAPTER 5. GLOBAL AUTOMOTIVE OEM COATINGS MARKET, BY LAYER

5.1. INTRODUCTION

5.1.1. Market Size and Forecast

5.2. PRIMER

5.2.1. Key Market Trends, Growth Factors and Opportunities
5.2.2. Market Size and Forecast

5.3. BASECOAT

5.3.1. Key Market Trends, Growth Factors and Opportunities
5.3.2. Market Size and Forecast

5.4. ELECTROCOAT

5.4.1. Key Market Trends, Growth Factors and Opportunities
5.4.2. Market Size and Forecast

5.5. CLEARCOAT

5.5.1. Key Market Trends, Growth Factors and Opportunities
5.5.2. Market Size and Forecast

CHAPTER 6. GLOBAL AUTOMOTIVE OEM COATINGS MARKET, BY VEHICLE TYPE

6.1. INTRODUCTION

6.1.1. Market Size and Forecast

6.2. PASSENGER CARS

6.2.1. Key Market Trends, Growth Factors and Opportunities
6.2.2. Market Size and Forecast

6.3. LIGHT COMMERCIAL VEHICLES

6.3.1. Key Market Trends, Growth Factors and Opportunities
6.3.2. Market Size and Forecast

6.4. HEAVY COMMERCIAL VEHICLES

6.4.1. Key Market Trends, Growth Factors and Opportunities
6.4.2. Market Size and Forecast

6.5. OTHERS (MOTORBIKES, THREE WHEELERS ETC.)

6.5.1. Key Market Trends, Growth Factors and Opportunities
6.5.2. Market Size and Forecast

CHAPTER 7. GLOBAL AUTOMOTIVE OEM COATINGS MARKET, BY GEOGRAPHY

7.1. INTRODUCTION

7.1.1. Market Size and Forecast

7.2. NORTH AMERICA

7.2.1. Key Market Trends, Growth Factors and Opportunities
7.2.2. Market Size and Forecast
7.2.3. U.S.

7.2.3.1. Market size and forecast, by type

7.2.4. Canada

7.2.4.1. Market size and forecast, by type

7.2.5. Mexico

7.2.5.1. Market size and forecast, by type

7.3. EUROPE

7.3.1. Key Market Trends, Growth Factors and Opportunities
7.3.2. Market Size and Forecast
7.3.3. Germany

7.3.3.1. Market size and forecast, by type

7.3.4. France

7.3.4.1. Market size and forecast, by type

7.3.5. UK

7.3.5.1. Market size and forecast, by type

7.3.6. Spain

7.3.6.1. Market size and forecast, by type

7.3.7. Italy

7.3.7.1. Market size and forecast, by type

7.3.8. Rest of Europe

7.3.8.1. Market size and forecast, by type

7.4. ASIA-PACIFIC

7.4.1. Key Market Trends, Growth Factors and Opportunities
7.4.2. Market Size and Forecast
7.4.3. India

7.4.3.1. Market size and forecast, by type

7.4.4. China

7.4.4.1. Market size and forecast, by type

7.4.5. Japan

7.4.5.1. Market size and forecast, by type

7.4.6. Australia

7.4.6.1. Market size and forecast, by type

7.4.7. Korea

7.4.7.1. Market size and forecast, by type

7.4.8. Rest of Asia-Pacific

7.4.8.1. Market size and forecast, by type

7.5. LAMEA

7.5.1. Key Market Trends, Growth Factors and Opportunities
7.5.2. Market Size and Forecast
7.5.3. Brazil

7.5.3.1. Market size and forecast, by type

7.5.4. KSA

7.5.4.1. Market size and forecast, by type

7.5.5. South Africa

7.5.5.1. Market size and forecast, by type

7.5.6. Rest of LAMEA

7.5.6.1. Market size and forecast, by type

CHAPTER 8. COMPANY PROFILES

8.1. AXALTA COATING SYSTEMS

8.1.1. Company Overview
8.1.2. Company Snapshot
8.1.3. Operating Business Segments
8.1.4. Business Performance
8.1.5. Key Strategic Moves and Developments

8.2. BASF SE

8.2.1. Company Overview
8.2.2. Company Snapshot
8.2.3. Operating Business Segments
8.2.4. Business Performance
8.2.5. Key Strategic Moves and Developments

8.3. PPG INDUSTRIES

8.3.1. Company Overview
8.3.2. Company Snapshot
8.3.3. Operating Business Segments
8.3.4. Business Performance
8.3.5. Key Strategic Moves and Developments

8.4. NIPPON PAINT

8.4.1. Company Overview
8.4.2. Company Snapshot
8.4.3. Operating Business Segments
8.4.4. Business Performance
8.4.5. Key Strategic Moves and Developments

8.5. KANSAI PAINT

8.5.1. Company Overview
8.5.2. Company Snapshot
8.5.3. Operating Business Segments
8.5.4. Business Performance
8.5.5. Key Strategic Moves and Developments

8.6. AKZO NOBEL

8.6.1. Company Overview
8.6.2. Company Snapshot
8.6.3. Operating Business Segments
8.6.4. Business Performance
8.6.5. Key Strategic Moves and Developments

8.7. SHERWIN WILLIAMS COMPANY

8.7.1. Company Overview
8.7.2. Company Snapshot
8.7.3. Operating Business Segments
8.7.4. Business Performance
8.7.5. Key Strategic Moves and Developments

8.8. KCC PAINT

8.8.1. Company Overview
8.8.2. Company Snapshot
8.8.3. Operating Business Segments
8.8.4. Business Performance
8.8.5. Key Strategic Moves and Developments

8.9. BAYER AG

8.9.1. Company Overview
8.9.2. Company Snapshot
8.9.3. Operating Business Segments
8.9.4. Business Performance
8.9.5. Key Strategic Moves and Developments

8.10. ARKEMA SA

8.10.1. Company Overview
8.10.2. Company Snapshot
8.10.3. Operating Business Segments
8.10.4. Business Performance
8.10.5. Key Strategic Moves and Developments

List of Tables

TABLE 1. GLOBAL AUTOMOTIVE OEM COATINGS MARKET VALUE, BY TYPE, 2014-2022 ($MILLION)
TABLE 2. GLOBAL AUTOMOTIVE OEM COATINGS MARKET VOLUME, BY TYPE, 2014-2022 (KILOTONS)
TABLE 3. GLOBAL SOLVENT BORNE AUTOMOTIVE OEM COATINGS MARKET VALUE, BY REGION, 2014-2022 ($ MILLION)
TABLE 4. GLOBAL SOLVENT BORNE AUTOMOTIVE OEM COATINGS MARKET VOLUME, BY REGION, 2014-2022 (KILOTONS)
TABLE 5. GLOBAL WATER BORNE AUTOMOTIVE OEM COATINGS MARKET VALUE, BY REGION, 2014-2022 ($ MILLION)
TABLE 6. GLOBAL WATER BORNE AUTOMOTIVE OEM COATINGS MARKET VOLUME, BY REGION, 2014-2022 (KILOTONS)
TABLE 7. GLOBAL POWDERED AUTOMOTIVE OEM COATINGS MARKET VALUE, BY REGION, 2014-2022 ($ MILLION)
TABLE 8. GLOBAL POWDERED AUTOMOTIVE OEM COATINGS MARKET VOLUME, BY REGION, 2014-2022 (KILOTONS)
TABLE 9. GLOBAL OTHERS AUTOMOTIVE OEM COATINGS MARKET VALUE, BY REGION, 2014-2022 ($ MILLION)
TABLE 10. GLOBAL OTHERS AUTOMOTIVE OEM COATINGS MARKET VOLUME, BY REGION, 2014-2022 (KILOTONS)
TABLE 11. GLOBAL AUTOMOTIVE OEM COATINGS MARKET VALUE, BY LAYER, 2014-2022 ($MILLION)
TABLE 12. GLOBAL AUTOMOTIVE OEM COATINGS MARKET VOLUME, BY LAYER, 2014-2022 (KILOTONS)
TABLE 13. GLOBAL PRIMER AUTOMOTIVE OEM COATINGS MARKET VALUE, BY REGION, 2014-2022 ($MILLION)
TABLE 14. GLOBAL PRIMER AUTOMOTIVE OEM COATINGS MARKET VOLUME, BY REGION, 2014-2022 (KILOTONS)
TABLE 15. GLOBAL BASECOAT AUTOMOTIVE OEM COATINGS MARKET VALUE, BY REGION, 2014-2022 ($MILLION)
TABLE 16. GLOBAL BASECOAT AUTOMOTIVE OEM COATINGS MARKET VOLUME, BY REGION, 2014-2022 (KILOTONS)
TABLE 17. GLOBAL ELECTROCOAT AUTOMOTIVE OEM COATINGS MARKET VALUE, BY REGION, 2014-2022 ($MILLION)
TABLE 18. GLOBAL ELECTROCOAT AUTOMOTIVE OEM COATINGS MARKET VOLUME, BY REGION, 2014-2022 (KILOTONS)
TABLE 19. GLOBAL CLEARCOAT AUTOMOTIVE OEM COATINGS MARKET VALUE, BY REGION, 2014-2022 ($MILLION)
TABLE 20. GLOBAL CLEARCOAT AUTOMOTIVE OEM COATINGS MARKET VOLUME, BY REGION, 2014-2022 (KILOTONS)
TABLE 21. GLOBAL AUTOMOTIVE OEM COATINGS MARKET VALUE, BY VEHICLE TYPE, 2014-2022 ($MILLION)
TABLE 22. GLOBAL AUTOMOTIVE OEM COATINGS MARKET VOLUME, BY VEHICLE TYPE, 2014-2022 (KILOTONS)
TABLE 23. GLOBAL AUTOMOTIVE OEM COATINGS IN PASSENGER CARS MARKET VALUE, BY REGION, 2014-2022 ($MILLION)
TABLE 24. GLOBAL AUTOMOTIVE OEM COATINGS IN PASSENGER CARS MARKET VOLUME, BY REGION, 2014-2022 (KILOTONS)
TABLE 25. GLOBAL AUTOMOTIVE OEM COATINGS IN LIGHT COMMERCIAL VEHICLES MARKET VALUE, BY REGION, 2014-2022 ($MILLION)
TABLE 26. GLOBAL AUTOMOTIVE OEM COATINGS IN LIGHT COMMERCIAL VEHICLES MARKET VOLUME, BY REGION, 2014-2022 (KILOTONS)
TABLE 27. GLOBAL AUTOMOTIVE OEM COATINGS IN HEAVY COMMERCIAL VEHICLES MARKET VALUE, BY REGION, 2014-2022 ($MILLION)
TABLE 28. GLOBAL AUTOMOTIVE OEM COATINGS IN HEAVY COMMERCIAL VEHICLES MARKET VOLUME, BY REGION, 2014-2022 (KILOTONS)
TABLE 29. GLOBAL AUTOMOTIVE OEM COATINGS IN OTHERS MARKET VALUE, BY REGION, 2014-2022 ($MILLION)
TABLE 30. GLOBAL AUTOMOTIVE OEM COATINGS IN OTHERS MARKET VOLUME, BY REGION, 2014-2022 (KILOTONS)
TABLE 31. GLOBAL AUTOMOTIVE OEM COATINGS MARKET VALUE, BY REGION, 2014-2022 ($MILLION)
TABLE 32. GLOBAL AUTOMOTIVE OEM COATINGS MARKET VOLUME, BY REGION, 2014-2022 (KILOTONS)
TABLE 33. NORTH AMERICA AUTOMOTIVE OEM COATINGS MARKET VALUE, BY TYPE, 2014-2022 ($MILLION)
TABLE 34. NORTH AMERICA AUTOMOTIVE OEM COATINGS MARKET VOLUME, BY TYPE, 2014-2022 (KILOTONS)
TABLE 35. NORTH AMERICA AUTOMOTIVE OEM COATINGS MARKET VALUE, BY LAYER, 2014-2022 ($MILLION)
TABLE 36. NORTH AMERICA AUTOMOTIVE OEM COATINGS MARKET VOLUME, BY LAYER, 2014-2022 (KILOTONS)
TABLE 37. NORTH AMERICA AUTOMOTIVE OEM COATINGS MARKET VALUE, BY VEHICLE TYPE, 2014-2022 ($MILLION)
TABLE 38. NORTH AMERICA AUTOMOTIVE OEM COATINGS MARKET VOLUME, BY VEHICLE TYPE, 2014-2022 (KILOTONS)
TABLE 39. NORTH AMERICA AUTOMOTIVE OEM COATINGS MARKET VALUE, BY COUNTRY, 2014-2022 ($MILLION)
TABLE 40. NORTH AMERICA AUTOMOTIVE OEM COATINGS MARKET VOLUME, BY COUNTRY, 2014-2022 (KILOTONS)
TABLE 41. U.S. AUTOMOTIVE OEM COATINGS MARKET VALUE, BY TYPE, 2014-2022 ($MILLION)
TABLE 42. U.S. AUTOMOTIVE OEM COATINGS MARKET VOLUME, BY TYPE, 2014-2022 (KILOTONS)
TABLE 43. CANADA AUTOMOTIVE OEM COATINGS MARKET VALUE, BY TYPE, 2014-2022 ($MILLION)
TABLE 44. CANADA AUTOMOTIVE OEM COATINGS MARKET VOLUME, BY TYPE, 2014-2022 (KILOTONS)
TABLE 45. MEXICO AUTOMOTIVE OEM COATINGS MARKET VALUE, BY TYPE, 2014-2022 ($MILLION)
TABLE 46. MEXICO AUTOMOTIVE OEM COATINGS MARKET VOLUME, BY TYPE, 2014-2022 (KILOTONS)
TABLE 47. EUROPE AUTOMOTIVE OEM COATINGS MARKET VALUE, BY TYPE, 2014-2022 ($MILLION)
TABLE 48. EUROPE AUTOMOTIVE OEM COATINGS MARKET VOLUME, BY TYPE, 2014-2022 (KILOTONS)
TABLE 49. EUROPE AUTOMOTIVE OEM COATINGS MARKET VALUE, BY LAYER, 2014-2022 ($MILLION)
TABLE 50. EUROPE AUTOMOTIVE OEM COATINGS MARKET VOLUME, BY LAYER, 2014-2022 (KILOTONS)
TABLE 51. EUROPE AUTOMOTIVE OEM COATINGS MARKET VALUE, BY VEHICLE TYPE, 2014-2022 ($MILLION)
TABLE 52. EUROPE AUTOMOTIVE OEM COATINGS MARKET VOLUME, BY VEHICLE TYPE, 2014-2022 (KILOTONS)
TABLE 53. EUROPE AUTOMOTIVE OEM COATINGS MARKET VALUE, BY COUNTRY, 2014-2022 ($MILLION)
TABLE 54. EUROPE AUTOMOTIVE OEM COATINGS MARKET VOLUME, BY COUNTRY, 2014-2022 (KILOTONS)
TABLE 55. FRANCE AUTOMOTIVE OEM COATINGS MARKET VALUE, BY TYPE, 2014-2022 ($MILLION)
TABLE 56. FRANCE AUTOMOTIVE OEM COATINGS MARKET VOLUME, BY TYPE, 2014-2022 (KILOTONS)
TABLE 57. GERMANY AUTOMOTIVE OEM COATINGS MARKET VALUE, BY TYPE, 2014-2022 ($MILLION)
TABLE 58. GERMANY AUTOMOTIVE OEM COATINGS MARKET VOLUME, BY TYPE, 2014-2022 (KILOTONS)
TABLE 59. UK AUTOMOTIVE OEM COATINGS MARKET VALUE, BY TYPE, 2014-2022 ($MILLION)
TABLE 60. UK AUTOMOTIVE OEM COATINGS MARKET VOLUME, BY TYPE, 2014-2022 (KILOTONS)
TABLE 61. SPAIN AUTOMOTIVE OEM COATINGS MARKET VALUE, BY TYPE, 2014-2022 ($MILLION)
TABLE 62. SPAIN AUTOMOTIVE OEM COATINGS MARKET VOLUME, BY TYPE, 2014-2022 (KILOTONS)
TABLE 63. ITALY AUTOMOTIVE OEM COATINGS MARKET VALUE, BY TYPE, 2014-2022 ($MILLION)
TABLE 64. ITALY AUTOMOTIVE OEM COATINGS MARKET VOLUME, BY TYPE, 2014-2022 (KILOTONS)
TABLE 65. REST OF EUROPE AUTOMOTIVE OEM COATINGS MARKET VALUE, BY TYPE, 2014-2022 ($MILLION)
TABLE 66. REST OF EUROPE AUTOMOTIVE OEM COATINGS MARKET VOLUME, BY TYPE, 2014-2022 (KILOTONS)
TABLE 67. ASIA-PACIFIC AUTOMOTIVE OEM COATINGS MARKET VALUE, BY TYPE, 2014-2022 ($MILLION)
TABLE 68. ASIA-PACIFIC AUTOMOTIVE OEM COATINGS MARKET VOLUME, BY TYPE, 2014-2022 (KILOTONS)
TABLE 69. ASIA-PACIFIC AUTOMOTIVE OEM COATINGS MARKET VALUE, BY LAYER, 2014-2022 ($MILLION)
TABLE 70. ASIA-PACIFIC AUTOMOTIVE OEM COATINGS MARKET VOLUME, BY LAYER, 2014-2022 (KILOTONS)
TABLE 71. ASIA-PACIFIC AUTOMOTIVE OEM COATINGS MARKET VALUE, BY VEHICLE TYPE, 2014-2022 ($MILLION)
TABLE 72. ASIA-PACIFIC AUTOMOTIVE OEM COATINGS MARKET VOLUME, BY VEHICLE TYPE, 2014-2022 (KILOTONS)
TABLE 73. ASIA-PACIFIC AUTOMOTIVE OEM COATINGS MARKET VALUE, BY COUNTRY, 2014-2022 ($MILLION)
TABLE 74. ASIA-PACIFIC AUTOMOTIVE OEM COATINGS MARKET VOLUME, BY COUNTRY, 2014-2022 (KILOTONS)
TABLE 75. INDIA AUTOMOTIVE OEM COATINGS MARKET VALUE, BY TYPE, 2014-2022 ($MILLION)
TABLE 76. INDIA AUTOMOTIVE OEM COATINGS MARKET VOLUME, BY TYPE, 2014-2022 (KILOTONS)
TABLE 77. CHINA AUTOMOTIVE OEM COATINGS MARKET VALUE, BY TYPE, 2014-2022 ($MILLION)
TABLE 78. CHINA AUTOMOTIVE OEM COATINGS MARKET VOLUME, BY TYPE, 2014-2022 (KILOTONS)
TABLE 79. JAPAN AUTOMOTIVE OEM COATINGS MARKET VALUE, BY TYPE, 2014-2022 ($MILLION)
TABLE 80. JAPAN AUTOMOTIVE OEM COATINGS MARKET VOLUME, BY TYPE, 2014-2022 (KILOTONS)
TABLE 81. KOREA AUTOMOTIVE OEM COATINGS MARKET VALUE, BY TYPE, 2014-2022 ($MILLION)
TABLE 82. KOREA AUTOMOTIVE OEM COATINGS MARKET VOLUME, BY TYPE, 2014-2022 (KILOTONS)
TABLE 83. AUSTRALIA AUTOMOTIVE OEM COATINGS MARKET VALUE, BY TYPE, 2014-2022 ($MILLION)
TABLE 84. AUSTRALIA AUTOMOTIVE OEM COATINGS MARKET VOLUME, BY TYPE, 2014-2022 (KILOTONS)
TABLE 85. REST OF ASIA-PACIFIC AUTOMOTIVE OEM COATINGS MARKET VALUE, BY TYPE, 2014-2022 ($MILLION)
TABLE 86. REST OF ASIA-PACIFIC AUTOMOTIVE OEM COATINGS MARKET VOLUME, BY TYPE, 2014-2022 (KILOTONS)
TABLE 87. LAMEA AUTOMOTIVE OEM COATINGS MARKET VALUE, BY TYPE, 2014-2022 ($MILLION)
TABLE 88. LAMEA AUTOMOTIVE OEM COATINGS MARKET VOLUME, BY TYPE, 2014-2022 (KILOTONS)
TABLE 89. LAMEA AUTOMOTIVE OEM COATINGS MARKET VALUE, BY LAYER, 2014-2022 ($MILLION)
TABLE 90. LAMEA AUTOMOTIVE OEM COATINGS MARKET VOLUME, BY LAYER, 2014-2022 (KILOTONS)
TABLE 91. LAMEA AUTOMOTIVE OEM COATINGS MARKET VALUE, BY VEHICLE TYPE, 2014-2022 ($MILLION)
TABLE 92. LAMEA AUTOMOTIVE OEM COATINGS MARKET VOLUME, BY VEHICLE TYPE, 2014-2022 (KILOTONS)
TABLE 93. LAMEA AUTOMOTIVE OEM COATINGS MARKET VALUE, BY COUNTRY, 2014-2022 ($MILLION)
TABLE 94. LAMEA AUTOMOTIVE OEM COATINGS MARKET VOLUME, BY COUNTRY, 2014-2022 (KILOTONS)
TABLE 95. BRAZIL AUTOMOTIVE OEM COATINGS MARKET VALUE, BY TYPE, 2014-2022 ($MILLION)
TABLE 96. BRAZIL AUTOMOTIVE OEM COATINGS MARKET VOLUME, BY TYPE, 2014-2022 (KILOTONS)
TABLE 97. KSA AUTOMOTIVE OEM COATINGS MARKET VALUE, BY TYPE, 2014-2022 ($MILLION)
TABLE 98. KSA AUTOMOTIVE OEM COATINGS MARKET VOLUME, BY TYPE, 2014-2022 (KILOTONS)
TABLE 99. SOUTH AFRICA AUTOMOTIVE OEM COATINGS MARKET VALUE, BY TYPE, 2014-2022 ($MILLION)
TABLE 100. SOUTH AFRICA AUTOMOTIVE OEM COATINGS MARKET VOLUME, BY TYPE, 2014-2022 (KILOTONS)
TABLE 101. REST OF LAMEA AUTOMOTIVE OEM COATINGS MARKET VALUE, BY TYPE, 2014-2022 ($MILLION)
TABLE 102. REST OF LAMEA AUTOMOTIVE OEM COATINGS MARKET VOLUME, BY TYPE, 2014-2022 (KILOTONS)
TABLE 103. AXALATA COATING SYSTEMS: COMPANY SNAPSHOT
TABLE 104. AXALATA COATING SYSTEMS: OPERATING SEGMENTS
TABLE 105. BASF SE: COMPANY SNAPSHOT
TABLE 106. BASF SE: OPERATING SEGMENTS
TABLE 107. PPG INDUSTRIES: COMPANY SNAPSHOT
TABLE 108. PPG INDUSTRIES: OPERATING SEGMENTS
TABLE 109. NIPPON PAINT: COMPANY SNAPSHOT
TABLE 110. NIPPON PAINT: OPERATING SEGMENTS
TABLE 111. KANSAI PAINT: COMPANY SNAPSHOT
TABLE 112. KANSAI PAINT: OPERATING SEGMENTS
TABLE 113. AKZO NOBEL: COMPANY SNAPSHOT
TABLE 114. AKZO NOBEL: OPERATING SEGMENTS
TABLE 115. SHERWIN WILLIAMS COMPANY: COMPANY SNAPSHOT
TABLE 116. SHERWIN WILLIAMS COMPANY: OPERATING SEGMENTS
TABLE 117. KCC PAINT: COMPANY SNAPSHOT
TABLE 118. KCC PAINT: OPERATING SEGMENTS
TABLE 119. BAYER AG: COMPANY SNAPSHOT
TABLE 120. BAYER AG: OPERATING SEGMENTS
TABLE 121. ARKEMA SA: COMPANY SNAPSHOT
TABLE 122. ARKEMA SA: OPERATING SEGMENTS

List of Figures

FIGURE 1. GLOBAL AUTOMOTIVE OEM COATINGS MARKET: SEGMENTATION
FIGURE 2. GLOBAL AUTOMOTIVE OEM COATINGS MARKET SHARE, BY VEHICLE TYPE, 2015 (%)
FIGURE 3. TOP INVESTMENT POCKETS, BY TYPE
FIGURE 4. TOP WINNING STRATEGIES
FIGURE 5. BARGAINING POWER OF SUPPLIERS
FIGURE 6. BARGAINING POWER OF BUYERS
FIGURE 7. THREAT OF NEW ENTRANTS
FIGURE 8. THREAT OF SUBSTITUTES
FIGURE 9. COMPETITIVE RIVALRY
FIGURE 10. U.S. AUTOMOTIVE OEM COATINGS MARKET VALUE, 2014-2022 ($MILLION)
FIGURE 11. CANADA AUTOMOTIVE OEM COATINGS MARKET VALUE, 2014-2022 ($MILLION)
FIGURE 12. MEXICO AUTOMOTIVE OEM COATINGS MARKET VALUE, 2014-2022 ($MILLION)
FIGURE 13. FRANCE AUTOMOTIVE OEM COATINGS MARKET VALUE, 2014-2022 ($MILLION)
FIGURE 14. GERMANY AUTOMOTIVE OEM COATINGS MARKET VALUE, 2014-2022 ($MILLION)
FIGURE 15. UK AUTOMOTIVE OEM COATINGS MARKET VALUE, 2014-2022 ($MILLION)
FIGURE 16. SPAIN AUTOMOTIVE OEM COATINGS MARKET VALUE, 2014-2022 ($MILLION)
FIGURE 17. ITALY AUTOMOTIVE OEM COATINGS MARKET VALUE, 2014-2022 ($MILLION)
FIGURE 18. REST OF EUROPE AUTOMOTIVE OEM COATINGS MARKET VALUE, 2014-2022 ($MILLION)
FIGURE 19. INDIA AUTOMOTIVE OEM COATINGS MARKET VALUE, 2014-2022 ($MILLION)
FIGURE 20. CHINA AUTOMOTIVE OEM COATINGS MARKET VALUE, 2014-2022 ($MILLION)
FIGURE 21. JAPAN AUTOMOTIVE OEM COATINGS MARKET VALUE, 2014-2022 ($MILLION)
FIGURE 22. KOREA AUTOMOTIVE OEM COATINGS MARKET VALUE, 2014-2022 ($MILLION)
FIGURE 23. AUSTRALIA AUTOMOTIVE OEM COATINGS MARKET VALUE, 2014-2022 ($MILLION)
FIGURE 24. REST OF ASIA-PACIFIC AUTOMOTIVE OEM COATINGS MARKET VALUE, 2014-2022 ($MILLION)
FIGURE 25. BRAZIL AUTOMOTIVE OEM COATINGS MARKET VALUE, 2014-2022 ($MILLION)
FIGURE 26. KSA AUTOMOTIVE OEM COATINGS MARKET VALUE, 2014-2022 ($MILLION)
FIGURE 27. SOUTH AFRICA AUTOMOTIVE OEM COATINGS MARKET VALUE, 2014-2022 ($MILLION)
FIGURE 28. REST OF LAMEA AUTOMOTIVE OEM COATINGS MARKET VALUE, 2014-2022 ($MILLION)


Automotive OEM coatings are specialty paints and coatings used in automobiles to protect the underlying metal or synthetic body panels from harsh environment. Initially, chromium, lead and other heavy metals were employed in automotive coatings. In addition, with the introduction of various environmental regulations, the use of toxic chemicals has been prohibited, which has further resulted in a switch to water-based paints and coatings.

High demand from passenger cars and light commercial vehicle segments boost the growth of the market. Moreover, increase in demand from developing countries, such as China and India, owing to rapid urbanization and rise in consumer spending capabilities drive the market growth.

The European automotive OEM coatings market offers promising opportunities for the manufacturers, owing to enhanced production of automobiles in Germany, France, Czech Republic, and UK and increase in number of manufacturers. In addition, the increase in demand for efficient and cost-effective coating solutions and increase in disposable incomes in the developing economies, such as Poland, Russia, and Netherlands, drives the European market. Asia-Pacific is estimated to account for the largest market share, followed by North America.

PURCHASE OPTIONS

Call or Email us

U.S.-Canada Toll-free: +1-800-792-5285
Int'l : +1-503-894-6022
Europe : +44-845-528-1300
Email : help@alliedmarketresearch.com

Looking for Customization?

 Customization Request

Have a Question?

 Speak with Analyst

Any Confusion?

 Inquire Before Buying

Have a glance of the Report

  Request Sample
RELATED TAGS

Purchase Full Report of
Automotive Oem Coatings Market

Start reading instantly.
This Report and over 66,905+ more Reports, Available with Avenue Library. T&C*.

  • Online Only
  • $3,217
  • Online cloud access only
  • Restricted print, copy, paste & download
  • Read only
  • Free industry update
    (Within 180 days)
  • Free report update in next update cycle
    (Apr 2018 - Apr 2019)
  • Data Pack
  • $3,574
  • Restricted to one authorized user
  • One print only
  • Available in
    Excel
  • Free industry update
    (Within 180 days)
  •   Free report update in next update cycle
    (Apr 2018 - Apr 2019)
  • Single User
  • $4,999
  • Restricted to one authorized user
  • One print only
  • Available in
    PDF
  • Free industry update
    (Within 180 days)
  •   Free report update in next update cycle
    (Apr 2018 - Apr 2019)
  • Five Users
  • $6,004
  • Limited to five authorized users
  • Print upto five copies
  • Available in
    PDF
  • Free industry update
    (Within 180 days)
  •   Free report update in next update cycle
    (Apr 2018 - Apr 2019)
  • Enterprise
    License/PDF

  • $9,373
  • Unlimited
    within
    company/enterprise
  • Available in Excel & PDF
  • Free industry update
    (Within 180 days)
  •   Free report update in next update cycle
    (Apr 2018 - Apr 2019)
  • Library
    Membership

  • $999 $ 1,175
    Per User/ Per month/ Billed annually
  • Published Content
    E-access
  • Company Profiles
    E-access
  • Newly Added Content Access
  • 10 PDF
    Downloads
  • 5 Excel Data
    Pack Downloads
  • 250 Company Profiles PDF Downloads
  • Buy Now

*Taxes/Fees, if applicable will be added during checkout. All prices in USD

RELATED REPORTS
 

Why Allied Market Research?


Infallible Methodology

To ensure high-level data integrity, accurate analysis, and impeccable forecasts

Analyst Support

For complete satisfaction

Customization

On-demand customization of scope of the report to exactly meet your needs

TARGETED MARKET VIEW

Targeted market view to provide pertinent information and save time of readers

Get fresh content delivered

Get insights on topics that are crucial for your business. Stay abreast of your interest areas.

Get Industry Data Alerts

Why Allied Market Research?

Infallible Methodology

To ensure high-level data integrity, accurate analysis, and impeccable forecasts

Analyst Support

For complete satisfaction

Customization

On-demand customization of scope of the report to exactly meet your needs

TARGETED MARKET VIEW

Targeted market view to provide pertinent information and save time of readers