0
2018
Automotive Steering System Market

Automotive Steering System Market

by Type (Hydraulic Power Steering, Electronic Power Steering, and Electro-Hydraulic Power Steering System) and Vehicle Type (Passenger Vehicle and Commercial Vehicle): Global Opportunity Analysis and Industry Forecast, 2018 - 2025

Report Code: A01986
Dec 2018 | Pages: 203
Tables: 27
Charts: 28
  • Formats*:

  • pdf

    Single User License, Five User
    License & Enterprise User License

  • xls

    Data Pack Excel License

  • ppt

    It comes with the additional cost
    of $2500.00 contact sales.


COVID-19

Pandemic disrupted the entire world and affected many industries.

Get detailed COVID-19 impact analysis on the Automotive Steering System Market

Request Now !

Automotive Steering System Market Overview:

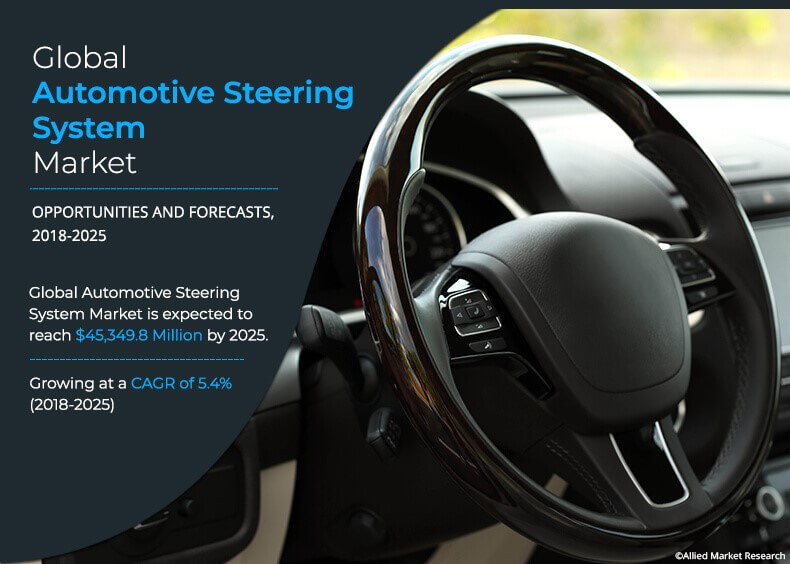
The global automotive steering system market was valued at $29,423.8 million in 2017, and is projected to reach $45,349.8 million by 2025, registering a CAGR of 5.4% from 2018 to 2025. In 2017, Asia-Pacific accounted for the highest share in the global automotive steering system market.

An automotive steering system is set of components used to control the direction of vehicle motion and help driver maneuver the vehicle as per the requirement. The hand-operated steering wheel, steering column, universal joints and rack & pinion mechanism contribute to the automotive steering system component. The development has led to change the steering system from manual steering to power assist steering system. The automotive steering system is considered as non-replaceable in automobiles and is responsible for effective control on vehicles making it a vital component in automobiles. The market for automotive steering system is highly demanding as the steering system is obligatory in automobiles.

global automotive steering system market

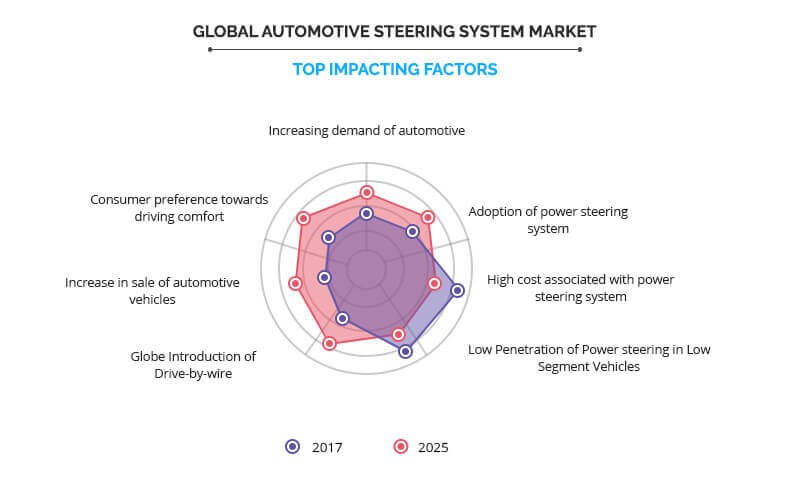
Increase in demand for automotive owing to rise in disposable income of consumers primarily drive the growth of the market. In addition, the adoption of power steering system in vehicles is responsible for the growth of this market. The effective steering system is accountable for increase in fuel efficiency of the vehicle. Hence, the increase in demand for fuel efficient vehicle results in increase in demand for steering system. Also, the consumers prefer driving comfort in their vehicles, which includes the effortless driving and maneuverability of the vehicle. The driving comfort is achieved by using effective steering system resulting in increase in demand for steering system implementing growth of this market.

However, the high cost associated with power steering system is anticipated to hamper the growth of the steering system market. The technology such as drive-by-wire is expected to be implemented in the upcoming vehicles, thus boosting the growth of the market in near future.

global automotive steering system market top impacting factors

The key players operating in the automotive steering system market include China Automotive Systems Inc., JTEKT Corporation, Nexteer Automotive, Mando Corporation, ThyssenKrupp Presta AG, Robert Bosch Automotive Steering GmbH, Showa Corporation, NSK Ltd, Mitsubishi Electric Corporation, Sona Koyo Steering Systems Ltd., and Hyundai Mobis Co. Ltd.

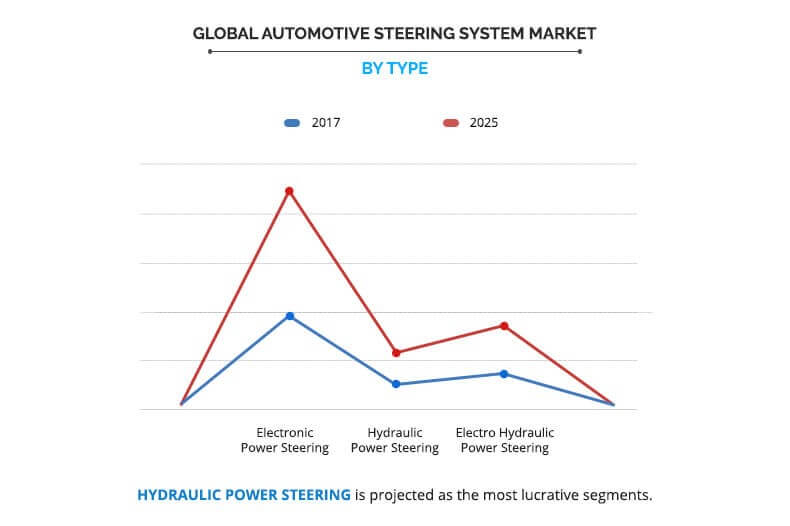
global automotive steering system market by type

Increase in demand for automotive

The global automotive market is observed for continuous growth as the market experiences continuous demand for vehicles. The developing countries such as India, China, and Brazil among others are the most demanding countries for automotive sector. China, being the world’s largest market for vehicles, is expected to grow further over few years as most OEMs are also making large investments in this sector. The increase in demand for vehicles in automotive sector explicitly results in rise in demand for steering system as every automobile needs steering system to control vehicle direction. Also, the vehicle accident may lead to change in steering system or its component which leads to increase in demand for steering system in the aftermarket. Hence, the increase in demand for vehicle is anticipated to increase the demand for steering system in near future.

Adoption of power steering system

The automotive industry has developed from manual steering systems, which use only mechanical linkages such as rack and pinion, to power steering system. The manual steering system has limitations regarding maneuverability and fuel efficiency of vehicle. However, the power steering system has hydraulics and electronic components, which assist the driving and simultaneously improve the efficiency of the vehicle. Hence, the power steering system has been widely accepted all across the globe. The increase in adoption of power-assisted steering is responsible for increase in demand for steering system in the automotive industry.

High cost associated with power steering system

Power steering system is widely used in different types of vehicles such as passenger cars, light commercial vehicles, and heavy commercial vehicles. The power steering system has either electronic motor or hydraulic piston depending upon the system used in the vehicle as compared to manual steering system. These parts are costlier, which increases the price of the steering system. High cost of power steering system is responsible for the hike in the car prices. Hence, high cost associated with power steering system is expected to inhibit the growth of the power steering system market.

Consumer preference toward driving comfort

The consumers demand maximum features in their vehicle from manufacturer including power steering system that makes vehicle more responsive resulting in increase in driving comfort and drive quality. The developing countries such as China and India have uneven road conditions, which need better steering mechanism to improve the drive quality. Along with this, developed countries such as the U.S., the UK, and Germany have freeways where vehicles need adaptive steering system to control the vehicles running at high speeds. These factors also make the drive comfortable for consumers. Hence, the automotive steering system market is expected to grow as the consumers prefer to choose driving comfort.

Key Benefits for Automotive Steering System Market:

  • This study presents the analytical depiction of the automotive steering system market analysis along with the current trends and future estimations to depict the imminent investment pockets.
  • The overall market potential is determined to understand the profitable trends to gain a stronger foothold.
  • The report presents information related to the key drivers, restraints, and opportunities of the market with a detailed impact analysis.
  • The current market is quantitatively analyzed from 2018 to 2025 to benchmark the financial competency.
  • Porter’s five forces analysis illustrates the potency of the buyers and suppliers in the industry.

Automotive Steering System Market Report Highlights

Aspects Details
By Type
  • Electronic Power Steering
  • Hydraulic Power Steering
  • Electro Hydraulic Power Steering
By Vehicle Type
  • Passenger Vehicle
  • Commercial Vehicle
    • Light Commercial vehicles
    • Heavy commercial vehicles
By Region
  • North America  (U.S., Canada, Mexico)
  • Europe  (U.K., Germany, France, Russia, Rest of Europe)
  • Asia-Pacific  (China, Japan, India, Australia, Rest of Asia-Pacific)
  • LAMEA  (Latin America, Middle East, Africa)
Key Market Players China Automotive Systems, Inc, Mitsubishi Electric Corporation, Showa Corporation, NSK Ltd., Nexteer Automotive Group Limited, Hyundai Mobis Co., Ltd, Mando Corporation, Robert Bosch GmbH, JTEKT Corporation, Thyssenkrupp AG
 

CHAPTER 1:    INTRODUCTION

1.1.    Report description
1.2.    Key benefits for stakeholders
1.3.    Key market segments
1.4.    Research methodology

1.4.1.    Primary research
1.4.2.    Secondary research
1.4.3.    Analyst tools and models

CHAPTER 2:    EXECUTIVE SUMMARY

2.1.    CXO perspective

CHAPTER 3:    MARKET OVERVIEW

3.1.    Market definition and scope
3.2.    Key findings

3.2.1.    Top impacting factors
3.2.2.    Top investment pockets
3.2.3.    Top winning strategies

3.3.    Porter’s five forces analysis
3.4.    Market share analysis (2017)
3.5.    Market dynamics

3.5.1.    Drivers

3.5.1.1.    Increasing demand of automotive
3.5.1.2.    Adoption of power steering system

3.5.2.    Restraint

3.5.2.1.    High cost associated with power steering system
3.5.2.2.    Low Penetration of Power steering in Low Segment Vehicles

3.5.3.    Opportunities

3.5.3.1.    Globe Introduction of Drive-by-wire
3.5.3.2.    Increase in sale of automotive vehicles
3.5.3.3.    Consumer preference towards driving comfort

CHAPTER 4:    AUTOMOTIVE STEERING SYSTEM MARKET, BY TYPE

4.1.    Overview
4.2.    ELECTRONIC POWER STEERING

4.2.1.    Key market trends, growth factors and opportunities
4.2.2.    Market size and forecast, by region
4.2.3.    Market analysis by country

4.3.    HYDRAULIC POWER STEERING

4.3.1.    Key market trends, growth factors, and opportunities
4.3.2.    Market size and forecast, by region
4.3.3.    Market analysis by country

4.4.    ELECTRO-HYDRAULIC POWER STEERING

4.4.1.    Key market trends, growth factors, and opportunities
4.4.2.    Market size and forecast, by region
4.4.3.    Market analysis by country

CHAPTER 5:    AUTOMOTIVE STEERING SYSTEM MARKET, BY VEHICLE TYPE

5.1.    Overview
5.2.    Passenger Vehicles

5.2.1.    Key market trends, growth factors and opportunities
5.2.2.    Market size and forecast, by region
5.2.3.    Market analysis by country

5.3.    Commercial vehicles

5.3.1.    Key market trends, growth factors, and opportunities
5.3.2.    Market size and forecast, by region
5.3.3.    Light Commercial vehicles
5.3.4.    Heavy commercial vehicles
5.3.5.    Market analysis by country

CHAPTER 6:    AUTOMOTIVE STEERING SYSTEM MARKET, BY REGION

6.1.    Overview
6.2.    North America

6.2.1.    Key market trends, growth factors, and opportunities
6.2.2.    Market size and forecast, by type
6.2.3.    Market size and forecast, by vehicle type
6.2.4.    Market analysis by country

6.2.4.1.    U.S.

6.2.4.1.1.    Market size and forecast, by type
6.2.4.1.2.    Market size and forecast, by vehicle type

6.2.4.2.    Canada

6.2.4.2.1.    Market size and forecast, by type
6.2.4.2.2.    Market size and forecast, by vehicle type

6.2.4.3.    Mexico

6.2.4.3.1.    Market size and forecast, by type
6.2.4.3.2.    Market size and forecast, by vehicle type

6.3.    Europe

6.3.1.    Key market trends, growth factors, and opportunities
6.3.2.    Market size and forecast, by type
6.3.3.    Market size and forecast, by vehicle type
6.3.4.    Market analysis by country

6.3.4.1.    U.K.

6.3.4.1.1.    Market size and forecast, by type
6.3.4.1.2.    Market size and forecast, by vehicle type

6.3.4.2.    Germany

6.3.4.2.1.    Market size and forecast, by type
6.3.4.2.2.    Market size and forecast, by vehicle type

6.3.4.3.    France

6.3.4.3.1.    Market size and forecast, by type
6.3.4.3.2.    Market size and forecast, by vehicle type

6.3.4.4.    Russia

6.3.4.4.1.    Market size and forecast, by type
6.3.4.4.2.    Market size and forecast, by vehicle type

6.3.4.5.    Rest of Europe

6.3.4.5.1.    Market size and forecast, by type
6.3.4.5.2.    Market size and forecast, by vehicle type

6.4.    Asia-Pacific

6.4.1.    Key market trends, growth factors, and opportunities
6.4.2.    Market size and forecast, by type
6.4.3.    Market size and forecast, by vehicle type
6.4.4.    Market analysis by country

6.4.4.1.    China

6.4.4.1.1.    Market size and forecast, by type
6.4.4.1.2.    Market size and forecast, by vehicle type

6.4.4.2.    Japan

6.4.4.2.1.    Market size and forecast, by type
6.4.4.2.2.    Market size and forecast, by vehicle type

6.4.4.3.    India

6.4.4.3.1.    Market size and forecast, by type
6.4.4.3.2.    Market size and forecast, by vehicle type

6.4.4.4.    Australia

6.4.4.4.1.    Market size and forecast, by type
6.4.4.4.2.    Market size and forecast, by vehicle type

6.4.4.5.    Rest of Asia-Pacific

6.4.4.5.1.    Market size and forecast, by type
6.4.4.5.2.    Market size and forecast, by vehicle type

6.5.    LAMEA

6.5.1.    Key market trends, growth factors, and opportunities
6.5.2.    Market size and forecast, by type
6.5.3.    Market size and forecast, by vehicle type
6.5.4.    Market analysis by country

6.5.4.1.    Latin America

6.5.4.1.1.    Market size and forecast, by type
6.5.4.1.2.    Market size and forecast, by vehicle type

6.5.4.2.    Middle East

6.5.4.2.1.    Market size and forecast, by type
6.5.4.2.2.    Market size and forecast, by vehicle type

6.5.4.3.    Africa

6.5.4.3.1.    Market size and forecast, by type
6.5.4.3.2.    Market size and forecast, by vehicle type

CHAPTER 7:    COMPANY PROFILES

7.1.    China Automotive Systems, Inc.

7.1.1.    Company overview
7.1.2.    Company snapshot
7.1.3.    Operating business segments
7.1.4.    Product portfolio
7.1.5.    Business performance
7.1.6.    Key strategic moves and developments

7.2.    Hyundai Mobis Co., Ltd

7.2.1.    Company overview
7.2.2.    Company snapshot
7.2.3.    Operating business segments
7.2.4.    Product portfolio
7.2.5.    Business performance
7.2.6.    Key strategic moves and developments

7.3.    JTEKT Corporation

7.3.1.    Company overview
7.3.2.    Company snapshot
7.3.3.    Operating business segments
7.3.4.    Product portfolio
7.3.5.    Business performance
7.3.6.    Key strategic moves and developments

7.4.    Mando Corporation

7.4.1.    Company overview
7.4.2.    Company snapshot
7.4.3.    Product portfolio
7.4.4.    Business performance
7.4.5.    Key strategic moves and developments

7.5.    Mitsubishi Electric Corporation

7.5.1.    Company overview
7.5.2.    Company snapshot
7.5.3.    Operating business segments
7.5.4.    Product portfolio
7.5.5.    Business performance

7.6.    Nexteer Automotive Group Limited

7.6.1.    Company overview
7.6.2.    Company snapshot
7.6.3.    Operating business segments
7.6.4.    Product portfolio
7.6.5.    Business performance
7.6.6.    Key strategic moves and developments

7.7.    NSK Ltd.

7.7.1.    Company overview
7.7.2.    Company snapshot
7.7.3.    Operating business segments
7.7.4.    Product portfolio
7.7.5.    Business performance
7.7.6.    Key strategic moves and developments

7.8.    Robert Bosch GmbH

7.8.1.    Company overview
7.8.2.    Company snapshot
7.8.3.    Operating business segments
7.8.4.    Product portfolio
7.8.5.    Business performance
7.8.6.    Key strategic moves and developments

7.9.    Showa Corporation

7.9.1.    Company overview
7.9.2.    Company snapshot
7.9.3.    Operating business segments
7.9.4.    Product portfolio
7.9.5.    Business performance

7.10.    Thyssenkrupp AG

7.10.1.    Company overview
7.10.2.    Company snapshot
7.10.3.    Operating business segments
7.10.4.    Product portfolio
7.10.5.    Business performance
7.10.6.    Key strategic moves and developments

LIST OF TABLES

TABLE 01.    GLOBAL AUTOMOTIVE STEERING SYSTEM MARKET, BY TYPE, 2017-2025($MILLION)
TABLE 02.    AUTOMOTIVE STEERING SYSTEM MARKET REVENUE FOR ELECTRONIC POWER STEERING, BY REGION 2017-2025 ($MILLION)
TABLE 03.    AUTOMOTIVE STEERING SYSTEM MARKET REVENUE FOR HYDRAULIC POWER STEERING, BY REGION 2017-2025 ($MILLION)
TABLE 04.    AUTOMOTIVE STEERING SYSTEM MARKET REVENUE FOR ELECTRO-HYDRAULIC POWER STEERING, BY REGION 2017–2025 ($MILLION)
TABLE 05.    GLOBAL AUTOMOTIVE STEERING SYSTEM MARKET, BY VEHICLE TYPE, 2017-2025($MILLION)
TABLE 06.    AUTOMOTIVE STEERING SYSTEM MARKET REVENUE FOR PASSENGER VEHICLES, BY REGION 2017-2025 ($MILLION)
TABLE 07.    AUTOMOTIVE STEERING SYSTEM MARKET REVENUE FOR NLP, BY REGION 2017-2025 ($MILLION)
TABLE 08.    NORTH AMERICAN AUTOMOTIVE STEERING SYSTEM MARKET, BY TYPE, 2017–2025 ($MILLION)
TABLE 09.    NORTH AMERICAN AUTOMOTIVE STEERING SYSTEM MARKET, BY VEHICLE TYPE, 2017–2025 ($MILLION)
TABLE 10.    U. S. AUTOMOTIVE STEERING SYSTEM MARKET, BY TYPE, 2017–2025 ($MILLION)
TABLE 11.    U. S. AUTOMOTIVE STEERING SYSTEM MARKET, BY VEHICLE TYPE, 2017–2025 ($MILLION)
TABLE 12.    CANADA AUTOMOTIVE STEERING SYSTEM MARKET, BY TYPE, 2017–2025 ($MILLION)
TABLE 13.    CANADA AUTOMOTIVE STEERING SYSTEM MARKET, BY VEHICLE TYPE, 2017–2025 ($MILLION)
TABLE 14.    MEXICO AUTOMOTIVE STEERING SYSTEM MARKET, BY TYPE, 2017–2025 ($MILLION)
TABLE 15.    MEXICO AUTOMOTIVE STEERING SYSTEM MARKET, BY VEHICLE TYPE, 2017–2025 ($MILLION)
TABLE 16.    EUROPEAN AUTOMOTIVE STEERING SYSTEM MARKET, BY TYPE, 2017–2025 ($MILLION)
TABLE 17.    EUROPEAN AUTOMOTIVE STEERING SYSTEM MARKET, BY VEHICLE TYPE, 2017–2025 ($MILLION)
TABLE 18.    U.K. AUTOMOTIVE STEERING SYSTEM MARKET, BY TYPE, 2017–2025 ($MILLION)
TABLE 19.    U.K. AUTOMOTIVE STEERING SYSTEM MARKET, BY VEHICLE TYPE, 2017–2025 ($MILLION)
TABLE 20.    GERMANY AUTOMOTIVE STEERING SYSTEM MARKET, BY TYPE, 2017–2025 ($MILLION)
TABLE 21.    GERMANY AUTOMOTIVE STEERING SYSTEM MARKET, BY VEHICLE TYPE, 2017–2025 ($MILLION)
TABLE 22.    FRANCE AUTOMOTIVE STEERING SYSTEM MARKET, BY TYPE, 2017–2025 ($MILLION)
TABLE 23.    FRANCE AUTOMOTIVE STEERING SYSTEM MARKET, BY VEHICLE TYPE, 2017–2025 ($MILLION)
TABLE 24.    RUSSIA AUTOMOTIVE STEERING SYSTEM MARKET, BY TYPE, 2017–2025 ($MILLION)
TABLE 25.    RUSSIA AUTOMOTIVE STEERING SYSTEM MARKET, BY VEHICLE TYPE, 2017–2025 ($MILLION)
TABLE 26.    REST OF EUROPE AUTOMOTIVE STEERING SYSTEM MARKET, BY TYPE, 2017–2025 ($MILLION)
TABLE 27.    REST OF EUROPE AUTOMOTIVE STEERING SYSTEM MARKET, BY VEHICLE TYPE, 2017–2025 ($MILLION)
TABLE 28.    ASIA-PACIFIC AUTOMOTIVE STEERING SYSTEM MARKET, BY TYPE, 2017–2025 ($MILLION)
TABLE 29.    ASIA-PACIFIC AUTOMOTIVE STEERING SYSTEM MARKET, BY VEHICLE TYPE, 2017–2025 ($MILLION)
TABLE 30.    CHINA AUTOMOTIVE STEERING SYSTEM MARKET, BY TYPE, 2017–2025 ($MILLION)
TABLE 31.    CHINA AUTOMOTIVE STEERING SYSTEM MARKET, BY VEHICLE TYPE, 2017–2025 ($MILLION)
TABLE 32.    JAPAN AUTOMOTIVE STEERING SYSTEM MARKET, BY TYPE, 2017–2025 ($MILLION)
TABLE 33.    JAPAN AUTOMOTIVE STEERING SYSTEM MARKET, BY VEHICLE TYPE, 2017–2025 ($MILLION)
TABLE 34.    INDIA AUTOMOTIVE STEERING SYSTEM MARKET, BY TYPE, 2017–2025 ($MILLION)
TABLE 35.    INDIA AUTOMOTIVE STEERING SYSTEM MARKET, BY VEHICLE TYPE, 2017–2025 ($MILLION)
TABLE 36.    AUSTRALIA AUTOMOTIVE STEERING SYSTEM MARKET, BY TYPE, 2017–2025 ($MILLION)
TABLE 37.    AUSTRALIA AUTOMOTIVE STEERING SYSTEM MARKET, BY VEHICLE TYPE, 2017–2025 ($MILLION)
TABLE 38.    REST OF ASIA-PACIFIC AUTOMOTIVE STEERING SYSTEM MARKET, BY TYPE, 2017–2025 ($MILLION)
TABLE 39.    REST OF ASIA-PACIFIC AUTOMOTIVE STEERING SYSTEM MARKET, BY VEHICLE TYPE, 2017–2025 ($MILLION)
TABLE 40.    LAMEA AUTOMOTIVE STEERING SYSTEM MARKET, BY TYPE, 2017–2025 ($MILLION)
TABLE 41.    LAMEA AUTOMOTIVE STEERING SYSTEM MARKET, BY VEHICLE TYPE, 2017–2025 ($MILLION)
TABLE 42.    LATIN AMERICA AUTOMOTIVE STEERING SYSTEM MARKET, BY TYPE, 2017–2025 ($MILLION)
TABLE 43.    LATIN AMERICA AUTOMOTIVE STEERING SYSTEM MARKET, BY VEHICLE TYPE, 2017–2025 ($MILLION)
TABLE 44.    MIDDLE EAST AUTOMOTIVE STEERING SYSTEM MARKET, BY TYPE, 2017–2025 ($MILLION)
TABLE 45.    MIDDLE EAST AUTOMOTIVE STEERING SYSTEM MARKET, BY VEHICLE TYPE, 2017–2025 ($MILLION)
TABLE 46.    AFRICA AUTOMOTIVE STEERING SYSTEM MARKET, BY TYPE, 2017–2025 ($MILLION)
TABLE 47.    AFRICA AUTOMOTIVE STEERING SYSTEM MARKET, BY VEHICLE TYPE, 2017–2025 ($MILLION)
TABLE 01.    CHINA AUTOMOTIVE SYSTEMS, INC: COMPANY SNAPSHOT
TABLE 02.    CHINA AUTOMOTIVE SYSTEMS, INC: OPERATING SEGMENTS
TABLE 03.    CHINA AUTOMOTIVE SYSTEMS, INC: PRODUCT PORTFOLIO
TABLE 04.    HYUNDAI MOBIS CO., LTD: COMPANY SNAPSHOT
TABLE 05.    HYUNDAI MOBIS CO., LTD: OPERATING SEGMENTS
TABLE 06.    HYUNDAI MOBIS CO., LTD: PRODUCT PORTFOLIO
TABLE 07.    JTEKT CORPORATION: COMPANY SNAPSHOT
TABLE 08.    JTEKT CORPORATION: OPERATING SEGMENTS
TABLE 09.    JTEKT CORPORATION: PRODUCT PORTFOLIO
TABLE 10.    MANDO CORPORATION: COMPANY SNAPSHOT
TABLE 11.    MANDO CORPORATION: PRODUCT PORTFOLIO
TABLE 12.    MITSUBISHI: COMPANY SNAPSHOT
TABLE 13.    MITSUBISHI: OPERATING SEGMENTS
TABLE 14.    MITSUBISHI: PRODUCT PORTFOLIO
TABLE 15.    NEXTEER AUTOMOTIVE GROUP LIMITED: COMPANY SNAPSHOT
TABLE 16.    NEXTEER AUTOMOTIVE GROUP LIMITED: PRODUCT CATEGORIES
TABLE 17.    NEXTEER AUTOMOTIVE GROUP LIMITED: PRODUCT PORTFOLIO
TABLE 18.    NSK LTD: COMPANY SNAPSHOT
TABLE 19.    NSK LTD: OPERATING SEGMENTS
TABLE 20.    NSK LTD: PRODUCT PORTFOLIO
TABLE 21.    ROBERT BOSCH GMBH: PRODUCT PORTFOLIO
TABLE 22.    SHOWA CORPORATION: COMPANY SNAPSHOT
TABLE 23.    SHOWA CORPORATION: OPERATING SEGMENTS
TABLE 24.    SHOWA CORPORATION: PRODUCT PORTFOLIO
TABLE 25.    THYSSENKRUPP AG: COMPANY SNAPSHOT
TABLE 26.    THYSSENKRUPP AG: OPERATING SEGMENTS
TABLE 27.    THYSSENKRUPP AG: PRODUCT PORTFOLIO

LIST OF FIGURES

FIGURE 01.    KEY MARKET SEGMENTS
FIGURE 02.    EXECUTIVE SUMMARY
FIGURE 03.    EXECUTIVE SUMMARY
FIGURE 04.    TOP IMPACTING FACTORS
FIGURE 05.    TOP INVESTMENT POCKETS
FIGURE 06.    TOP WINNING STRATEGIES, BY YEAR, 2016–2018*
FIGURE 07.    TOP WINNING STRATEGIES, BY YEAR, 2016–2018*
FIGURE 08.    TOP WINNING STRATEGIES, BY COMPANY, 2016–2018*
FIGURE 09.    MODERATE-TO-HIGH BARGAINING POWER OF SUPPLIERS
FIGURE 10.    MODERATE-TO-HIGH THREAT OF NEW ENTRANTS
FIGURE 11.    MODERATE THREAT OF SUBSTITUTES
FIGURE 12.    HIGH-TO-MODERATE INTENSITY OF RIVALRY
FIGURE 13.    HIGH-TO-MODERATE BARGAINING POWER OF BUYERS
FIGURE 14.    MARKET SHARE ANALYSIS (2017)
FIGURE 15.    GLOBAL AUTOMOTIVE STEERING SYSTEM MARKET SHARE, BY TYPE, 2017–2025 (%)
FIGURE 16.    COMPARATIVE SHARE ANALYSIS OF AUTOMOTIVE STEERING SYSTEM MARKET FOR ELECTRONIC POWER STEERING, BY COUNTRY, 2017 & 2025 (%)
FIGURE 17.    COMPARATIVE SHARE ANALYSIS OF AUTOMOTIVE STEERING SYSTEM MARKET FOR HYDRAULIC POWER STEERING, BY COUNTRY, 2017 & 2025 (%)
FIGURE 18.    COMPARATIVE SHARE ANALYSIS OF AUTOMOTIVE STEERING SYSTEM MARKET FOR ELECTRO-HYDRAULIC POWER STEERING, BY COUNTRY, 2017 & 2025 (%)
FIGURE 19.    GLOBAL AUTOMOTIVE STEERING SYSTEM MARKET SHARE, BY VEHICLE TYPE, 2017–2025 (%)
FIGURE 20.    COMPARATIVE SHARE ANALYSIS OF AUTOMOTIVE STEERING SYSTEM MARKET FOR PASSENGER VEHICLES, BY COUNTRY, 2017 & 2025 (%)
FIGURE 21.    GLOBAL AUTOMOTIVE STEERING SYSTEM MARKET SHARE, BY LIGHT COMMERCIAL VEHICLES, 2017–2025 (%)
FIGURE 22.    GLOBAL AUTOMOTIVE STEERING SYSTEM MARKET SHARE, BY HEAVY COMMERCIAL VEHICLES, 2017–2025 (%)
FIGURE 23.    COMPARATIVE SHARE ANALYSIS OF AUTOMOTIVE STEERING SYSTEM MARKET FOR NLP, BY COUNTRY, 2017 & 2025 (%)
FIGURE 24.    AUTOMOTIVE STEERING SYSTEM MARKET, BY REGION, 2017-2025 (%)
FIGURE 25.    COMPARATIVE SHARE ANALYSIS OF AUTOMOTIVE STEERING SYSTEM MARKET, BY COUNTRY, 2017–2025 (%)
FIGURE 26.    U. S. AUTOMOTIVE STEERING SYSTEM MARKET, 2017–2025 ($MILLION)
FIGURE 27.    CANADA AUTOMOTIVE STEERING SYSTEM MARKET, 2017–2025 ($MILLION)
FIGURE 28.    MEXICO AUTOMOTIVE STEERING SYSTEM MARKET, 2017–2025 ($MILLION)
FIGURE 29.    COMPARATIVE SHARE ANALYSIS OF AUTOMOTIVE STEERING SYSTEM MARKET, BY COUNTRY, 2017–2025 (%)
FIGURE 30.    U.K. AUTOMOTIVE STEERING SYSTEM MARKET, 2017–2025 ($MILLION)
FIGURE 31.    GERMANY AUTOMOTIVE STEERING SYSTEM MARKET, 2017–2025 ($MILLION)
FIGURE 32.    FRANCE AUTOMOTIVE STEERING SYSTEM MARKET, 2017–2025 ($MILLION)
FIGURE 33.    RUSSIA AUTOMOTIVE STEERING SYSTEM MARKET, 2017–2025 ($MILLION)
FIGURE 34.    REST OF EUROPE AUTOMOTIVE STEERING SYSTEM MARKET, 2017–2025 ($MILLION)
FIGURE 35.    COMPARATIVE SHARE ANALYSIS OF AUTOMOTIVE STEERING SYSTEM MARKET, BY COUNTRY, 2017–2025 (%)
FIGURE 36.    CHINA AUTOMOTIVE STEERING SYSTEM MARKET, 2017–2025 ($MILLION)
FIGURE 37.    JAPAN AUTOMOTIVE STEERING SYSTEM MARKET, 2017–2025 ($MILLION)
FIGURE 38.    INDIA AUTOMOTIVE STEERING SYSTEM MARKET, 2017–2025 ($MILLION)
FIGURE 39.    AUSTRALIA AUTOMOTIVE STEERING SYSTEM MARKET, 2017–2025 ($MILLION)
FIGURE 40.    REST OF ASIA-PACIFIC AUTOMOTIVE STEERING SYSTEM MARKET, 2017–2025 ($MILLION)
FIGURE 41.    COMPARATIVE SHARE ANALYSIS OF AUTOMOTIVE STEERING SYSTEM MARKET, BY COUNTRY, 2017–2025 (%)
FIGURE 42.    LATIN AMERICA AUTOMOTIVE STEERING SYSTEM MARKET, 2017–2025 ($MILLION)
FIGURE 43.    MIDDLE EAST AUTOMOTIVE STEERING SYSTEM MARKET, 2017–2025 ($MILLION)
FIGURE 44.    AFRICA AUTOMOTIVE STEERING SYSTEM MARKET, 2017–2025 ($MILLION)
FIGURE 01.    CHINA AUTOMOTIVE SYSTEMS, INC: REVENUE, 2015–2017 ($MILLION)
FIGURE 02.    CHINA AUTOMOTIVE SYSTEMS, INC: REVENUE SHARE BY SEGMENT, 2017 (%)
FIGURE 03.    CHINA AUTOMOTIVE SYSTEMS, INC: REVENUE SHARE BY GEOGRAPHY, 2017 (%)
FIGURE 04.    HYUNDAI MOBIS CO., LTD: REVENUE, 2015–2017 ($MILLION)
FIGURE 05.    HYUNDAI MOBIS CO., LTD: REVENUE SHARE BY SEGMENT, 2017 (%)
FIGURE 06.    HYUNDAI MOBIS CO., LTD: REVENUE SHARE BY GEOGRAPHY, 2017 (%)
FIGURE 07.    JTEKT CORPORATION: REVENUE, 2015–2017 ($MILLION)
FIGURE 08.    JTEKT CORPORATION: REVENUE SHARE BY SEGMENT, 2017 (%)
FIGURE 09.    JTEKT CORPORATION: REVENUE SHARE BY GEOGRAPHY, 2017 (%)
FIGURE 10.    MANDO CORPORATION: REVENUE, 2015–2017 ($MILLION)
FIGURE 11.    MANDO CORPORATION: REVENUE SHARE BY GEOGRAPHY, 2017 (%)
FIGURE 12.    MITSUBISHI: REVENUE, 2016–2018 ($MILLION)
FIGURE 13.    MITSUBISHI: REVENUE SHARE BY SEGMENT, 2018 (%)
FIGURE 14.    MITSUBISHI: REVENUE SHARE BY REGION, 2018 (%)
FIGURE 15.    NEXTEER AUTOMOTIVE GROUP LIMITED: REVENUE, 2015–2017 ($MILLION)
FIGURE 16.    NEXTEER AUTOMOTIVE GROUP LIMITED: REVENUE SHARE BY SEGMENT, 2017 (%)
FIGURE 17.    NEXTEER AUTOMOTIVE GROUP LIMITED: REVENUE SHARE BY GEOGRAPHY, 2017 (%)
FIGURE 18.    NSK LTD: REVENUE, 2016–2018 ($MILLION)
FIGURE 19.    NSK LTD: REVENUE SHARE BY SEGMENT, 2018 (%)
FIGURE 20.    NSK LTD: REVENUE SHARE BY GEOGRAPHY, 2018 (%)
FIGURE 21.    ROBERT BOSCH GMBH: REVENUE, 2015–2017 ($MILLION)
FIGURE 22.    ROBERT BOSCH GMBH: REVENUE BY SEGMENT, 2017 (%)
FIGURE 23.    ROBERT BOSCH GMBH: REVENUE SHARE BY REGION, 2017 (%)
FIGURE 24.    SHOWA CORPORATION: REVENUE, 2016–2018 ($MILLION)
FIGURE 25.    SHOWA CORPORATION: REVENUE SHARE BY SEGMENT, 2018 (%)
FIGURE 26.    THYSSENKRUPP AG: REVENUE, 2016–2018 ($MILLION)
FIGURE 27.    THYSSENKRUPP AG: REVENUE SHARE BY SEGMENT, 2018 (%)
FIGURE 28.    THYSSENKRUPP AG: REVENUE SHARE BY GEOGRAPHY, 2018 (%)


An automotive steering system is a set of components used to control the direction of vehicle motion and help the driver maneuver the vehicle as per the requirement. The hand-operated steering wheel, steering column, universal joints, and rack & pinion mechanism contribute to the automotive steering system component. The automotive steering system market is in its maturity stage and is contributing significant revenue for the overall automotive industry.

Increase in demand for automotive owing to rise in disposable income of consumers drives the growth of the market. Along with this, the adoption of power steering system in vehicles is responsible for the growth of this market. The effective steering system is accountable for increase in fuel efficiency of the vehicle. Hence, the increase in demand for fuel efficient vehicle results in rise in requirement of steering system. Also, the consumers prefer driving comfort in their vehicles which includes the effortless driving and maneuverability of the vehicle. The driving comfort is achieved by using effective steering system resulting in increase in demand for steering system implementing the growth of this market. However, the high cost associated with power steering system is anticipated to hamper the growth of the steering system market.

Among the analyzed geographical regions, currently, Asia Pacific is the highest revenue contributor and is expected to dominate during the forecast period, followed by Europe, North America, and LAMEA. This growth is attributed to the increase in demand for automotive sector for various types of vehicles ranging from low-end passenger cars to high-end commercial vehicles.


PURCHASE OPTIONS

Call or Email us

U.S.-Canada Toll-free: +1-800-792-5285
Int'l : +1-503-894-6022
Europe : +44-845-528-1300
Email : help@alliedmarketresearch.com

Looking for Customization?

 Customization Request

Have a Question?

 Speak with Analyst

Any Confusion?

 Inquire Before Buying

Have a glance of the Report

  Request Sample
RELATED TAGS

Purchase Full Report of
Automotive Steering System Market

Start reading instantly.
This Report and over 66,965+ more Reports, Available with Avenue Library. T&C*.

  • Online Only
  • $3,456
  • Online cloud access only
  • Restricted print, copy, paste & download
  • Read only
  • Free industry update
    (Within 180 days)
  • Free report update in next update cycle
    (Dec 2019 - Dec 2020)
  • Data Pack
  • $3,840
  • Restricted to one authorized user
  • One print only
  • Available in
    Excel
  • Free industry update
    (Within 180 days)
  •   Free report update in next update cycle
    (Dec 2019 - Dec 2020)
  • Single User
  • $5,769
  • Restricted to one authorized user
  • One print only
  • Available in
    PDF
  • Free industry update
    (Within 180 days)
  •   Free report update in next update cycle
    (Dec 2019 - Dec 2020)
  • Five Users
  • $6,450
  • Limited to five authorized users
  • Print upto five copies
  • Available in
    PDF
  • Free industry update
    (Within 180 days)
  •   Free report update in next update cycle
    (Dec 2019 - Dec 2020)
  • Enterprise
    License/PDF

  • $10,995
  • Unlimited
    within
    company/enterprise
  • Available in Excel & PDF
  • Free industry update
    (Within 180 days)
  •   Free report update in next update cycle
    (Dec 2019 - Dec 2020)
  • Library
    Membership

  • $999 $ 1,175
    Per User/ Per month/ Billed annually
  • Published Content
    E-access
  • Company Profiles
    E-access
  • Newly Added Content Access
  • 10 PDF
    Downloads
  • 5 Excel Data
    Pack Downloads
  • 250 Company Profiles PDF Downloads
  • Buy Now

*Taxes/Fees, if applicable will be added during checkout. All prices in USD

RELATED REPORTS
 

Why Allied Market Research?


Infallible Methodology

To ensure high-level data integrity, accurate analysis, and impeccable forecasts

Analyst Support

For complete satisfaction

Customization

On-demand customization of scope of the report to exactly meet your needs

TARGETED MARKET VIEW

Targeted market view to provide pertinent information and save time of readers

Get fresh content delivered

Get insights on topics that are crucial for your business. Stay abreast of your interest areas.

Get Industry Data Alerts

Why Allied Market Research?

Infallible Methodology

To ensure high-level data integrity, accurate analysis, and impeccable forecasts

Analyst Support

For complete satisfaction

Customization

On-demand customization of scope of the report to exactly meet your needs

TARGETED MARKET VIEW

Targeted market view to provide pertinent information and save time of readers