
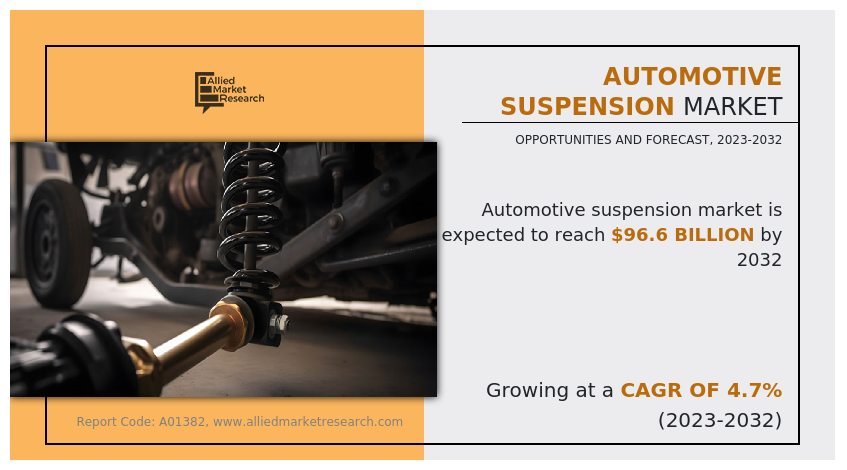
The global automotive suspension market size was esteemed at $61,566.00 million in 2022 and is estimated to reach $96,562.10 million by 2032, exhibiting a CAGR of 4.7% from 2023 to 2032.
Report Key Highlighters:
- The automotive suspension market study covers 14 countries. The research includes regional and segment analysis of each country in terms of value ($million) for the projected period 2023-2032.
- The study integrated high-quality data, professional opinions and analysis, and critical independent perspectives. The research approach is intended to provide a balanced view of global markets and to assist stakeholders in making educated decisions in order to achieve their most ambitious growth objectives.
- Over 3,700 product literature, annual reports, industry statements, and other comparable materials from major industry participants were reviewed to gain a better understanding of the market.
- The automotive suspension market share is highly fragmented, into several players including Continental AG, Fox Factory, Inc., Gabriel India Limited, Hendrickson USA, L.L.C., KYB Corporation, Mando Corporation, Sogefi S.p.A., Tenneco INC., Wabco Holding Inc., and Thyssenkrupp AG. The companies have adopted strategies such as product launch, contract, expansion, agreement, and others to improve their market positioning.
Automotive suspension consists of a system of spring, shock absorbers, struts, control arms, and ball joints that connect the vehicle to the wheel and subsequently enable relative motion between the two. The type of geometry and system used to build suspension depends on the camber of wheel, castor of hub, toe of the vehicle, and king pin inclination of the control arms. Suspensions aid in keeping the vehicle tires in contact with the road during the ride to reduce shocks during driving and protect the vehicle and its cargo from any damage or wear. In addition, it provides isolation to the vehicle from high-frequency vibrations from tire excitation.
A quality ride provides comfort to passengers, minimizes damage to cargo, and reduces driver fatigue during long journeys. Suspension is responsible for the quality of rides and control on car handling, as cars with firm suspension could result in enhanced control of body movements and quicker reactions. Ambulances have a special need for enhanced vehicle suspension to prevent further injury to already ill passengers. Such factors have boosted the demand for higher driving comfort, which positively impacts the growth of the global automotive suspension market.
Factors such as technological advancements related to vehicular components, rise in production of vehicles, and increase in demand for luxury & comfort in vehicles are the factors expected to drive the growth of the global automotive suspension market. However, factors such as improvement in global standards for vehicles and high maintenance cost of advanced suspension systems are anticipated to hamper the growth of the market. Besid, rise in requirement for lightweight suspension systems in luxury vehicles and the development of advanced suspension systems such as electric control active suspension systems are expected to provide lucrative opportunities for the automotive suspension industry manufacturers

In addition, there has been a growing trend in the use of higher quality materials and technologies such as electronically controlled suspension systems, auto adaptive dampening methods or air suspensions that make driving more pleasant and flexible. Such advances are not only improving vehicle quality but also contributing to lowering fuel consumption and emissions, in line with the environment concerns and regulations.
Over the years, various factors such as increased production of vehicles, advances in suspension technology, changes in consumer tastes and focus on improved vehicle performance and security have led to significant growth across the world market for passenger car suspensions. The growth in demand for passenger cars, commercial vehicles and sports utility vehicles on a global scale is behind the expansion of the market. As urbanization continues, more people are moving to cities, leading to increased road congestion and the need for vehicles with improved suspension systems to ensure a smoother and safer ride.
In addition, automotive manufacturers have been encouraged to invest in innovative suspension solutions that improve vehicle performance and occupant safety due to strict government legislation and safety standards. In order to provide a better and personalised driving experience, there has been an increased use of advanced materials and technology such as electronically controlled suspension systems, Adaptive Damping Systems or Air Suspensions. These advancements have not only improved ride quality but also contributed to reduced fuel consumption and emissions, aligning with environmental concerns and regulations.

Furthermore, the increasing trend of electric and autonomous vehicles has introduced new challenges and opportunities for the suspension market. Electric vehicles require specialized suspension systems to manage the weight of batteries and optimize energy efficiency, while autonomous vehicles benefit from precise control over suspension dynamics for improved passenger comfort and safety.
The global automotive suspension market is segmented into system, component, geometry, suspension type, vehicle type, and region. On the basis of system, the market is categorized into passive system and semi-active/active system. Depending on component, it is classified into spring, shock dampener, struts, control arms, ball joint, air compressor, and leaf spring. By geometry, it is segregated into dependent, semi-independent, and independent suspension. According to suspension type, it is fragmented into hydraulic, air, and electromagnetic suspension. As per vehicle type, it is classified into two-wheelers, passenger cars, and commercial vehicles. Region wise, the market is analyzed across North America, Europe, Asia-Pacific, and LAMEA.
In the vehicles of European car manufacturers, innovation and technical excellence have been consistently promoted. The development of modern suspension systems that ensure a comfortable ride, precise handling and improved safety features has been encouraged by such an emphasis on quality and performance. With a view to meeting the requirements of discriminating customers, Europe's automotive manufacturers have been leaders in developing new suspensions technologies such as Adaptive and Air Suspension.

In addition, as a result of EU safety and environmental legislation, the industry is investing in R&D which makes it possible to integrate advanced suspension systems with an enhanced level of safety and fuel efficiency. The development of lighter suspension components as well as environmentally friendly technologies has been driven by the emphasis on reducing emissions and improving fuel economy.
Furthermore, the growth of the luxury and high-performance automotive segments in Europe has driven demand for cutting-edge suspension systems. These vehicles require advanced suspension technology to deliver the desired balance of ride comfort and dynamic handling. As a result, European manufacturers have developed and incorporated innovative solutions into their high-end models. Additionally, the European aftermarket for suspension components and systems has seen growth, as enthusiasts and vehicle owners seek to enhance the performance and handling characteristics of their cars. This has led to a vibrant ecosystem of aftermarket suspension suppliers and service providers.

Key Developments
The leading companies are adopting strategies such as acquisition, agreement, expansion, partnership, contracts, and product launches to strengthen their market position.
- In May 2023, LG Electronics Inc. launched a connected vehicle alarm system, LG MyCar Alarm Service. It integrates with Infoconn, the connected car service as mobile application of KG Mobility & developed in response to increasing demand from automotive companies and consumers for vehicle-integrated mobility services.
- In October 2022, Continental AG developed connected infotainment box that enables the use of digital services such as ecalls, turn-by-turn navigation and stolen vehicle tracking. Along with that it provides optional features such as stolen vehicle tracking.
- In July 2022, Thales developed & offers a secure connectivity solution to bring drivers, passengers and maintenance teams’ greater access to useful information. This seamless connectivity management solution enables drivers and passengers to access eCall (automatic EU emergency call in case of an accident), remote software updates and smoother recall actions.
- In November 2020, Panasonic Holdings Corporation developed in-vehicle emergency call system (eCall). The number of cars equipped with this system & it provides emergency response in case of an accident.
Increase in demand for luxury & comfort in vehicles
Increase in demand for comfort and luxury in vehicles and quieter cabin has significantly contributed toward the growth of the global automotive suspension market. Manufacturers such as BMW, Audi, Mercedes Benz, Volvo, Jaguar, Rolls-Royce, and Land Rover are the key players manufacturing luxury vehicles in the automotive industry. Moreover, the sale of luxury cars is anticipated to increase by two-folds by 2024, due to advancement in vehicle technology and growth in economy of developing countries. Moreover, noise, vibration, and harshness (NVH) performance of vehicles should meet the defined standard ratings to provide more comfort and reduce cabin vibrations. Thus, all these factors collectively boost the growth of the global automotive suspension market.
Rise in production of vehicles
The automotive industry witnessed robust growth in the last decade in countries such as China, the U.S., Japan, India, Germany, and the UK. The global automotive industry initially focused on the developed countries such as Japan, the U.S., and Germany. However, companies have shifted their manufacturing facilities in the developing countries, such as China, Thailand, and India, due to increase in demand for automobiles & automotive components in these countries. Low cost of labor further decreases the production cost, and thus enables the manufacturers cater to the increasing demands, which is anticipated to boost the sale of electric vehicle during the forecast period. In addition, decrease in prices of electric vehicle parts such as battery, transmission, and alternators are expected to propel the sales of electric vehicles. Such factors are projected to contribute toward the growth of the global automotive suspension industry.

High maintenance cost of advanced suspension systems
High cost associated with installing new or advanced suspension systems leads to increase in cost of vehicles, which is expected to hamper the growth of the market. The prospect of providing premium features in vehicles incurs additional expenses to consumers in the form of hardware, applications, and telecom service charges, which eventually limits the market growth. Moreover, the serviceability of such vehicles is difficult, and require skilled workers due to several components and sensors. Complex structure of systems reduce the service life of vehicles. Thus, high initial cost and complex structure are expected to have a negative impact on the growth of the global automotive suspension market.
Rise in demand for lightweight suspension system
Suspension plays a vital role in improving luxury and comfort and reducing cabin vibrations in vehicles. Conventional suspension components are manufactured using materials such as steel or alloy of steels, including stainless steel and carbon steel. However, these materials are heavy and have less strength as compared to other materials. Therefore, technological advancements in the automotive industry have led to the development automotive lightweight materials such as aluminum, carbon fiber, and titanium alloys in manufacturing components of suspension systems. Such are materials are used for manufacturing suspension component due to their improved properties such as low weight, high specific stiffness, corrosion resistance, ability to produce intricate shapes, high specific strength, and high impact energy absorption. Moreover, automotive lightweight materials are expected to witness high adoption in the automotive industry, due to surge in demand for fuel-efficient vehicles and the implementation of stringent vehicular emission regulation, which are expected to provide lucrative growth opportunities for the expansion of the automotive suspension market in the near future.
Key Benefits For Stakeholders
- This report provides a quantitative analysis of the market segments, current trends, estimations, and dynamics of the automotive suspension market analysis from 2022 to 2032 to identify the prevailing automotive suspension market opportunities.
- The market research is offered along with information related to key drivers, restraints, and opportunities.
- Porter's five forces analysis highlights the potency of buyers and suppliers to enable stakeholders make profit-oriented business decisions and strengthen their supplier-buyer network.
- In-depth analysis of the automotive suspension market segmentation assists to determine the prevailing market opportunities.
- Major countries in each region are mapped according to their revenue contribution to the global market.
- Market player positioning facilitates benchmarking and provides a clear understanding of the present position of the market players.
- The report includes the analysis of the regional as well as global automotive suspension market trends, key players, market segments, application areas, and market growth strategies.
Automotive Suspension Market Report Highlights
| Aspects | Details |
| Market Size By 2032 | USD 96.6 billion |
| Growth Rate | CAGR of 4.7% |
| Forecast period | 2022 - 2032 |
| Report Pages | 342 |
| By Geometry |
|
| By Suspension Type |
|
| By System |
|
| By Component |
|
| By Vehicle Type |
|
| By Region |
|
| Key Market Players | KYB Corporation, Sogefi SpA, Hendrickson USA LLC, Tenneco Inc., WABCO Holdings Inc., FOX Factory, Inc., Gabriel India Ltd (ANAND Group), ThyssenKrupp AG, HL Mando Corp., Continental AG |
The global automotive suspension market was valued at $61,566.0 million in 2022, and is projected to reach $96,562.1 million by 2032, registering a CAGR of 4.7%.
Growing demand for luxury & comfort in vehicles and development of advanced suspension systems are the upcoming trends of Automotive Suspension Market.
Air Suspension is the leading application of Automotive Suspension Market.
Asia-Pacific is the largest regional market for Automotive Suspension Market.
The top companies to hold the market share in Automotive Suspension Market are Continental AG, Fox Factory, Inc., Gabriel India Limited, Hendrickson USA, L.L.C., KYB Corporation, Mando Corporation, Sogefi S.p.A., Tenneco INC., Wabco Holding Inc., and Thyssenkrupp AG.
Loading Table Of Content...
Loading Research Methodology...

