
Automotive Thermoplastic Resin Composites Market Research, 2033
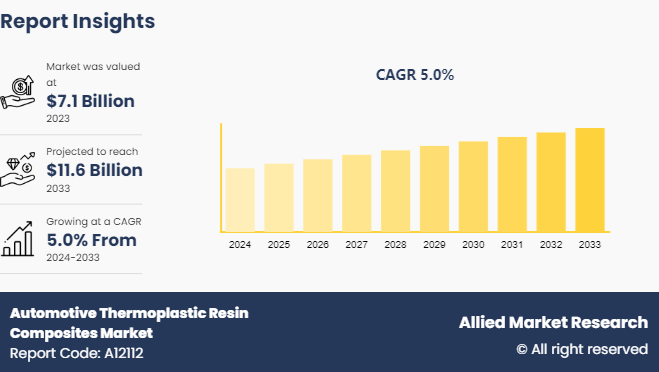
The global automotive thermoplastic resin composites market was valued at $7.1 billion in 2023, and is projected to reach $11.6 billion by 2033, growing at a CAGR of 5% from 2024 to 2033.
Market Introduction and Definition
Automotive thermoplastic resin composites are advanced materials widely used in the automotive industry consisting of a thermoplastic resin matrix reinforced with high-strength fibers or fillers. Automotive thermoplastic resin composites are utilized in a wide range of applications such as frames, battery trays, bumper beams, load floors, front ends and structural components cross-car beams, roof rails. In addition, Automotive thermoplastic resin composites are advanced materials used in the automotive industry to create various vehicle components. These composites consist of a thermoplastic resin matrix reinforced with fibers such as glass, carbon, or aramid.
Key Takeaways
- The automotive thermoplastic resin composites market study covers 20 countries. The research includes a segment analysis of each country in terms of value ($Billion) for the projected period 2023-2033.
- More than 2,500 product literatures, industry releases, annual reports, and other such documents of major automotive thermoplastic resin composites industry participants along with authentic industry journals, trade associations' releases, and government websites have been reviewed for generating high-value industry insights.
- The study integrated high-quality data, professional opinions and analysis, and critical independent perspectives. The research approach is intended to provide a balanced view of global markets and to assist stakeholders in making educated decisions to achieve their most ambitious growth objectives.
Key Market Dynamics
The vehicle weight directly impacts fuel consumption and greenhouse gas emissions. Heavy vehicles require more energy to accelerate and overcome inertia leading to higher fuel consumption and increased emissions. By reducing vehicle weight through the incorporation of lightweight materials such as automotive thermoplastic resin composites, automakers achieve significant improvements in fuel efficiency and emissions reduction. Thermoplastic resin composites offer an attractive solution for vehicle lightweighting due to their high strength-to-weight ratio. These materials provide exceptional mechanical properties, being significantly lighter than traditional materials such as steel and aluminum. By replacing heavier components with thermoplastic resin composites, automakers reduce the overall vehicle weight without compromising structural integrity, safety, or performance. All these factors are expected to drive the demand for the automotive thermoplastic resin composites market during the forecast period.
However, the processing of thermoplastic resin composites often involves high temperatures during molding or forming operations. Some resins or composites have a narrow processing window, making it challenging to achieve consistent product quality and dimensional stability, especially for complex geometries or large-scale production runs. Thermoplastic resins and their composites have inherent temperature limitations, which restrict their use in environments where high temperatures are encountered. All these factors are expected to hamper the growth of the automotive thermoplastic resin composites market during the forecast period.
Multifunctional composites are advanced materials that perform multiple functions beyond their primary structural or mechanical roles, offering additional capabilities such as thermal management, energy storage, or sensing. In addition, development of energy-storing composites where thermoplastic resins are combined with materials that store and release electrical energy. Thermoplastic composites are potentially replacing traditional battery systems providing lightweight and integrated energy storage solutions for various automotive applications such as hybrid and electric vehicles. All these factors are anticipated to offer new growth opportunities for the global automotive thermoplastic resin composites market during the forecast period.
Global Automotive Thermoplastic Resin Composites Market - Patent Outlook, by Country

The U.S. collectively hold nearly half of the total automotive thermoplastic resin composites patents that indicate strong innovation and investment in this technology in U.S. countries. This suggests fierce competition and a significant focus on automotive thermoplastic resin composites R&D in these leading economies. U.S. has the highest patent filed those accounts for 43.3% of the total global patents related to the automotive thermoplastic resin composites. Europe and PCT, although holding smaller percentages of automotive thermoplastic resin composites patents individually, collectively contribute to the overall Asian dominance in automotive thermoplastic resin composites innovation. This reflects the region's strong presence in materials science and engineering R&D.
Market Segmentation
The automotive thermoplastic resin composites market is segmented by resin type, product type, fiber type, application, and region. Based on resin type, the market is classified into polycarbonate (PC) , polyurethane (PUR) , polystyrene (PS) , polyethylene (PE) , polycarbonate (PC) , polybutylene terephthalate (PBT) , polyethylene terephthalate (PET) , and others. By fiber type, the market is classified into carbon fiber, glass fiber, and others. By product type the market is divided into high temperature thermoplastics and engineering thermoplastics. By application, the market is divided into seat frames, battery trays, bumper beams, load floors, front ends, under engine covers, and others. Region-wise, the market is analyzed across North America, Europe, Asia-Pacific, and LAMEA.
Regional Market Outlook
The rapid industrialization and urbanization is observed in countries such as China, India, and Southeast Asian nations. Asia pacific regions are experiencing significant infrastructure development, which requires high-performance materials that offer durability, flexibility, and cost-efficiency. Thermoplastic resin composites are increasingly favored in automotive industries due to their lightweight nature, corrosion resistance, and ease of fabrication, contributing to their rising demand. In addition, technological advancements and increased research and development activities in the region also contribute significantly to the market growth. Innovations in composite manufacturing processes, such as automated fiber placement and 3D printing, have enhanced the production efficiency and quality of thermoplastic resin composites.
In April, Germany saw 281, 400 new passenger car registrations, a 17% increase from the same month last year. For the first quarter of 2023, a total of 666, 900 new vehicles were registered, up nearly 7% compared to the same period in the previous year. Despite this growth, new registrations remain nearly 25% below the pre-crisis levels of the first quarter of 2019.
Competitive Landscape
The major players operating in the automotive thermoplastic resin composites market include BASF SE, SABIC, Mitsubishi Chemical Group Corporation., A&C Plastics, Inc., Knauf Industries, Celanese Corporation, Covestro AG, UFP Technologies, Inc., Dow, Special Chem., and others.
Industry Trends
According to NITI Aayog and the Rocky Mountain Institute (RMI) , India's EV finance industry is likely to reach US$ 50 billion (Rs. 3.7 lakh crore) by 2030. A report by the India Energy Storage Alliance estimated that the EV market in India is likely to increase at a CAGR of 36% until 2026. In addition, the projection for the EV battery market is expected to expand at a CAGR of 30% during the same period.
According to India Brand Equity Foundation (IBEF) India’s auto component industry is an important sector driving macroeconomic growth and employment. The industry comprises players of all sizes, from large corporations to micro entities, spread across clusters throughout the country. The auto components industry accounted for 2.3% of India’s GDP and provided direct employment to more than 1.5 million people. By 2026, the automobile component sector will contribute 5-7% of India's GDP. The Automotive Mission Plan (2016-26) projects to provide direct incremental employment to 3.2 million by 2026.
According to India Brand Equity Foundation (IBEF) India is emerging as a global hub for auto component sourcing and the industry exports over 25% of its production annually.
As per the Automobile Component Manufacturers Association (ACMA) forecast, auto component exports from India are expected to reach US$ 30 billion by 2026. The auto component industry is projected to record US$ 200 billion in revenue by 2026. Strong international demand and resurgence in the local original equipment and aftermarket segments are predicted to help the auto component industry grow 20-23% in FY22.
Public Policies
ISO (International Organization for Standardization) standards for the automotive thermoplastic resin composites:
- ISO 19069-1:2015: This standard specifies the requirements and test methods for polypropylene (PP) thermoplastic resins used in automotive applications. It covers aspects such as material properties, mechanical performance, and testing procedures to ensure consistency and reliability of PP resins in the production of automotive components.
- ISO 11357-3:2018: This standard focuses on differential scanning calorimetry (DSC) methods for determining the melting and crystallization behavior of thermoplastic resins. It is essential for assessing the thermal properties of automotive thermoplastic composites, ensuring they meet specific performance criteria under varying temperature conditions.
- ISO 11443:2014: This standard outlines the methods for determining the viscosity of thermoplastic resins using capillary and slit-die rheometry. Accurate viscosity measurements are crucial for processing thermoplastic composites in automotive manufacturing, affecting mold filling and final part quality.
- ISO 16012:2015: This standard provides guidelines for the determination of tensile properties of thermoplastic composites, including tensile strength, elongation at break, and modulus of elasticity. These mechanical properties are vital for evaluating the performance and durability of automotive thermoplastic components.
- ISO 1043-1:2011: This standard specifies the symbols and abbreviated terms used for identifying the various types of thermoplastic resins. Standardized nomenclature facilitates clear communication and documentation within the automotive industry, ensuring proper material selection and usage.
Key Sources Referred
World Intellectual Property Organization
Plastics Europe
Invest India
SAE International.
United Nations Development Programme.
AdrecoPlastics
Plastic Service Centers
Key Benefits For Stakeholders
This report provides a quantitative analysis of the market segments, current trends, estimations, and dynamics of the automotive thermoplastic resin composites market analysis from 2024 to 2033 to identify the prevailing automotive thermoplastic resin composites market opportunities.
The market research is offered along with information related to key drivers, restraints, and opportunities.
Porter's five forces analysis highlights the potency of buyers and suppliers to enable stakeholders make profit-oriented business decisions and strengthen their supplier-buyer network.
In-depth analysis of the automotive thermoplastic resin composites market segmentation assists to determine the prevailing market opportunities.
Major countries in each region are mapped according to their revenue contribution to the global market.
Market player positioning facilitates benchmarking and provides a clear understanding of the present position of the market players.
The report includes the analysis of the regional as well as global automotive thermoplastic resin composites market trends, key players, market segments, application areas, and market growth strategies.
Automotive Thermoplastic Resin Composites Market Report Highlights
| Aspects | Details |
| Market Size By 2033 | USD 11.6 Billion |
| Growth Rate | CAGR of 5% |
| Forecast period | 2024 - 2033 |
| Report Pages | 340 |
| By Resin Type |
|
| By Fiber Type |
|
| By Product Type |
|
| By Application |
|
| By Region |
|
| Key Market Players | Celanese Corporation, UFP Technologies, Inc., BASF SE, Dow, Knauf Industries, Covestro AG, Special Chem, SABIC, A&C Plastics, Inc., Mitsubishi Chemical Group Corporation |
Increasing demand for recyclable and sustainable materials, rising adoption of electric vehicles are the upcoming trends of Automotive Thermoplastic Resin Composites Market in the world.
bumper is the leading application of Automotive Thermoplastic Resin Composites Market
Asia-Pacific is the largest regional market for Automotive Thermoplastic Resin Composites
$11.6 billion is the estimated industry size of Automotive Thermoplastic Resin Composites by 2033.
BASF SE, SABIC, Mitsubishi Chemical Group Corporation., A&C Plastics, Inc., Knauf Industries, Celanese Corporation, Covestro AG, UFP Technologies, Inc., Dow, Special Chem. are the top companies to hold the market share in Automotive Thermoplastic Resin Composites.
Loading Table Of Content...

