0
2022
Autonomous Navigation Market

Autonomous Navigation Market

by System (Sensing System, Processing System, Software System), by Platform (Airborne, Land, Marine, Space, Weapons), by Application (Commercial, Military, Government): Global Opportunity Analysis and Industry Forecast, 2021-2031

Report Code: A07098
Jul 2022 | Pages: 392
Tables: 174
Charts: 105
  • Formats*:

  • pdf

    Single User License, Five User
    License & Enterprise User License

  • xls

    Data Pack Excel License

  • ppt

    It comes with the additional cost
    of $2500.00 contact sales.


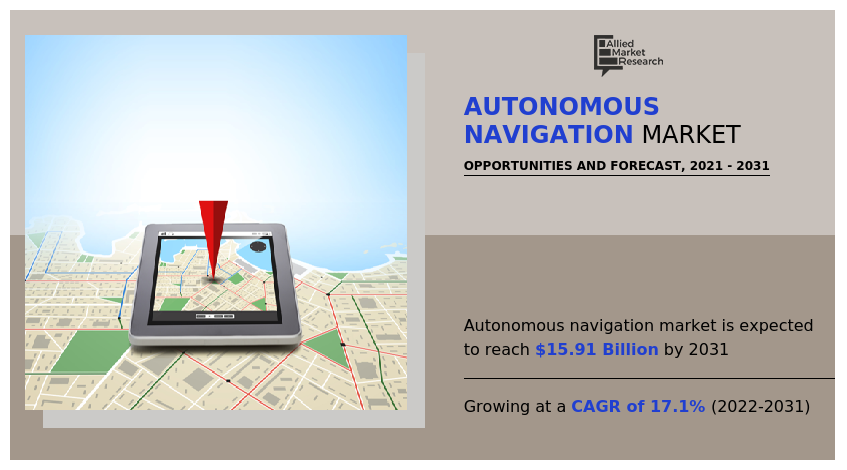
The global autonomous navigation market was valued at $3.27 billion in 2021, and is projected to reach $15.91 billion by 2031, growing at a CAGR of 17.1% from 2022 to 2031.

Autonomous navigation system is a system, which is able to plan its path and execute its plan without human intervention. It is a combination of complex systems that assists in carrying out decision-making based on surrounding situations. It is installed in vehicles such as drones, robots, cars, boats, and others. The navigation system technology is performed by using advanced technologies, such as inertial navigation system, satellite navigation system, radars, cameras, and ultrasonic & acoustics navigation along with autonomous navigation algorithms for accurate & safe navigation of vehicles.

The COVID-19 crisis is creating uncertainty in the market. Governments of different regions have announced total lockdown and temporarily shutdown of industries, thereby adversely affecting the overall production and sales. It also resulted in flight cancellations, travel bans, and quarantines, which led to massive slowing of the supply chain and logistics activities globally. Since the beginning of 2020, more and more countries across the globe shut down their borders and limited transportation & travel to contain the coronavirus (COVID-19) outbreak, thereby creating impediments for international trade and transportation. However, during the COVID-19 pandemic, the use of autonomous navigation systems for unmanned aerial vehicles increased since it is the best replacement for reducing cross-infection. As a result, many governments have started using unmanned aerial vehicles or drones to transport medical supplies, food, and other requirements. For instance, in May 2021, the Ministry of Civil Aviation (MoCA) & Directorate General of Civil Aviation (DGCA) granted a conditional exemption to the Government of Telangana (India) for conducting experimental Beyond Visual Line of Sight (BVLOS) drone flights by using autonomous navigation systems for the delivery of COVID-19 vaccines.

Autonomous Navigation Market, Autonomous Navigation Industry

In addition, it autonomously defines a trajectory through the system or robot’s environment with due consideration of dynamics of movement limitations of the system to deal with any possible unexpected obstacles while maintaining its stability as well. For instance, in April 2022, NAVENTIK developed its PATHFINDER emPE embedded positioning engine to fully support the most modern expansion stage of the Chinese satellite system "BeiDou-3". This development resulted in higher availability, better accuracy and higher integrity of the positioning solution across heavily obstructed areas, such as cities or forests, where GNSS reception at the antenna is disturbed by obstacles.

The factors such as increase in demand for sense & avoid system in autonomous system, rise in adoption of autonomous robot in commercial & military applications, and increase in demand for real-time data in military applications supplement the growth of the autonomous navigation market. However, lack of standard infrastructure for operation of autonomous systems in developing countries and privacy & security concerns related to data are the factors expected to hamper the growth of the autonomous navigation market. In addition, increase in demand for improved surveillance and proactive government initiatives & support are expected to create ample opportunities for the key players operating in the market.

Autonomous Navigation Market

The autonomous navigation market is segmented into application, system, platform and region. Based on system, the market is divided into sensing system, processing system, and software system. Based on platform, the market is fragmented into airborne, land, marine, space, and weapons. Based on application, the market is categorized into commercial, military, and government. By region, it is analyzed across North America, Europe, Asia-Pacific, and LAMEA.

The leading players operating in the autonomous navigation market are ABB, ENWAY, Fixposition AG, Furuno, General Dynamics, Honeywell International, Kongsberg Gruppen, L3 Harris Technologies, Moog Inc., NAVENTIK GmbH, Northrop Grumman, Raytheon Technologies, Rh Marine, Rolly Royce, Safran, Thales Group and Trimble. Key innovators operating in the industry are Blickfeld, ModalAI, Starfish Space, Trustpoint, and Xona Space Systems.

Increase in demand for sense & avoid system in autonomous system

Sense & avoid is a sequence of function used in autonomous system, which uses combination of airborne & ground-based sensors to detect & avoid obstacles, and are able to perform maneuvers to avoid collisions and serve as an unmanned aerial vehicle (UAV) replacement. Thus, procurement & deployment of unmanned aerial vehicles (UAVs) is becoming more prevalent for business & defense purposes. The primary benefit of a sense and avoid system onboard an autonomous UAV is that it can be trusted to fly Beyond Visual Line of Sight (BVLOS). The system primarily uses transponders to get situational awareness and collision avoidance capability. Recently, in 2019, UAV Navigation (autopilot & flight control system developer company) and Sagetech Avionics Inc. (avionic system manufacturer), collaborated to integrate ADS-B (Automatic Dependent Surveillance - Broadcast) in/out transponder with UAV’s autopilot to provide surrounding aircrafts position, situational awareness, and develop search and avoidance capability. ABS-D in/out transponder is a device that broadcasts aircraft parameters such as position, altitude, and aircraft’s identification to the control tower or receiver aircrafts. Moreover, it is a tracking device that works both as a transmitter and receiver, which is considered to be a potential key component in future unmanned traffic management systems. Such initiatives in R&D in search & avoid system to deliver cutting-edge solutions for collision avoidance and air space management is expected to drive the global autonomous navigation software system market.

Autonomous Navigation Market

Rise in adoption of autonomous robot in commercial & military applications

A significant rise in the demand for online shopping platform was observed in the post COVID-19 pandemic. The accessibility, faster service, and reliable features of e-commerce platform-based companies have boosted the growth of the e-commerce industry. Hence, the surge in demand for advanced navigation system has facilitated the use of robots for operational purposes in the commercial sector owing to the continuous R&D in robotics, computer vision, artificial intelligence, and edge computing capabilities.

Furthermore, autonomous robots in the military are deployed in combat support application for anti-submarine operations, laying mines, fire support, electronic warfare, battle damage management, strike missions, aerial refueling, and others. Also, companies are configuring and testing advanced robots that can navigate a vehicle around a series of pylons, traverse different terrains, climb ladders, remove debris, operate in a disaster situation, and close a series of valves. Currently, armed forces globally no longer rely on human scouts and instead use small robots, which can remain almost invisible to the enemy. These robots help monitor enemy forces or specific areas and send videos and images to the ground station with the assistance of GPS. Such innovations led to the adoption of autonomous robot in commercial & military applications.   

Autonomous Navigation Market

Privacy and security concerns related to data 

A geographic information system (GIS) services, aerial imaging, LiDAR, green mapping, and other similar applications are focused on acquiring landscape information, such as images and imagery solutions using drones with EO/IR and other technologies. To preserve the public's private space and issues of national security, governments of numerous nations have enacted rules that limit the growth of this sector. In the North America autonomous navigation market, the Federal Aviation Administration (FAA) has declared that unmanned aerial vehicles (UAVs) can only fly up to 500 feet above ground level and are not permitted within a three-mile radius of airports or flying strips. Furthermore, due to the cyber-security threats associated with drones, numerous administrations have placed prohibitions or restrictions on drone ownership. In April 2021, Legislator Huang Kuo-shu of the Democratic Progressive Party (DPP) of Taiwan issued a guideline warning against the procurement of drones for made-in-China aerial photography, robots, and coding platforms and subsequent phasing out of the existing equipment. The announcement was made owing to the cybersecurity loophole on consumer electronics manufactured in China. Meanwhile, rise in use of autonomous systems has increased the cyber-security danger in defense industry, which is expected to hinder the autonomous navigation market growth.

Increase in demand for improved surveillance

The growth in threat from terrorism and increase in security concerns globally has led to increased government expenditure for unmanned aircraft systems (UAS) or drones to improve surveillance capabilities. Drones can carry out stealth operations, function at night, and operate at any location with payloads, including high imagery cameras such as Zenmuse Series by DJI Technology, DG series by Autel Robotics, and HDZoom30 by Aeryon Labs Inc. among others. Such benefits have led to increasing investments by governments to procure and develop a large number of drones globally. For instance, in March 2021, Elbit Systems Ltd. signed a $300 million contract to supply Hermes 900 unmanned aircraft systems to a country in Asia. Also, the development of advanced payloads for surveillance fuels the growth of the market. For instance, in September 2019, General Dynamics Corporation unveiled the new Bluefin-12 autonomous unmanned underwater vehicle at Defense and Security Equipment International (DSEI) 2019. The vehicle featured Bluefin’s autonomy technology and used shared Bluefin Robotics’ core capabilities, which used embedded intelligence to complete long endurance, high-consequence, and changing missions. Such innovation and introduction of cost-effective products are expected to create lucrative opportunities in the autonomous navigation market.

Autonomous Navigation Market

Key Benefits For Stakeholders

  • This study presents analytical depiction of the global autonomous navigation market analysis along with current trends and future estimations to depict imminent investment pockets.
  • The overall autonomous navigation market opportunity is determined by understanding profitable trends to gain a stronger foothold.
  • The report presents information related to the key drivers, restraints, and opportunities of the global autonomous navigation market with a detailed impact analysis.
  • The current autonomous navigation market is quantitatively analyzed from 2021 to 2031 to benchmark the financial competency.
  • Porter’s five forces analysis illustrates the potency of the buyers and suppliers in the industry.

Autonomous Navigation Market Report Highlights

Aspects Details
By Application
  • Commercial
  • Military
  • Government
By System
  • Sensing System
  • Processing System
  • Software System
By Platform
  • Airborne
  • Land
  • Marine
  • Space
  • Weapons
By Region
  • North America  (U.S., Canada, Mexico)
  • Europe  (U.K., Germany, France, Russia, Italy, Spain, Greece, Norway, Rest of Europe)
  • Asia-Pacific  (China, Japan, India, South Korea, Australia, Singapore, Rest of Asia-Pacific)
  • LAMEA  (Latin America, Middle East, Africa)
Key Market Players L3 Harris Technologies, Rh Marine, Safran, General Dynamics, Thales Group, Northrop Grumman, Moog Inc., ABB, Kongsberg Gruppen, Furuno, Raytheon Technologies, Trimble, Honeywell International
 
  • CHAPTER 1:INTRODUCTION

    • 1.1.Report description

    • 1.2.Key market segments

    • 1.3.Key benefits to the stakeholders

    • 1.4.Research Methodology

      • 1.4.1.Secondary research

      • 1.4.2.Primary research

      • 1.4.3.Analyst tools and models

  • CHAPTER 2:EXECUTIVE SUMMARY

    • 2.1.Key findings of the study

    • 2.2.CXO Perspective

  • CHAPTER 3:MARKET OVERVIEW

    • 3.1.Market definition and scope

    • 3.2.Key findings

      • 3.2.1.Top investment pockets

    • 3.3.Porter’s five forces analysis

    • 3.4.Top player positioning

    • 3.5.Market dynamics

      • 3.5.1.Drivers

      • 3.5.2.Restraints

      • 3.5.3.Opportunities

    • 3.6.COVID-19 Impact Analysis on the market

  • CHAPTER 4: AUTONOMOUS NAVIGATION MARKET, BY SYSTEM

    • 4.1 Overview

      • 4.1.1 Market size and forecast

    • 4.2 Sensing System

      • 4.2.1 Key market trends, growth factors and opportunities

      • 4.2.2 Market size and forecast, by region

      • 4.2.3 Market analysis by country

    • 4.3 Processing System

      • 4.3.1 Key market trends, growth factors and opportunities

      • 4.3.2 Market size and forecast, by region

      • 4.3.3 Market analysis by country

    • 4.4 Software System

      • 4.4.1 Key market trends, growth factors and opportunities

      • 4.4.2 Market size and forecast, by region

      • 4.4.3 Market analysis by country

  • CHAPTER 5: AUTONOMOUS NAVIGATION MARKET, BY PLATFORM

    • 5.1 Overview

      • 5.1.1 Market size and forecast

    • 5.2 Airborne

      • 5.2.1 Key market trends, growth factors and opportunities

      • 5.2.2 Market size and forecast, by region

      • 5.2.3 Market analysis by country

    • 5.3 Land

      • 5.3.1 Key market trends, growth factors and opportunities

      • 5.3.2 Market size and forecast, by region

      • 5.3.3 Market analysis by country

    • 5.4 Marine

      • 5.4.1 Key market trends, growth factors and opportunities

      • 5.4.2 Market size and forecast, by region

      • 5.4.3 Market analysis by country

    • 5.5 Space

      • 5.5.1 Key market trends, growth factors and opportunities

      • 5.5.2 Market size and forecast, by region

      • 5.5.3 Market analysis by country

    • 5.6 Weapons

      • 5.6.1 Key market trends, growth factors and opportunities

      • 5.6.2 Market size and forecast, by region

      • 5.6.3 Market analysis by country

  • CHAPTER 6: AUTONOMOUS NAVIGATION MARKET, BY APPLICATION

    • 6.1 Overview

      • 6.1.1 Market size and forecast

    • 6.2 Commercial

      • 6.2.1 Key market trends, growth factors and opportunities

      • 6.2.2 Market size and forecast, by region

      • 6.2.3 Market analysis by country

    • 6.3 Military

      • 6.3.1 Key market trends, growth factors and opportunities

      • 6.3.2 Market size and forecast, by region

      • 6.3.3 Market analysis by country

    • 6.4 Government

      • 6.4.1 Key market trends, growth factors and opportunities

      • 6.4.2 Market size and forecast, by region

      • 6.4.3 Market analysis by country

  • CHAPTER 7: AUTONOMOUS NAVIGATION MARKET, BY REGION

    • 7.1 Overview

      • 7.1.1 Market size and forecast

    • 7.2 North America

      • 7.2.1 Key trends and opportunities

      • 7.2.2 North America Market size and forecast, by System

      • 7.2.3 North America Market size and forecast, by Platform

      • 7.2.4 North America Market size and forecast, by Application

      • 7.2.5 North America Market size and forecast, by country

        • 7.2.5.1 U.S.
          • 7.2.5.1.1 Market size and forecast, by System
          • 7.2.5.1.2 Market size and forecast, by Platform
          • 7.2.5.1.3 Market size and forecast, by Application
        • 7.2.5.2 Canada
          • 7.2.5.2.1 Market size and forecast, by System
          • 7.2.5.2.2 Market size and forecast, by Platform
          • 7.2.5.2.3 Market size and forecast, by Application
        • 7.2.5.3 Mexico
          • 7.2.5.3.1 Market size and forecast, by System
          • 7.2.5.3.2 Market size and forecast, by Platform
          • 7.2.5.3.3 Market size and forecast, by Application
    • 7.3 Europe

      • 7.3.1 Key trends and opportunities

      • 7.3.2 Europe Market size and forecast, by System

      • 7.3.3 Europe Market size and forecast, by Platform

      • 7.3.4 Europe Market size and forecast, by Application

      • 7.3.5 Europe Market size and forecast, by country

        • 7.3.5.1 U.K.
          • 7.3.5.1.1 Market size and forecast, by System
          • 7.3.5.1.2 Market size and forecast, by Platform
          • 7.3.5.1.3 Market size and forecast, by Application
        • 7.3.5.2 Germany
          • 7.3.5.2.1 Market size and forecast, by System
          • 7.3.5.2.2 Market size and forecast, by Platform
          • 7.3.5.2.3 Market size and forecast, by Application
        • 7.3.5.3 France
          • 7.3.5.3.1 Market size and forecast, by System
          • 7.3.5.3.2 Market size and forecast, by Platform
          • 7.3.5.3.3 Market size and forecast, by Application
        • 7.3.5.4 Russia
          • 7.3.5.4.1 Market size and forecast, by System
          • 7.3.5.4.2 Market size and forecast, by Platform
          • 7.3.5.4.3 Market size and forecast, by Application
        • 7.3.5.5 Italy
          • 7.3.5.5.1 Market size and forecast, by System
          • 7.3.5.5.2 Market size and forecast, by Platform
          • 7.3.5.5.3 Market size and forecast, by Application
        • 7.3.5.6 Spain
          • 7.3.5.6.1 Market size and forecast, by System
          • 7.3.5.6.2 Market size and forecast, by Platform
          • 7.3.5.6.3 Market size and forecast, by Application
        • 7.3.5.7 Greece
          • 7.3.5.7.1 Market size and forecast, by System
          • 7.3.5.7.2 Market size and forecast, by Platform
          • 7.3.5.7.3 Market size and forecast, by Application
        • 7.3.5.8 Norway
          • 7.3.5.8.1 Market size and forecast, by System
          • 7.3.5.8.2 Market size and forecast, by Platform
          • 7.3.5.8.3 Market size and forecast, by Application
        • 7.3.5.9 Rest of Europe
          • 7.3.5.9.1 Market size and forecast, by System
          • 7.3.5.9.2 Market size and forecast, by Platform
          • 7.3.5.9.3 Market size and forecast, by Application
    • 7.4 Asia-Pacific

      • 7.4.1 Key trends and opportunities

      • 7.4.2 Asia-Pacific Market size and forecast, by System

      • 7.4.3 Asia-Pacific Market size and forecast, by Platform

      • 7.4.4 Asia-Pacific Market size and forecast, by Application

      • 7.4.5 Asia-Pacific Market size and forecast, by country

        • 7.4.5.1 China
          • 7.4.5.1.1 Market size and forecast, by System
          • 7.4.5.1.2 Market size and forecast, by Platform
          • 7.4.5.1.3 Market size and forecast, by Application
        • 7.4.5.2 Japan
          • 7.4.5.2.1 Market size and forecast, by System
          • 7.4.5.2.2 Market size and forecast, by Platform
          • 7.4.5.2.3 Market size and forecast, by Application
        • 7.4.5.3 India
          • 7.4.5.3.1 Market size and forecast, by System
          • 7.4.5.3.2 Market size and forecast, by Platform
          • 7.4.5.3.3 Market size and forecast, by Application
        • 7.4.5.4 South Korea
          • 7.4.5.4.1 Market size and forecast, by System
          • 7.4.5.4.2 Market size and forecast, by Platform
          • 7.4.5.4.3 Market size and forecast, by Application
        • 7.4.5.5 Australia
          • 7.4.5.5.1 Market size and forecast, by System
          • 7.4.5.5.2 Market size and forecast, by Platform
          • 7.4.5.5.3 Market size and forecast, by Application
        • 7.4.5.6 Singapore
          • 7.4.5.6.1 Market size and forecast, by System
          • 7.4.5.6.2 Market size and forecast, by Platform
          • 7.4.5.6.3 Market size and forecast, by Application
        • 7.4.5.7 Rest of Asia-Pacific
          • 7.4.5.7.1 Market size and forecast, by System
          • 7.4.5.7.2 Market size and forecast, by Platform
          • 7.4.5.7.3 Market size and forecast, by Application
    • 7.5 LAMEA

      • 7.5.1 Key trends and opportunities

      • 7.5.2 LAMEA Market size and forecast, by System

      • 7.5.3 LAMEA Market size and forecast, by Platform

      • 7.5.4 LAMEA Market size and forecast, by Application

      • 7.5.5 LAMEA Market size and forecast, by country

        • 7.5.5.1 Latin America
          • 7.5.5.1.1 Market size and forecast, by System
          • 7.5.5.1.2 Market size and forecast, by Platform
          • 7.5.5.1.3 Market size and forecast, by Application
        • 7.5.5.2 Middle East
          • 7.5.5.2.1 Market size and forecast, by System
          • 7.5.5.2.2 Market size and forecast, by Platform
          • 7.5.5.2.3 Market size and forecast, by Application
        • 7.5.5.3 Africa
          • 7.5.5.3.1 Market size and forecast, by System
          • 7.5.5.3.2 Market size and forecast, by Platform
          • 7.5.5.3.3 Market size and forecast, by Application
  • CHAPTER 8: COMPANY LANDSCAPE

    • 8.1. Introduction

    • 8.2. Top winning strategies

    • 8.3. Product Mapping of Top 10 Player

    • 8.4. Competitive Dashboard

    • 8.5. Competitive Heatmap

    • 8.6. Key developments

  • CHAPTER 9: COMPANY PROFILES

    • 9.1 ABB

      • 9.1.1 Company overview

      • 9.1.2 Company snapshot

      • 9.1.3 Operating business segments

      • 9.1.4 Product portfolio

      • 9.1.5 Business performance

      • 9.1.6 Key strategic moves and developments

    • 9.2 Honeywell International

      • 9.2.1 Company overview

      • 9.2.2 Company snapshot

      • 9.2.3 Operating business segments

      • 9.2.4 Product portfolio

      • 9.2.5 Business performance

      • 9.2.6 Key strategic moves and developments

    • 9.3 Safran

      • 9.3.1 Company overview

      • 9.3.2 Company snapshot

      • 9.3.3 Operating business segments

      • 9.3.4 Product portfolio

      • 9.3.5 Business performance

      • 9.3.6 Key strategic moves and developments

    • 9.4 General Dynamics

      • 9.4.1 Company overview

      • 9.4.2 Company snapshot

      • 9.4.3 Operating business segments

      • 9.4.4 Product portfolio

      • 9.4.5 Business performance

      • 9.4.6 Key strategic moves and developments

    • 9.5 Raytheon Technologies

      • 9.5.1 Company overview

      • 9.5.2 Company snapshot

      • 9.5.3 Operating business segments

      • 9.5.4 Product portfolio

      • 9.5.5 Business performance

      • 9.5.6 Key strategic moves and developments

    • 9.6 Thales Group

      • 9.6.1 Company overview

      • 9.6.2 Company snapshot

      • 9.6.3 Operating business segments

      • 9.6.4 Product portfolio

      • 9.6.5 Business performance

      • 9.6.6 Key strategic moves and developments

    • 9.7 Trimble

      • 9.7.1 Company overview

      • 9.7.2 Company snapshot

      • 9.7.3 Operating business segments

      • 9.7.4 Product portfolio

      • 9.7.5 Business performance

      • 9.7.6 Key strategic moves and developments

    • 9.8 L3 Harris Technologies

      • 9.8.1 Company overview

      • 9.8.2 Company snapshot

      • 9.8.3 Operating business segments

      • 9.8.4 Product portfolio

      • 9.8.5 Business performance

      • 9.8.6 Key strategic moves and developments

    • 9.9 Moog Inc.

      • 9.9.1 Company overview

      • 9.9.2 Company snapshot

      • 9.9.3 Operating business segments

      • 9.9.4 Product portfolio

      • 9.9.5 Business performance

      • 9.9.6 Key strategic moves and developments

    • 9.10 Furuno

      • 9.10.1 Company overview

      • 9.10.2 Company snapshot

      • 9.10.3 Operating business segments

      • 9.10.4 Product portfolio

      • 9.10.5 Business performance

      • 9.10.6 Key strategic moves and developments

    • 9.11 Kongsberg Gruppen

      • 9.11.1 Company overview

      • 9.11.2 Company snapshot

      • 9.11.3 Operating business segments

      • 9.11.4 Product portfolio

      • 9.11.5 Business performance

      • 9.11.6 Key strategic moves and developments

    • 9.12 Northrop Grumman

      • 9.12.1 Company overview

      • 9.12.2 Company snapshot

      • 9.12.3 Operating business segments

      • 9.12.4 Product portfolio

      • 9.12.5 Business performance

      • 9.12.6 Key strategic moves and developments

    • 9.13 Rh Marine

      • 9.13.1 Company overview

      • 9.13.2 Company snapshot

      • 9.13.3 Operating business segments

      • 9.13.4 Product portfolio

      • 9.13.5 Business performance

      • 9.13.6 Key strategic moves and developments

  • LIST OF TABLES

  • TABLE 01. AUTONOMOUS NAVIGATION MARKET, BY SYSTEM, 2021-2031 ($MILLION)
    TABLE 02. AUTONOMOUS NAVIGATION MARKET FOR SENSING SYSTEM, BY REGION, 2021-2031 ($MILLION)
    TABLE 03. AUTONOMOUS NAVIGATION MARKET FOR PROCESSING SYSTEM, BY REGION, 2021-2031 ($MILLION)
    TABLE 04. AUTONOMOUS NAVIGATION MARKET FOR SOFTWARE SYSTEM, BY REGION, 2021-2031 ($MILLION)
    TABLE 05. AUTONOMOUS NAVIGATION MARKET, BY PLATFORM, 2021-2031 ($MILLION)
    TABLE 06. AUTONOMOUS NAVIGATION MARKET FOR AIRBORNE, BY REGION 2021-2031 ($MILLION)
    TABLE 07. AUTONOMOUS NAVIGATION MARKET FOR AIRBORNE, BY SYSTEM, 2021-2031 ($MILLION)
    TABLE 08. AUTONOMOUS NAVIGATION MARKET FOR LAND, BY REGION 2021-2031 ($MILLION)
    TABLE 09. AUTONOMOUS NAVIGATION MARKET FOR LAND, BY SYSTEM, 2021-2031 ($MILLION)
    TABLE 10. AUTONOMOUS NAVIGATION MARKET FOR MARINE, BY REGION 2021-2031 ($MILLION)
    TABLE 11. AUTONOMOUS NAVIGATION MARKET FOR MARINE, BY SYSTEM, 2021-2031 ($MILLION)
    TABLE 12. AUTONOMOUS NAVIGATION MARKET FOR SPACE, BY REGION 2021-2031 ($MILLION)
    TABLE 13. AUTONOMOUS NAVIGATION MARKET FOR SPACE, BY SYSTEM, 2021-2031 ($MILLION)
    TABLE 14. AUTONOMOUS NAVIGATION MARKET FOR WEAPONS, BY REGION 2021-2031 ($MILLION)
    TABLE 15. AUTONOMOUS NAVIGATION MARKET FOR WEAPONS, BY SYSTEM, 2021-2031 ($MILLION)
    TABLE 16. AUTONOMOUS NAVIGATION MARKET, BY APPLICATION, 2021-2031 ($MILLION)
    TABLE 17. AUTONOMOUS NAVIGATION MARKET FOR COMMERCIAL, BY REGION 2021-2031 ($MILLION)
    TABLE 18. AUTONOMOUS NAVIGATION MARKET FOR MILITARY, BY REGION 2021-2031 ($MILLION)
    TABLE 19. AUTONOMOUS NAVIGATION MARKET FOR GOVERNMENT, BY REGION 2021-2031 ($MILLION)
    TABLE 20. AUTONOMOUS NAVIGATION MARKET, BY REGION, 2021-2031 ($MILLION)
    TABLE 21. NORTH AMERICA AUTONOMOUS NAVIGATION MARKET, BY COUNTRY, 2021-2031 ($MILLION)
    TABLE 22. NORTH AMERICA AUTONOMOUS NAVIGATION MARKET, BY SYSTEM, 2021-2031 ($MILLION)
    TABLE 23. NORTH AMERICA AUTONOMOUS NAVIGATION MARKET, BY PLATFORM, 2021-2031 ($MILLION)
    TABLE 24. NORTH AMERICA AIRBORNE AUTONOMOUS NAVIGATION MARKET, BY SYSTEM, 2021-2031 ($MILLION)
    TABLE 25. NORTH AMERICA LAND AUTONOMOUS NAVIGATION MARKET, BY SYSTEM, 2021-2031 ($MILLION)
    TABLE 26. NORTH AMERICA MARINE AUTONOMOUS NAVIGATION MARKET, BY SYSTEM, 2021-2031 ($MILLION)
    TABLE 27. NORTH AMERICA SPACE AUTONOMOUS NAVIGATION MARKET, BY SYSTEM, 2021-2031 ($MILLION)
    TABLE 28. NORTH AMERICA WEAPONS AUTONOMOUS NAVIGATION MARKET, BY SYSTEM, 2021-2031 ($MILLION)
    TABLE 29. NORTH AMERICA AUTONOMOUS NAVIGATION MARKET, BY APPLICATION, 2021-2031 ($MILLION)
    TABLE 30. U.S. AUTONOMOUS NAVIGATION MARKET, BY SYSTEM, 2021-2031 ($MILLION)
    TABLE 31. U.S. AUTONOMOUS NAVIGATION MARKET, BY PLATFORM, 2021-2031 ($MILLION)
    TABLE 32. U.S. AUTONOMOUS NAVIGATION MARKET, BY APPLICATION, 2021-2031 ($MILLION)
    TABLE 33. CANADA AUTONOMOUS NAVIGATION MARKET, BY SYSTEM, 2021-2031 ($MILLION)
    TABLE 34. CANADA AUTONOMOUS NAVIGATION MARKET, BY PLATFORM, 2021-2031 ($MILLION)
    TABLE 35. CANADA AUTONOMOUS NAVIGATION MARKET, BY APPLICATION, 2021-2031 ($MILLION)
    TABLE 36. MEXICO AUTONOMOUS NAVIGATION MARKET, BY SYSTEM, 2021-2031 ($MILLION)
    TABLE 37. MEXICO AUTONOMOUS NAVIGATION MARKET, BY PLATFORM, 2021-2031 ($MILLION)
    TABLE 38. MEXICO AUTONOMOUS NAVIGATION MARKET, BY APPLICATION, 2021-2031 ($MILLION)
    TABLE 39. EUROPE AUTONOMOUS NAVIGATION MARKET, BY COUNTRY, 2021-2031 ($MILLION)
    TABLE 40. EUROPE AUTONOMOUS NAVIGATION MARKET, BY SYSTEM, 2021-2031 ($MILLION)
    TABLE 41. EUROPE AUTONOMOUS NAVIGATION MARKET, BY PLATFORM, 2021-2031 ($MILLION)
    TABLE 42. EUROPE AIRBORNE AUTONOMOUS NAVIGATION MARKET, BY SYSTEM, 2021-2031 ($MILLION)
    TABLE 43. EUROPE LAND AUTONOMOUS NAVIGATION MARKET, BY SYSTEM, 2021-2031 ($MILLION)
    TABLE 44. EUROPE MARINE AUTONOMOUS NAVIGATION MARKET, BY SYSTEM, 2021-2031 ($MILLION)
    TABLE 45. EUROPE SPACE AUTONOMOUS NAVIGATION MARKET, BY SYSTEM, 2021-2031 ($MILLION)
    TABLE 46. EUROPE WEAPONS AUTONOMOUS NAVIGATION MARKET, BY SYSTEM, 2021-2031 ($MILLION)
    TABLE 47. EUROPE AUTONOMOUS NAVIGATION MARKET, BY APPLICATION, 2021-2031 ($MILLION)
    TABLE 48. UK AUTONOMOUS NAVIGATION MARKET, BY SYSTEM, 2021-2031 ($MILLION)
    TABLE 49. UK AUTONOMOUS NAVIGATION MARKET, BY PLATFORM, 2021-2031 ($MILLION)
    TABLE 50. UK AUTONOMOUS NAVIGATION MARKET, BY APPLICATION, 2021-2031 ($MILLION)
    TABLE 51. GERMANY AUTONOMOUS NAVIGATION MARKET, BY SYSTEM, 2021-2031 ($MILLION)
    TABLE 52. GERMANY AUTONOMOUS NAVIGATION MARKET, BY PLATFORM, 2021-2031 ($MILLION)
    TABLE 53. GERMANY AUTONOMOUS NAVIGATION MARKET, BY APPLICATION, 2021-2031 ($MILLION)
    TABLE 54. FRANCE AUTONOMOUS NAVIGATION MARKET, BY SYSTEM, 2021-2031 ($MILLION)
    TABLE 55. FRANCE AUTONOMOUS NAVIGATION MARKET, BY PLATFORM, 2021-2031 ($MILLION)
    TABLE 56. FRANCE AUTONOMOUS NAVIGATION MARKET, BY APPLICATION, 2021-2031 ($MILLION)
    TABLE 57. RUSSIA AUTONOMOUS NAVIGATION MARKET, BY SYSTEM, 2021-2031 ($MILLION)
    TABLE 58. RUSSIA AUTONOMOUS NAVIGATION MARKET, BY PLATFORM, 2021-2031 ($MILLION)
    TABLE 59. RUSSIA AUTONOMOUS NAVIGATION MARKET, BY APPLICATION, 2021-2031 ($MILLION)
    TABLE 60. ITALY AUTONOMOUS NAVIGATION MARKET, BY SYSTEM, 2021-2031 ($MILLION)
    TABLE 61. ITALY AUTONOMOUS NAVIGATION MARKET, BY PLATFORM, 2021-2031 ($MILLION)
    TABLE 62. ITALY AUTONOMOUS NAVIGATION MARKET, BY APPLICATION, 2021-2031 ($MILLION)
    TABLE 63. SPAIN AUTONOMOUS NAVIGATION MARKET, BY SYSTEM, 2021-2031 ($MILLION)
    TABLE 64. SPAIN AUTONOMOUS NAVIGATION MARKET, BY PLATFORM, 2021-2031 ($MILLION)
    TABLE 65. SPAIN AUTONOMOUS NAVIGATION MARKET, BY APPLICATION, 2021-2031 ($MILLION)
    TABLE 66. GREECE AUTONOMOUS NAVIGATION MARKET, BY SYSTEM, 2021-2031 ($MILLION)
    TABLE 67. GREECE AUTONOMOUS NAVIGATION MARKET, BY PLATFORM, 2021-2031 ($MILLION)
    TABLE 68. GREECE AUTONOMOUS NAVIGATION MARKET, BY APPLICATION, 2021-2031 ($MILLION)
    TABLE 69. NORWAY AUTONOMOUS NAVIGATION MARKET, BY SYSTEM, 2021-2031 ($MILLION)
    TABLE 70. NORWAY AUTONOMOUS NAVIGATION MARKET, BY PLATFORM, 2021-2031 ($MILLION)
    TABLE 71. NORWAY AUTONOMOUS NAVIGATION MARKET, BY APPLICATION, 2021-2031 ($MILLION)
    TABLE 72. REST OF EUROPE AUTONOMOUS NAVIGATION MARKET, BY SYSTEM, 2021-2031 ($MILLION)
    TABLE 73. REST OF EUROPE AUTONOMOUS NAVIGATION MARKET, BY PLATFORM, 2021-2031 ($MILLION)
    TABLE 74. REST OF EUROPE AUTONOMOUS NAVIGATION MARKET, BY APPLICATION, 2021-2031 ($MILLION)
    TABLE 75. ASIA-PACIFIC AUTONOMOUS NAVIGATION MARKET, BY COUNTRY, 2021-2031 ($MILLION)
    TABLE 76. ASIA-PACIFIC AUTONOMOUS NAVIGATION MARKET, BY SYSTEM, 2021-2031 ($MILLION)
    TABLE 77. ASIA-PACIFIC AUTONOMOUS NAVIGATION MARKET, BY PLATFORM, 2021-2031 ($MILLION)
    TABLE 78. ASIA-PACIFIC AIRBORNE AUTONOMOUS NAVIGATION MARKET, BY SYSTEM, 2021-2031 ($MILLION)
    TABLE 79. ASIA-PACIFIC LAND AUTONOMOUS NAVIGATION MARKET, BY SYSTEM, 2021-2031 ($MILLION)
    TABLE 80. ASIA-PACIFIC MARINE AUTONOMOUS NAVIGATION MARKET, BY SYSTEM, 2021-2031 ($MILLION)
    TABLE 81. ASIA-PACIFIC SPACE AUTONOMOUS NAVIGATION MARKET, BY SYSTEM, 2021-2031 ($MILLION)
    TABLE 82. ASIA-PACIFIC WEAPONS AUTONOMOUS NAVIGATION MARKET, BY SYSTEM, 2021-2031 ($MILLION)
    TABLE 83. ASIA-PACIFIC AUTONOMOUS NAVIGATION MARKET, BY APPLICATION, 2021-2031 ($MILLION)
    TABLE 84. CHINA AUTONOMOUS NAVIGATION MARKET, BY SYSTEM, 2021-2031 ($MILLION)
    TABLE 85. CHINA AUTONOMOUS NAVIGATION MARKET, BY PLATFORM, 2021-2031 ($MILLION)
    TABLE 86. CHINA AUTONOMOUS NAVIGATION MARKET, BY APPLICATION, 2021-2031 ($MILLION)
    TABLE 87. JAPAN AUTONOMOUS NAVIGATION MARKET, BY SYSTEM, 2021-2031 ($MILLION)
    TABLE 88. JAPAN AUTONOMOUS NAVIGATION MARKET, BY PLATFORM, 2021-2031 ($MILLION)
    TABLE 89. JAPAN AUTONOMOUS NAVIGATION MARKET, BY APPLICATION, 2021-2031 ($MILLION)
    TABLE 90. INDIA AUTONOMOUS NAVIGATION MARKET, BY SYSTEM, 2021-2031 ($MILLION)
    TABLE 91. INDIA AUTONOMOUS NAVIGATION MARKET, BY PLATFORM, 2021-2031 ($MILLION)
    TABLE 92. INDIA AUTONOMOUS NAVIGATION MARKET, BY APPLICATION, 2021-2031 ($MILLION)
    TABLE 93. SOUTH KOREA AUTONOMOUS NAVIGATION MARKET, BY SYSTEM, 2021-2031 ($MILLION)
    TABLE 94. SOUTH KOREA AUTONOMOUS NAVIGATION MARKET, BY PLATFORM, 2021-2031 ($MILLION)
    TABLE 95. SOUTH KOREA AUTONOMOUS NAVIGATION MARKET, BY APPLICATION, 2021-2031 ($MILLION)
    TABLE 96. AUSTRALIA AUTONOMOUS NAVIGATION MARKET, BY SYSTEM, 2021-2031 ($MILLION)
    TABLE 97. AUSTRALIA AUTONOMOUS NAVIGATION MARKET, BY PLATFORM, 2021-2031 ($MILLION)
    TABLE 98. AUSTRALIA AUTONOMOUS NAVIGATION MARKET, BY APPLICATION, 2021-2031 ($MILLION)
    TABLE 99. SINGAPORE AUTONOMOUS NAVIGATION MARKET, BY SYSTEM, 2021-2031 ($MILLION)
    TABLE 100. SINGAPORE AUTONOMOUS NAVIGATION MARKET, BY PLATFORM, 2021-2031 ($MILLION)
    TABLE 101. SINGAPORE AUTONOMOUS NAVIGATION MARKET, BY APPLICATION, 2021-2031 ($MILLION)
    TABLE 102. REST OF ASIA-PACIFIC AUTONOMOUS NAVIGATION MARKET, BY SYSTEM, 2021-2031 ($MILLION)
    TABLE 103. REST OF ASIA-PACIFIC AUTONOMOUS NAVIGATION MARKET, BY PLATFORM, 2021-2031 ($MILLION)
    TABLE 104. REST OF ASIA-PACIFIC AUTONOMOUS NAVIGATION MARKET, BY APPLICATION, 2021-2031 ($MILLION)
    TABLE 105. LAMEA AUTONOMOUS NAVIGATION MARKET, BY COUNTRY, 2021-2031 ($MILLION)
    TABLE 106. LAMEA AUTONOMOUS NAVIGATION MARKET, BY SYSTEM, 2021-2031 ($MILLION)
    TABLE 107. LAMEA AUTONOMOUS NAVIGATION MARKET, BY PLATFORM, 2021-2031 ($MILLION)
    TABLE 108. LAMEA AIRBORNE AUTONOMOUS NAVIGATION MARKET, BY SYSTEM, 2021-2031 ($MILLION)
    TABLE 109. LAMEA LAND AUTONOMOUS NAVIGATION MARKET, BY SYSTEM, 2021-2031 ($MILLION)
    TABLE 110. LAMEA MARINE AUTONOMOUS NAVIGATION MARKET, BY SYSTEM, 2021-2031 ($MILLION)
    TABLE 111. LAMEA SPACE AUTONOMOUS NAVIGATION MARKET, BY SYSTEM, 2021-2031 ($MILLION)
    TABLE 112. LAMEA WEAPONS AUTONOMOUS NAVIGATION MARKET, BY SYSTEM, 2021-2031 ($MILLION)
    TABLE 113. LAMEA AUTONOMOUS NAVIGATION MARKET, BY APPLICATION, 2021-2031 ($MILLION)
    TABLE 114. LATIN AMERICA AUTONOMOUS NAVIGATION MARKET, BY SYSTEM, 2021-2031 ($MILLION)
    TABLE 115. LATIN AMERICA AUTONOMOUS NAVIGATION MARKET, BY PLATFORM, 2021-2031 ($MILLION)
    TABLE 116. LATIN AMERICA AUTONOMOUS NAVIGATION MARKET, BY APPLICATION, 2021-2031 ($MILLION)
    TABLE 117. MIDDLE EAST AUTONOMOUS NAVIGATION MARKET, BY SYSTEM, 2021-2031 ($MILLION)
    TABLE 118. MIDDLE EAST AUTONOMOUS NAVIGATION MARKET, BY PLATFORM, 2021-2031 ($MILLION)
    TABLE 119. MIDDLE EAST AUTONOMOUS NAVIGATION MARKET, BY APPLICATION, 2021-2031 ($MILLION)
    TABLE 120. AFRICA AUTONOMOUS NAVIGATION MARKET, BY SYSTEM, 2021-2031 ($MILLION)
    TABLE 121. AFRICA AUTONOMOUS NAVIGATION MARKET, BY PLATFORM, 2021-2031 ($MILLION)
    TABLE 122. AFRICA AUTONOMOUS NAVIGATION MARKET, BY APPLICATION, 2021-2031 ($MILLION)
    TABLE 123. ABB: KEY EXECUTIVES
    TABLE 124. ABB: COMPANY SNAPSHOT
    TABLE 125. ABB: OPERATING SEGMENTS
    TABLE 126. ABB: PRODUCT PORTFOLIO
    TABLE 127. ABB: R&D EXPENDITURE, 2019–2021 ($MILLION)
    TABLE 128. ABB: NET SALES, 2019–2021 ($MILLION)
    TABLE 129. ABB: KEY STRATEGIC MOVES AND DEVELOPMENTS
    TABLE 130. ABB: KEY EXECUTIVES
    TABLE 131. ABB: COMPANY SNAPSHOT
    TABLE 132. ABB: PRODUCT PORTFOLIO
    TABLE 133. ENWAY: KEY STRATEGIC MOVES AND DEVELOPMENTS
    TABLE 134. FIXPOSITION AG.: KEY EXECUTIVES
    TABLE 135. FIXPOSITION AG: COMPANY SNAPSHOT
    TABLE 136. FIXPOSITION AG: PRODUCT PORTFOLIO
    TABLE 137. FIXPOSITION AG: KEY STRATEGIC MOVES AND DEVELOPMENTS
    TABLE 138. FURUNO ELECTRIC CO., LTD.: KEY EXECUTIVES
    TABLE 139. FURUNO ELECTRIC CO., LTD.: COMPANY SNAPSHOT
    TABLE 140. FURUNO ELECTRIC CO., LTD.: OPERATING SEGMENTS
    TABLE 141. FURUNO ELECTRIC CO., LTD.: PRODUCT PORTFOLIO
    TABLE 142. FURUNO ELECTRIC CO., LTD.: R&D EXPENDITURE, 2019–2021 ($MILLION)
    TABLE 143. FURUNO ELECTRIC CO., LTD..: NET SALES, 2019–2021 ($MILLION)
    TABLE 144. FURUNO ELECTRIC CO., LTD.: KEY STRATEGIC MOVES AND DEVELOPMENTS
    TABLE 145. GENERAL DYNAMICS CORPORATION.: KEY EXECUTIVES
    TABLE 146. GENERAL DYNAMICS CORPORATION: COMPANY SNAPSHOT
    TABLE 147. GENERAL DYNAMICS CORPORATION: OPERATING SEGMENTS
    TABLE 148. GENERAL DYNAMICS CORPORATION: PRODUCT PORTFOLIO
    TABLE 149. GENERAL DYNAMICS CORPORATION: R&D EXPENDITURE, 2019–2021 ($MILLION)
    TABLE 150. GENERAL DYNAMICS CORPORATION: NET SALES, 2019–2021 ($MILLION)
    TABLE 151. GENERAL DYNAMICS CORPORATION: KEY STRATEGIC MOVES AND DEVELOPMENTS
    TABLE 152. HONEYWELL INTERNATIONAL INC.: KEY EXECUTIVES
    TABLE 153. HONEYWELL INTERNATIONAL INC.: COMPANY SNAPSHOT
    TABLE 154. HONEYWELL INTERNATIONAL INC.: OPERATING SEGMENTS
    TABLE 155. HONEYWELL INTERNATIONAL INC.: PRODUCT PORTFOLIO
    TABLE 156. HONEYWELL INTERNATIONAL INC.: R&D EXPENDITURE, 2019–2021 ($MILLION)
    TABLE 157. HONEYWELL INTERNATIONAL INC.: NET SALES, 2019–2021 ($MILLION)
    TABLE 158. HONEYWELL INTERNATIONAL INC.: KEY STRATEGIC MOVES AND DEVELOPMENTS
    TABLE 159. KEY EXECUTIVES
    TABLE 160. KONGSBERG: COMPANY SNAPSHOT
    TABLE 161. KONGSBERG: OPERATING SEGMENTS
    TABLE 162. KONGSBERG: PRODUCT PORTFOLIO.
    TABLE 163. KONGSBERG: R&D EXPENDITURE, 2019–2021 ($MILLION)
    TABLE 164. KONGSBERG: NET SALES, 2019–2021 ($MILLION)
    TABLE 165. KONGSBERG: KEY STRATEGIC MOVES AND DEVELOPMENTS
    TABLE 166. L3HARRIS TECHNOLOGIES: KEY EXECUTIVES
    TABLE 167. L3HARRIS TECHNOLOGIES: COMPANY SNAPSHOT
    TABLE 168. L3HARRIS TECHNOLOGIES: OPERATING SEGMENTS
    TABLE 169. L3HARRIS TECHNOLOGIES: PRODUCT PORTFOLIO
    TABLE 170. L3HARRIS TECHNOLOGIES: R&D EXPENDITURE, 2019–2021 ($MILLION)
    TABLE 171. L3HARRIS TECHNOLOGIES: NET SALES, 2019–2021 ($MILLION)
    TABLE 172. L3HARRIS TECHNOLOGIES: KEY STRATEGIC MOVES AND DEVELOPMENTS
    TABLE 173. MOOG INC.: KEY EXECUTIVES
    TABLE 174. MOOG INC.: COMPANY SNAPSHOT
    TABLE 175. MOOG INC.: PRODUCT PORTFOLIO
    TABLE 176. MOOG INC.: R&D EXPENDITURE, 2019–2021 ($MILLION)
    TABLE 177. MOOG INC.: NET SALES, 2019–2021 ($MILLION)
    TABLE 178. NAVENTIK: KEY EXECUTIVES
    TABLE 179. NAVENTIK: COMPANY SNAPSHOT
    TABLE 180. NAVENTIK: PRODUCT PORTFOLIO
    TABLE 181. NAVENTIK: KEY STRATEGIC MOVES AND DEVELOPMENTS
    TABLE 182. NORTHROP GRUMMAN: KEY EXECUTIVES
    TABLE 183. NORTHROP GRUMMAN: COMPANY SNAPSHOT
    TABLE 184. NORTHROP GRUMMAN: OPERATING SEGMENTS
    TABLE 185. NORTHROP GRUMMAN: PRODUCT PORTFOLIO
    TABLE 186. NORTHROP GRUMMAN: R&D EXPENDITURE, 2019–2021 ($MILLION)
    TABLE 187. NORTHROP GRUMMAN: NET SALES, 2019–2021 ($MILLION)
    TABLE 188. NORTHROP GRUMMAN: KEY STRATEGIC MOVES AND DEVELOPMENTS
    TABLE 189. RAYTHEON TECHNOLOGIES CORPORATION: KEY EXECUTIVES
    TABLE 190. RAYTHEON TECHNOLOGIES CORPORATION: COMPANY SNAPSHOT
    TABLE 191. RAYTHEON TECHNOLOGIES CORPORATION: OPERATING SEGMENTS
    TABLE 192. RAYTHEON TECHNOLOGIES CORPORATION: PRODUCT PORTFOLIO
    TABLE 193. RAYTHEON TECHNOLOGIES CORPORATION: R&D EXPENDITURE, 2019–2021 ($MILLION)
    TABLE 194. RAYTHEON TECHNOLOGIES CORPORATION: NET SALES, 2019–2021 ($MILLION)
    TABLE 195. RAYTHEON TECHNOLOGIES CORPORATION: KEY STRATEGIC MOVES AND DEVELOPMENTS
    TABLE 196. RH MARINE: KEY EXECUTIVES
    TABLE 197. RH MARINE: COMPANY SNAPSHOT
    TABLE 198. RH MARINE: PRODUCT PORTFOLIO
    TABLE 199. RH MARINE: KEY STRATEGIC MOVES AND DEVELOPMENTS
    TABLE 200. ROLLS-ROYCE PLC: KEY EXECUTIVES
    TABLE 201. ROLLS-ROYCE: COMPANY SNAPSHOT
    TABLE 202. ROLLS-ROYCE: OPERATING SEGMENTS
    TABLE 203. ROLLS-ROYCE: PRODUCT PORTFOLIO
    TABLE 204. ROLLS-ROYCE PLC: R&D EXPENDITURE, 2019–2021 ($MILLION)
    TABLE 205. ROLLS-ROYCE PLC: NET SALES, 2019–2021 ($MILLION)
    TABLE 206. SAFRAN: KEY EXECUTIVE(S)
    TABLE 207. SAFRAN: COMPANY SNAPSHOT
    TABLE 208. SAFRAN: OPERATING SEGMENTS
    TABLE 209. SAFRAN: PRODUCT PORTFOLIO
    TABLE 210. SAFRAN: R&D EXPENDITURE, 2019–2021 ($MILLION)
    TABLE 211. SAFRAN: NET SALES, 2019–2021 ($MILLION)
    TABLE 212. SAFRAN: KEY STRATEGIC MOVES AND DEVELOPMENTS
    TABLE 213. THALES: KEY EXECUTIVE(S)
    TABLE 214. THALES: COMPANY SNAPSHOT
    TABLE 215. THALES: OPERATING SEGMENTS
    TABLE 216. THALES: PRODUCT PORTFOLIO
    TABLE 217. THALES: R&D EXPENDITURE, 2019–2021 ($MILLION)
    TABLE 218. THALES: NET SALES, 2019–2021 ($MILLION)
    TABLE 219. THALES: KEY STRATEGIC MOVES AND DEVELOPMENTS
    TABLE 220. TRIMBLE INC.: KEY EXECUTIVES
    TABLE 221. TRIMBLE INC.: COMPANY SNAPSHOT
    TABLE 222. TRIMBLE INC.: OPERATING SEGMENTS
    TABLE 223. TRIMBLE INC.: PRODUCT PORTFOLIO
    TABLE 224. TRIMBLE INC.: R&D EXPENDITURE, 2019–2021 ($MILLION)
    TABLE 225. TRIMBLE INC.: NET SALES, 2019–2021 ($MILLION)
    TABLE 226. TRIMBLE INC.: KEY STRATEGIC MOVES AND DEVELOPMENTS
    TABLE 227. BLICKFELD GMBH: KEY EXECUTIVES
    TABLE 228. BLICKFELD GMBH: COMPANY SNAPSHOT
    TABLE 229. BLICKFELD GMBH: PRODUCT PORTFOLIO
    TABLE 230. BLICKFELD GMBH: KEY STRATEGIC MOVES AND DEVELOPMENTS
    TABLE 231. MODALAI: KEY EXECUTIVES
    TABLE 232. MODALAI: COMPANY SNAPSHOT
    TABLE 233. MODALAI: PRODUCT PORTFOLIO
    TABLE 234. MODALAI : KEY STRATEGIC MOVES AND DEVELOPMENTS
    TABLE 235. STARFISH SPACE.: KEY EXECUTIVES
    TABLE 236. STARFISH SPACE.: COMPANY SNAPSHOT
    TABLE 237. STARFISH SPACE.: PRODUCT PORTFOLIO
    TABLE 238. STARFISH SPACE.: KEY STRATEGIC MOVES AND DEVELOPMENTS
    TABLE 239. TRUSTPOINT, INC.: KEY EXECUTIVES
    TABLE 240. TRUSTPOINT, INC.: COMPANY SNAPSHOT
    TABLE 241. TRUSTPOINT, INC.: PRODUCT PORTFOLIO
    TABLE 242. TRUSTPOINT, INC.: KEY STRATEGIC MOVES AND DEVELOPMENTS
    TABLE 243. XONA SPACE SYSTEMS: KEY EXECUTIVES
    TABLE 244. XONA SPACE SYSTEMS: COMPANY SNAPSHOT
    TABLE 245. XONA SPACE SYSTEMS: PRODUCT PORTFOLIO
    TABLE 246. XONA SPACE SYSTEMS: KEY STRATEGIC MOVES AND DEVELOPMENTS
  • LIST OF FIGURES

  • FIGURE 01. KEY MARKET SEGMENTS
    FIGURE 02. AUTONOMOUS NAVIGATION MARKET SNAPSHOT, BY SEGMENTATION, 2021-2031
    FIGURE 03. AUTONOMOUS NAVIGATION MARKET SNAPSHOT, BY REGION, 2021-2031
    FIGURE 04. TOP IMPACTING FACTORS
    FIGURE 05. TOP INVESTMENT POCKETS
    FIGURE 06. TOP WINNING STRATEGIES, BY YEAR, 2019-2022*
    FIGURE 07. TOP WINNING STRATEGIES, BY DEVELOPMENT, 2019-2022*
    FIGURE 08. TOP WINNING STRATEGIES, BY COMPANY, 2019-2022*
    FIGURE 09. MODERATE-TO-HIGH BARGAINING POWER OF SUPPLIERS
    FIGURE 10. MODERATE-TO-HIGH THREAT OF NEW ENTRANTS
    FIGURE 11. MODERATE-TO-HIGH THREAT OF SUBSTITUTES
    FIGURE 12. MODERATE-TO-HIGH INTENSITY OF COMPETITIVE RIVALRY
    FIGURE 13. LOW-TO-HIGH BARGAINING POWER OF BUYERS
    FIGURE 14. KEY PLAYER POSITIONING (2021)
    FIGURE 15. AUTONOMOUS NAVIGATION MARKET SHARE, BY SYSTEM, 2021-2031 (%)
    FIGURE 16. COMPARATIVE SHARE ANALYSIS OF AUTONOMOUS NAVIGATION MARKET FOR SENSING SYSTEM, BY COUNTRY, 2021 & 2031 ($MILLION)
    FIGURE 17. COMPARATIVE SHARE ANALYSIS OF AUTONOMOUS NAVIGATION MARKET FOR PROCESSING SYSTEM, BY COUNTRY, 2021 & 2031 ($MILLION)
    FIGURE 18. COMPARATIVE SHARE ANALYSIS OF AUTONOMOUS NAVIGATION MARKET FOR SOFTWARE SYSTEM, BY COUNTRY, 2021 & 2031 ($MILLION)
    FIGURE 19. AUTONOMOUS NAVIGATION MARKET SHARE, BY PLATFORM, 2021-2031 (%)
    FIGURE 20. COMPARATIVE SHARE ANALYSIS OF AUTONOMOUS NAVIGATION MARKET FOR AIRBORNE, BY COUNTRY, 2021 & 2031 ($MILLION)
    FIGURE 21. COMPARATIVE SHARE ANALYSIS OF AUTONOMOUS NAVIGATION MARKET FOR LAND, BY COUNTRY, 2021 & 2031 ($MILLION)
    FIGURE 22. COMPARATIVE SHARE ANALYSIS OF AUTONOMOUS NAVIGATION MARKET FOR MARINE, BY COUNTRY, 2021 & 2031 ($MILLION)
    FIGURE 23. COMPARATIVE SHARE ANALYSIS OF AUTONOMOUS NAVIGATION MARKET FOR SPACE, BY COUNTRY, 2021 & 2031 ($MILLION)
    FIGURE 24. COMPARATIVE SHARE ANALYSIS OF AUTONOMOUS NAVIGATION MARKET FOR WEAPONS, BY COUNTRY, 2021 & 2031 ($MILLION)
    FIGURE 25. AUTONOMOUS NAVIGATION MARKET SHARE, BY APPLICATION, 2021-2031 (%)
    FIGURE 26. COMPARATIVE SHARE ANALYSIS OF AUTONOMOUS NAVIGATION MARKET FOR COMMERCIAL, BY COUNTRY, 2021 & 2031 ($MILLION)
    FIGURE 27. COMPARATIVE SHARE ANALYSIS OF AUTONOMOUS NAVIGATION MARKET FOR MILITARY, BY COUNTRY, 2021 & 2031 ($MILLION)
    FIGURE 28. COMPARATIVE SHARE ANALYSIS OF AUTONOMOUS NAVIGATION MARKET FOR GOVERNMENT, BY COUNTRY, 2021 & 2031 ($MILLION)
    FIGURE 29. AUTONOMOUS NAVIGATION MARKET, BY REGION, 2021-2031 (%)
    FIGURE 30. COMPARATIVE SHARE ANALYSIS OF AUTONOMOUS NAVIGATION MARKET, BY COUNTRY, 2021-2031 ($MILLION)
    FIGURE 31. U.S. AUTONOMOUS NAVIGATION MARKET, 2021-2031 ($MILLION)
    FIGURE 32. CANADA AUTONOMOUS NAVIGATION MARKET, 2021-2031 ($MILLION)
    FIGURE 33. MEXICO AUTONOMOUS NAVIGATION MARKET, 2021-2031 ($MILLION)
    FIGURE 34. COMPARATIVE SHARE ANALYSIS OF AUTONOMOUS NAVIGATION MARKET, BY COUNTRY, 2021-2031 ($MILLION)
    FIGURE 35. UK AUTONOMOUS NAVIGATION MARKET, 2021-2031 ($MILLION)
    FIGURE 36. GERMANY AUTONOMOUS NAVIGATION MARKET, 2021-2031 ($MILLION)
    FIGURE 37. FRANCE AUTONOMOUS NAVIGATION MARKET, 2021-2031 ($MILLION)
    FIGURE 38. RUSSIA AUTONOMOUS NAVIGATION MARKET, 2021-2031 ($MILLION)
    FIGURE 39. ITALY AUTONOMOUS NAVIGATION MARKET, 2021-2031 ($MILLION)
    FIGURE 40. SPAIN AUTONOMOUS NAVIGATION MARKET, 2021-2031 ($MILLION)
    FIGURE 41. GREECE AUTONOMOUS NAVIGATION MARKET, 2021-2031 ($MILLION)
    FIGURE 42. NORWAY AUTONOMOUS NAVIGATION MARKET, 2021-2031 ($MILLION)
    FIGURE 43. REST OF EUROPE AUTONOMOUS NAVIGATION MARKET, 2021-2031 ($MILLION)
    FIGURE 44. COMPARATIVE SHARE ANALYSIS OF AUTONOMOUS NAVIGATION MARKET, BY COUNTRY, 2021-2031 ($MILLION)
    FIGURE 45. CHINA AUTONOMOUS NAVIGATION MARKET, 2021-2031 ($MILLION)
    FIGURE 46. JAPAN AUTONOMOUS NAVIGATION MARKET, 2021-2031 ($MILLION)
    FIGURE 47. INDIA AUTONOMOUS NAVIGATION MARKET, 2021-2031 ($MILLION)
    FIGURE 48. SOUTH KOREA AUTONOMOUS NAVIGATION MARKET, 2021-2031 ($MILLION)
    FIGURE 49. AUSTRALIA AUTONOMOUS NAVIGATION MARKET, 2021-2031 ($MILLION)
    FIGURE 50. SINGAPORE AUTONOMOUS NAVIGATION MARKET, 2021-2031 ($MILLION)
    FIGURE 51. REST OF ASIA-PACIFIC AUTONOMOUS NAVIGATION MARKET, 2021-2031 ($MILLION)
    FIGURE 52. COMPARATIVE SHARE ANALYSIS OF AUTONOMOUS NAVIGATION MARKET, BY COUNTRY, 2021-2031 ($MILLION)
    FIGURE 53. LATIN AMERICA AUTONOMOUS NAVIGATION MARKET, 2021-2031 ($MILLION)
    FIGURE 54. MIDDLE EAST AUTONOMOUS NAVIGATION MARKET, 2021-2031 ($MILLION)
    FIGURE 55. AFRICA AUTONOMOUS NAVIGATION MARKET, 2021-2031 ($MILLION)
    FIGURE 56. ABB: R&D EXPENDITURE, 2019–2021 ($MILLION)
    FIGURE 57. ABB: NET SALES, 2019–2021 ($MILLION)
    FIGURE 58. ABB: REVENUE SHARE BY SEGMENT, 2021 (%)
    FIGURE 59. ABB: REVENUE SHARE BY REGION, 2021 (%)
    FIGURE 60. FURUNO ELECTRIC CO., LTD.: R&D EXPENDITURE, 2019–2021 ($MILLION)
    FIGURE 61. HITACHI LTD.: NET SALES, 2019–2021 ($MILLION)
    FIGURE 62. FURUNO ELECTRIC CO., LTD.: REVENUE SHARE BY SEGMENT, 2021 (%)
    FIGURE 63. FURUNO ELECTRIC CO., LTD.: REVENUE SHARE BY REGION, 2021 (%)
    FIGURE 64. GENERAL DYNAMICS CORPORATION: R&D EXPENDITURE, 2019–2021 ($MILLION)
    FIGURE 65. GENERAL DYNAMICS CORPORATION: REVENUE, 2019–2021 ($MILLION)
    FIGURE 66. GENERAL DYNAMICS CORPORATION: REVENUE SHARE BY SEGMENT, 2021(%)
    FIGURE 67. GENERAL DYNAMICS CORPORATION: REVENUE SHARE BY REGION, 2021(%)
    FIGURE 68. HONEYWELL INTERNATIONAL INC.: R&D EXPENDITURE, 2019–2021 ($MILLION)
    FIGURE 69. HONEYWELL INTERNATIONAL INC.: REVENUE, 2019–2021 ($MILLION)
    FIGURE 70. HONEYWELL INTERNATIONAL INC.: REVENUE SHARE BY SEGMENT, 2021 (%)
    FIGURE 71. HONEYWELL INTERNATIONAL INC.: REVENUE SHARE BY REGION, 2021 (%)
    FIGURE 72. KONGSBERG: R&D EXPENDITURE, 2019 –2021 ($MILLION)
    FIGURE 73. KONGSBERG: NET SALES, 2019–2021 ($MILLION)
    FIGURE 74. KONGSBERG: REVENUE SHARE BY SEGMENT, 2021 (%)
    FIGURE 75. KONGSBERG: REVENUE SHARE BY REGION, 2021 (%)
    FIGURE 76. L3HARRIS TECHNOLOGIES: R&D EXPENDITURE, 2019–2021 ($MILLION)
    FIGURE 77. L3HARRIS TECHNOLOGIES: NET SALES, 2019–2021 ($MILLION)
    FIGURE 78. L3HARRIS TECHNOLOGIES: REVENUE SHARE BY SEGMENT, 2021 (%)
    FIGURE 79. L3HARRIS TECHNOLOGIES: REVENUE SHARE BY REGION, 2021 (%)
    FIGURE 80. MOOG INC.: R&D EXPENDITURE, 2019–2021 ($MILLION)
    FIGURE 81. MOOG INC.: NET SALES, 2019–2021 ($MILLION)
    FIGURE 82. MOOG INC.: REVENUE SHARE BY SEGMENT, 2021 (%)
    FIGURE 83. NORTHROP GRUMMAN: R&D EXPENDITURE, 2019–2021 ($MILLION)
    FIGURE 84. NORTHROP GRUMMAN: NET SALES, 2019–2021 ($MILLION)
    FIGURE 85. NORTHROP GRUMMAN: REVENUE SHARE BY SEGMENT, 2021 (%)
    FIGURE 86. NORTHROP GRUMMAN: REVENUE SHARE BY REGION, 2021 (%)
    FIGURE 87. RAYTHEON TECHNOLOGIES CORPORATION: R&D EXPENDITURE, 2019–2021 ($MILLION)
    FIGURE 88. RAYTHEON TECHNOLOGIES CORPORATION: NET SALES, 2019–2021 ($MILLION)
    FIGURE 89. RAYTHEON TECHNOLOGIES CORPORATION: REVENUE SHARE BY SEGMENT, 2021 (%)
    FIGURE 90. RAYTHEON TECHNOLOGIES CORPORATION: REVENUE SHARE BY REGION, 2021 (%)
    FIGURE 91. ROLLS-ROYCE PLC: R&D EXPENDITURE, 2019–2021 ($MILLION)
    FIGURE 92. ROLLS-ROYCE PLC: REVENUE, 2019–2021 ($MILLION)
    FIGURE 93. ROLLS-ROYCE PLC: REVENUE SHARE BY SEGMENT, 2021 (%)
    FIGURE 94. ROLLS-ROYCE PLC: REVENUE SHARE BY REGION, 2021 (%)
    FIGURE 95. SAFRAN: R&D EXPENDITURE, 2019–2021 ($MILLION)
    FIGURE 96. SAFRAN: REVENUE, 2019–2021 ($MILLION)
    FIGURE 97. SAFRAN: REVENUE SHARE BY SEGMENT, 2021 (%)
    FIGURE 98. THALES: R&D EXPENDITURE, 2019–2021 ($MILLION)
    FIGURE 99. THALES: REVENUE, 2019–2021 ($MILLION)
    FIGURE 100. THALES: REVENUE SHARE BY SEGMENT, 2021 (%)
    FIGURE 101. THALES: REVENUE SHARE BY REGION, 2021 (%)
    FIGURE 102. TRIMBLE INC.: R&D EXPENDITURE, 2019–2021 ($MILLION)
    FIGURE 103. TRIMBLE INC.: NET SALES, 2019–2021 ($MILLION)
    FIGURE 104. TRIMBLE INC.: REVENUE SHARE BY SEGMENT, 2021 (%)
    FIGURE 105. TRIMBLE INC.: REVENUE SHARE BY REGION, 2021 (%)


The rapid technological advancement of unmanned vehicles, policy initiatives, and the emergence of new user applications fuel the rise in demand for autonomous navigation system. In addition, many countries have begun to take steps towards adoption of AI-based robots, owing to industrial revolution, such as artificial intelligence & industry 4.0. Countries such as Israel, India, and Turkey are designing and developing AI-based robots for warfare. Recently, in November 2021, the Israel Defense Force (IDF) debuted the pack of AI-based drones used for combat operations to identify the targets. Moreover, the autonomous navigation market is expected to witness significant growth due to rise in collaboration of the market players with national agencies or organizations. For instance, in October 2021, Thales collaborated with CS GROUP, a specialist in smart cyber protected mission-critical systems to offer a complete navigation system for Navies surface ships. They system consisted of navigational features, such as high-precision pointing, gyrocompass, location, and navigation functionality for all types of naval platforms, such as surface combatants, submarines and autonomous vehicles.

In addition, development of sense and avoid systems in autonomous robots, the widespread deployment of autonomous robots for commercial and military purposes, and the demand for autonomous robots in logistics are all likely to drive the autonomous navigation industry forward. For instance, in May 2022, Raytheon Technologies Corporation’s subsidiary, Raytheon Anschütz signed a contract with BAE Systems Australia’s maritime division to design and manufacture a warship integrated navigation and bridge system (WINBS) for the Hunter class frigate program, which delivered nine of the world’s most advanced anti-submarine warfare frigates for the Royal Australian Navy (RAN). Also, in March 2021, Fixposition AG collaborated with Neolix Technologies Co. Ltd., a developer and manufacturer of unmanned logistics vehicles to integrate advanced navigation features in its vehicles. Under this collaboration, Fixposition provided Neolix with the localization technology that helped them travel through difficult environments, such as urban canyons, beneath bridges and underpasses, and parking garages.

The market growth is supplemented by factors such as increase in demand for sense & avoid system in autonomous system, rise in adoption of autonomous robot in commercial & military applications, and increase in demand for real-time data in military applications supplement the growth of the autonomous navigation market. However, lack of standard infrastructure for operation of autonomous systems in developing countries and privacy & security concerns related to data are the factors expected to hamper the growth of the autonomous navigation market. In addition, increase in demand for improved surveillance and proactive government initiatives & support are expected to create ample opportunities for the key players operating in the autonomous navigation market.

Among the analyzed regions, Asia-Pacific is the highest revenue contributor, followed by Europe, North America, and LAMEA. On the basis of forecast analysis, North America is expected to lead during the forecast period, due to increase in trend towards offering autonomous navigation system in vehicles across the region.

PURCHASE OPTIONS

Call or Email us

U.S.-Canada Toll-free: +1-800-792-5285
Int'l : +1-503-894-6022
Europe : +44-845-528-1300
Email : help@alliedmarketresearch.com
 
FREQUENTLY ASKED QUESTIONS?

A. Introduction of autonomous execution system are the upcoming trends of Autonomous Navigation Market in the world

A. Usage in military, defense, vehicle industry are the leading application of Autonomous Navigation Market

A. Asia-Pacific is the largest regional market for Autonomous Navigation

A. The global autonomous navigation market was valued at $3,273.3 million in 2021, and is projected to reach $15,905.16 million by 2031, registering a CAGR of 17.1% from 2022 to 2031

A. The leading players operating in the autonomous navigation market are ABB, ENWAY, Fixposition AG, Furuno, General Dynamics, Honeywell International, Kongsberg Gruppen, L3 Harris Technologies, Moog Inc., NAVENTIK GmbH and others

Looking for Customization?

 Customization Request

Have a Question?

 Speak with Analyst

Any Confusion?

 Inquire Before Buying

Have a glance of the Report

  Request Sample
RELATED TAGS

Purchase Full Report of
Autonomous Navigation Market

Start reading instantly.
This Report and over 67,404+ more Reports, Available with Avenue Library. T&C*.

  • Online Only
  • $3,456
  • Online cloud access only
  • Restricted print, copy, paste & download
  • Read only
  • Free industry update
    (Within 180 days)
  • Free report update in next update cycle
    (Jul 2023 - Jul 2024)
  • Data Pack
  • $3,840
  • Restricted to one authorized user
  • One print only
  • Available in
    Excel
  • Free industry update
    (Within 180 days)
  •   Free report update in next update cycle
    (Jul 2023 - Jul 2024)
  • Single User
  • $5,769
  • Restricted to one authorized user
  • One print only
  • Available in
    PDF
  • Free industry update
    (Within 180 days)
  •   Free report update in next update cycle
    (Jul 2023 - Jul 2024)
  • Five Users
  • $6,450
  • Limited to five authorized users
  • Print upto five copies
  • Available in
    PDF
  • Free industry update
    (Within 180 days)
  •   Free report update in next update cycle
    (Jul 2023 - Jul 2024)
  • Enterprise
    License/PDF

  • $10,995
  • Unlimited
    within
    company/enterprise
  • Available in Excel & PDF
  • Free industry update
    (Within 180 days)
  •   Free report update in next update cycle
    (Jul 2023 - Jul 2024)
  • Library
    Membership

  • $999 $ 1,175
    Per User/ Per month/ Billed annually
  • Published Content
    E-access
  • Company Profiles
    E-access
  • Newly Added Content Access
  • 10 PDF
    Downloads
  • 5 Excel Data
    Pack Downloads
  • 250 Company Profiles PDF Downloads
  • Buy Now

*Taxes/Fees, if applicable will be added during checkout. All prices in USD

RELATED REPORTS
 

Why Allied Market Research?


Infallible Methodology

To ensure high-level data integrity, accurate analysis, and impeccable forecasts

Analyst Support

For complete satisfaction

Customization

On-demand customization of scope of the report to exactly meet your needs

TARGETED MARKET VIEW

Targeted market view to provide pertinent information and save time of readers

Get fresh content delivered

Get insights on topics that are crucial for your business. Stay abreast of your interest areas.

Get Industry Data Alerts

Why Allied Market Research?

Infallible Methodology

To ensure high-level data integrity, accurate analysis, and impeccable forecasts

Analyst Support

For complete satisfaction

Customization

On-demand customization of scope of the report to exactly meet your needs

TARGETED MARKET VIEW

Targeted market view to provide pertinent information and save time of readers