Report Code: A04923 | May 2019 | Pages: 250 | ||
Tables: 137 | Charts: 39 |
|
Pandemic disrupted the entire world and affected many industries.
Get detailed COVID-19 impact analysis on the 
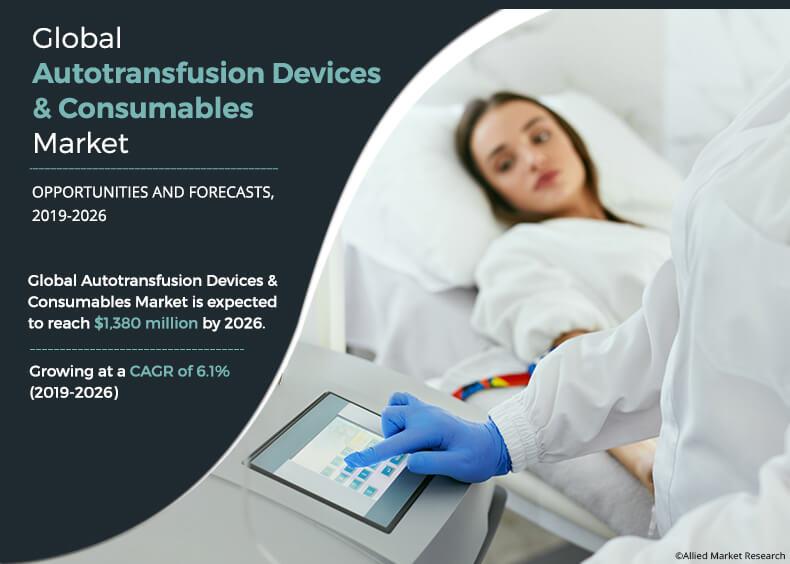
Autotransfusion Devices And Consumables Market
Request Now !Blood transfusion is a process of transferring of blood or blood components from a donor to a receiver intravenously. This process is used to replace the loss of blood count during various medical conditions. Blood transfusions are of two types—allogeneic blood transfusion and autologous blood transfusion. Allogeneic blood transfusion involves transfusion of blood from a donor to a recipient. Whereas, autotransfusion is a process of autologous blood transfusion in a patient’s body during a cardiac or orthopedic surgery, patient receives its own blood after component separation, washing, and filtration. After purification is complete, the blood is reinfused into the patient’s body. The risk of postoperative transfusion transmitted infection is very low in autologous blood transfusion as compared to allogeneic blood transfusion, which has a higher chance of transfusion transmitted infection. The global autotransfusion devices and consumables market size was valued at $864 million in 2018 and is estimated to reach $1,380 million by 2026, growing at a CAGR of 6.1% from 2019 to 2026.
There are three different methods of autologous transfusion. These include cell salvage, preoperative autologous donation, and acute normovolemic hemodilution or ANH. In cell salvage method, the blood is pumped out from the patient’s body and is infused back during the surgery. Cell salvage method can be further bifurcated into intraoperative and postoperative cell savage method. Preoperative autologous donation or PAD involves the donation of blood by a patient, which can be used by themselves in future. PAD involves is mostly used in hip replacement, hysterectomy, and total knee replacement surgeries. Acute normovolemic hemodilation is blood conservation technique in which the blood from the patient is removed after inducing anesthesia while maintaining the normal volume of blood in the body using crystalloid or colloidal replacement.
The global autotransfusion devices and consumables market is driven by increased prevalence of cardiac and vascular diseases, transplantation related infections, higher preference of people for autotransfusion technique over allogeneic due to higher chances of graft versus host disease induced infection, rise in the number of orthopedic, cardiac and vascular surgeries, and technological advancements in the development of autotransfusion devices and consumables. Furthermore, untapped market potential in developing regions with more population and lack of healthcare amenities is expected to provide lucrative opportunities for autotransfusion devices and consumables market trends. However, higher cost related with devices used for autotransfusion and its maintenance is expected to restrain the autotransfusion devices and consumables market growth as people in a developing nation would opt for allogeneic blood transfusion technique due to its cost effectiveness.
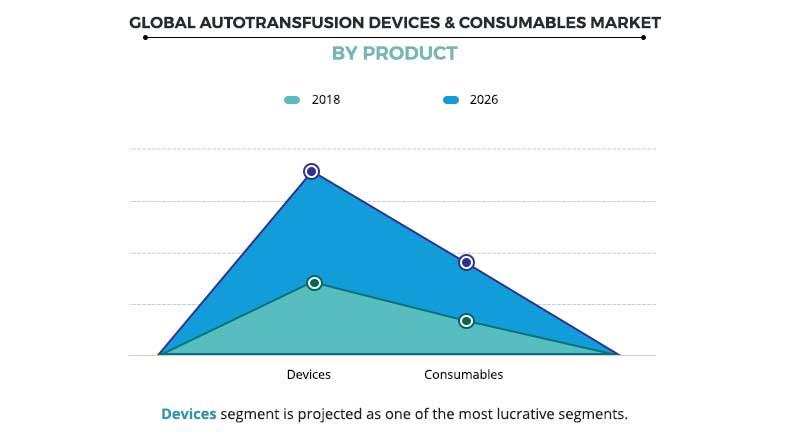
Product type segment review
Based on product type, the autotransfusion devices and consumables market can be segmented into devices and consumables. Devices can be further bifurcated into on pump transfusion devices and off pump transfusion devices. According to product type, the devices segment accounted for the highest share in 2018, whereas consumables is expected to be the fastest growing segment during the forecast period for global autotransfusion devices and consumables market. However, consumables used during the autotransfusion method are disposed and nor reused; thus, this segment is expected to be the fastest growing sector in the product type segment during the forecast period. The factors contributing toward the growth of autotransfusion devices and consumables market include lesser risk of transfusion transmitted infection, efficiency, and edge over other blood transfusion devices.
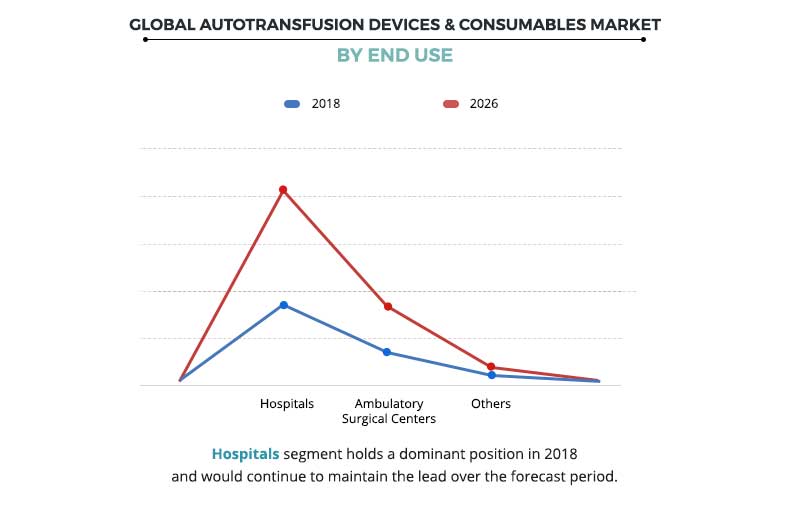
End Use segment review
Based on end use, the global autotransfusion devices and consumables market is segmented into hospitals, ambulatory surgical settings, and others. Among the end use, hospitals segment is the highest contributor for the end use segment and is expected to propagate at a higher growth rate owing to the preference over other centers owing to the availability of better autotransfusion facilities and patient care. However, ambulatory surgical settings is expected to be the fastest growing segment for global autotransfusion devices and consumables market.
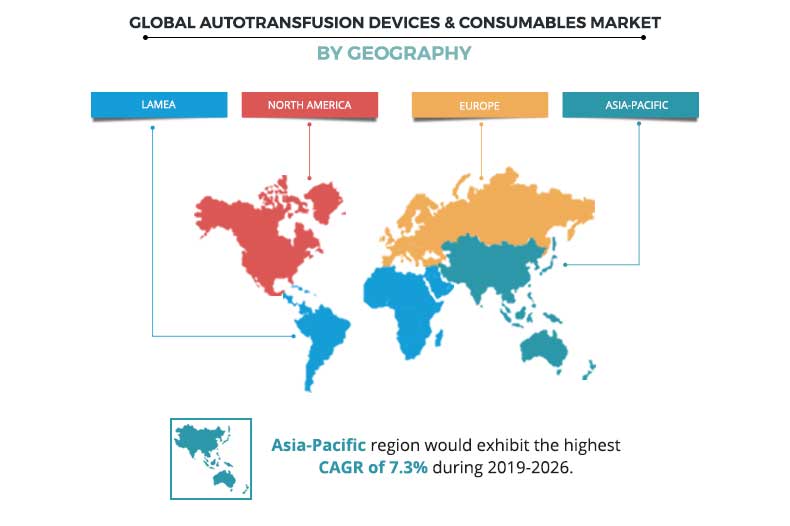
Region segment review
Based on regional presence, the global autotransfusion devices and consumables market is segmented into—North America, Europe, Asia-Pacific, and LAMEA. North America is the leading region for the global autotransfusion devices market due to better health care infrastructure and facilities, rise number of patient suffering from cardiovascular, orthopedic diseases, and increase in geriatric population, leading to a higher probability for the transplantation of organs. Emerging market such as LAMEA is expected to experience delayed growth owing to poor infrastructure and healthcare facilities along with lack of awareness amongst the population. Most of the developed countries have adopted autotransfusion technique, devices and consumables owing to the emphasis by the government bodies due to lesser risk of transfusion transmitted infection which has propelled the market growth throughout the autotransfusion devices and consumables market forecast period.
The report provides a comprehensive analysis of the key players operating in the global autotransfusion devices and consumables market. These players are Haemonetics, Becton, Dickinson and Company, Brightwake, Getinge AB, Fresenius Kabi, LivaNova, Medtronic, Advancis Surgical and Stryker.
Autotransfusion Devices and Consumables Market Report Highlights
Aspects | Details |
---|---|
By Product Type |
|
By End Use |
|
By Region |
|
Key Market Players | Brightwake Ltd., LivaNova PLC, Haemonetics Corporation, Fresenius, Stryker, Getinge AB, Becton, Dickinson and Company (C.R. Bard), Medtronic Plc. |
CHAPTER 1:Â Â Â INTRODUCTION
1.1.   Report description
1.2.   Research methodology
1.2.1.   Secondary research
1.2.2.   Primary research
1.2.3.   Analyst tools & models
CHAPTER 2:Â Â Â EXECUTIVE SUMMARY
2.1.   Key findings
2.1.1.   Top investment pockets
2.2.   CXO perspective
CHAPTER 3:Â Â Â MARKET OVERVIEW
3.1.   Market definition and scope
3.2.   Parent Market Overview
3.3.   Key Forces Shaping Autotransfusion devices and consumables market
3.3.1.   Moderate bargaining power of suppliers
3.3.2.   High bargaining power of buyers
3.3.3.   High threat of new entrants
3.3.4.   Moderate threat of substitutes
3.3.5.   High intensity of rivalry
3.4.   Pricing Analysis
3.4.1.   Pricing Analysis, By Region, 2018 & 2025
3.5.   Market evolution/Industry roadmap
3.6.   Value Chain Analysis
3.7.   Impact of government regulations on global autotransfusion devices and consumables market
3.8.   Industry pain point analysis
3.9.   Patent Analysis
3.9.1.   By Region (2016-2018)
3.9.2.   By Applicant
3.10.   Market share analysis
3.11.   Case Studies
3.11.1.   Case Study
3.12.   Market dynamics
3.12.1.   Drivers
3.12.1.1.   Technological advancement in the Autotransfusion system
3.12.1.2.   Increased prevalence of Cardiovascular diseases
3.12.2.   Restraints
3.12.2.1.   Lack of skilled technicians for handling the Autotransfusion System
3.12.3.   Opportunities
3.12.3.1.   Increased adoption of Autotransfusion system
CHAPTER 4:Â Â Â AUTOTRANSFUSION DEVICES AND CONSUMABLES MARKET, BY PRODUCT TYPE
4.1.   Overview
4.1.1.   Market size and forecast
4.2.   Devices
4.2.1.   Key market trends and opportunities
4.2.2.   Market size and forecast
4.2.3.   Market analysis, by country
4.2.4.   On Pump Transfusion Devices
4.2.4.1.   Key market trends and opportunities
4.2.4.2.   Market size and forecast
4.2.4.3.   Market analysis, by country
4.2.5.   Off-Pump Transfusion Devices
4.2.5.1.   Key market trends and opportunities
4.2.5.2.   Market size and forecast
4.2.5.3.   Market analysis, by country
4.3.   Consumables
4.3.1.   Key market trends and opportunities
4.3.2.   Market size and forecast
4.3.4.   Market analysis, by country
CHAPTER 5:Â Â Â AUTOTRANSFUSION DEVICES AND CONSUMABLES MARKET, BY END USE
5.1.   Overview
5.1.1.   Market size and forecast
5.2.   Hospitals
5.2.1.   Key market trends and opportunities
5.2.2.   Market size and forecast
5.2.3.   Market analysis, by country
5.3.   Ambulatory Surgical Centers
5.3.1.   Key market trends and opportunities
5.3.2.   Market size and forecast
5.3.3.   Market analysis, by country
5.4.   Others
5.4.1.   Key market trends and opportunities
5.4.2.   Market size and forecast
5.4.3.   Market analysis, by country
CHAPTER 6:Â Â Â AUTOTRANSFUSION DEVICES AND CONSUMABLES MARKET, BY REGION
6.1.   Overview
6.1.1.   Market size and forecast
6.2.   North America
6.2.1.   Key market trends and opportunities
6.2.2.   North America market size and forecast, by Product type
6.2.3.   North America market size and forecast, by end use
6.2.5.   North America market size and forecast, by country
6.2.5.1.   U.S. market size and forecast, by product type
6.2.5.2.   U.S. market size and forecast, by end use
6.2.5.4.   Canada market size and forecast, by product type
6.2.5.5.   Canada market size and forecast, by end use
6.2.5.6.   Mexico market size and forecast, by product type
6.2.5.7.   Mexico market size and forecast, by end use
6.3.   Europe
6.3.1.   Key market trends and opportunities
6.3.2.   Europe market size and forecast, by product type
6.3.3.   Europe market size and forecast, by end use
6.3.4.   Europe market size and forecast, by country
6.3.4.1.   Germany market size and forecast, by product type
6.3.4.2.   Germany market size and forecast, by end use
6.3.4.3.   France market size and forecast, by product type
6.3.4.4.   France market size and forecast, by end use
6.3.4.6.   UK market size and forecast, by product type
6.3.4.7.   UK market size and forecast, by end use
6.3.4.8.   Italy market size and forecast, by product type
6.3.4.9.   Italy market size and forecast, by end use
6.3.4.10.   Spain market size and forecast, by product type
6.3.4.11.   Spain market size and forecast, by end use
6.3.4.12.   Rest of Europe market size and forecast, by product type
6.3.4.13.   Rest of Europe market size and forecast, by end use
6.4.   Asia-Pacific
6.4.1.   Key market trends and opportunities
6.4.2.   Asia-Pacific market size and forecast, by product type
6.4.3.   Asia-Pacific market size and forecast, by end use
6.4.4.   Asia-Pacific market size and forecast, by country
6.4.4.1.   Japan market size and forecast, by product type
6.4.4.2.   Japan market size and forecast, by end use
6.4.4.3.   China market size and forecast, by product type
6.4.4.4.   China market size and forecast, by end use
6.4.4.5.   India market size and forecast, by product type
6.4.4.6.   India market size and forecast, by end use
6.4.4.7.   Australia market size and forecast, by product type
6.4.4.8.   Australia market size and forecast, by end use
6.4.4.9.   Rest of Asia-Pacific market size and forecast, by product type
6.4.4.10.   Rest of Asia-Pacific market size and forecast, by end use
6.5.   LAMEA
6.5.1.   Key market trends and opportunities
6.5.2.   LAMEA market size and forecast, by product type
6.5.3.   LAMEA market size and forecast, by end use
6.5.4.   LAMEA market size and forecast, by country
6.5.4.1.   Brazil market size and forecast, by product type
6.5.4.2.   Brazil market size and forecast, by end use
6.5.4.3.   South Africa market size and forecast, by product type
6.5.4.4.   South Africa market size and forecast, by end use
6.5.4.5.   Rest of LAMEA market size and forecast, by product type
6.5.4.6.   Rest of LAMEA market size and forecast, by end use
CHAPTER 7:Â Â Â COMPANY PROFILES
7.1.   Becton, Dickinson and Company (C.R. Bard)
7.1.1.   Company overview
7.1.2.   Company snapshot
7.1.3.   Operating business segments
7.1.4.   Product portfolio
7.1.5.   Business performance
7.2.   Brightwake Ltd.
7.2.1.   Company overview
7.2.2.   Company snapshot
7.2.3.   Operating business segment
7.2.4.   Product portfolio
7.3.   Fresenius
7.3.1.   Company overview
7.3.2.   Company snapshot
7.3.3.   Operating business segments
7.3.4.   Product portfolio
7.3.5.   Business performance
7.3.6.   Key strategic moves and developments
7.4.   Getinge AB
7.4.1.   Company overview
7.4.2.   Company snapshot
7.4.3.   Operating business segments
7.4.4.   Product portfolio
7.4.5.   Business performance
7.5.   Haemonetics Corporation
7.5.1.   Company overview
7.5.2.   Company snapshot
7.5.3.   Operating business segments
7.5.4.   Product portfolio
7.5.5.   Business performance
7.6.   LivaNova PLC
7.6.1.   Company overview
7.6.2.   Company snapshot
7.6.3.   Operating business segments
7.6.4.   Product portfolio
7.6.5.   Business performance
7.7.   Medtronic Plc.
7.7.1.   Company overview
7.7.2.   Company snapshot
7.7.3.   Operating business segments
7.7.4.   Product portfolio
7.7.5.   Business performance
7.8.   Stryker
7.8.1.   Company overview
7.8.2.   Company snapshot
7.8.3.   Operating business segments
7.8.4.   Product portfolio
7.8.5.   Business performance
7.8.6.   Key strategic moves and developments
LIST OF TABLES
TABLE 01.   CASE STUDY
TABLE 02.   GLOBAL AUTOTRANSFUSION DEVICES AND CONSUMABLES MARKET, BY PRODUCT TYPE, 2018–2026 ($MILLION)
TABLE 03.   AUTOTRANSFUSION DEVICES AND CONSUMABLES MARKET FOR DEVICES, BY REGION, 2018–2026 ($MILLION)
TABLE 04.   AUTOTRANSFUSION DEVICES AND CONSUMABLES MARKET FOR CONSUMABLES, BY REGION, 2018–2026 ($MILLION)
TABLE 05.   GLOBAL AUTOTRANSFUSION DEVICES AND CONSUMABLES MARKET, BY END USE, 2018–2026, ($MILLION)
TABLE 06.   AUTOTRANSFUSION DEVICES AND CONSUMABLES MARKET FOR NUTRACEUTICALS, BY REGION, 2018–2026, ($MILLION)
TABLE 07.   AUTOTRANSFUSION DEVICES AND CONSUMABLES MARKET FOR COSMETICS, BY REGION, 2018–2026, ($MILLION)
TABLE 08.   AUTOTRANSFUSION DEVICES AND CONSUMABLES MARKET FOR FOOD AND BEVERAGES, BY REGION, 2018–2026, ($MILLION)
TABLE 09.   AUTOTRANSFUSION DEVICES AND CONSUMABLES MARKET, BY REGION, 2018–2026, ($MILLION)
TABLE 10.   NORTH AMERICA AUTOTRANSFUSION DEVICES AND CONSUMABLES MARKET, BY PRODUCT TYPE, 2018–2026, ($MILLION)
TABLE 11.   NORTH AMERICA AUTOTRANSFUSION DEVICES AND CONSUMABLES MARKET, BY END USE, 2018–2026, ($MILLION)
TABLE 12.   NORTH AMERICA AUTOTRANSFUSION DEVICES AND CONSUMABLES MARKET, BY COUNTRY 2018–2026, ($MILLION)
TABLE 13.   U.S. AUTOTRANSFUSION DEVICES AND CONSUMABLES MARKET, BY PRODUCT TYPE, 2018–2026, ($MILLION)
TABLE 14.   U.S. AUTOTRANSFUSION DEVICES AND CONSUMABLES MARKET, BY END USE, 2018–2026, ($MILLION)
TABLE 15.   CANADA AUTOTRANSFUSION DEVICES AND CONSUMABLES MARKET, BY PRODUCT TYPE2018–2026, ($MILLION)
TABLE 16.   CANADA AUTOTRANSFUSION DEVICES AND CONSUMABLES MARKET, BY END USE, 2018–2026, ($MILLION)
TABLE 17.   MEXICO AUTOTRANSFUSION DEVICES AND CONSUMABLES MARKET, BY PRODUCT TYPE, 2018–2026, ($MILLION)
TABLE 18.   MEXICO AUTOTRANSFUSION DEVICES AND CONSUMABLES MARKET, BY END USE, 2018–2026, ($MILLION)
TABLE 19.   EUROPE AUTOTRANSFUSION DEVICES AND CONSUMABLES MARKET, BY PRODUCT TYPE, 2018–2026, ($MILLION)
TABLE 20.   EUROPE AUTOTRANSFUSION DEVICES AND CONSUMABLES MARKET, BY END USE, 2018–2026, ($MILLION)
TABLE 21.   EUROPE AUTOTRANSFUSION DEVICES AND CONSUMABLES MARKET, BY COUNTRY, 2018–2026, ($MILLION)
TABLE 22.   EUROPE AUTOTRANSFUSION DEVICES AND CONSUMABLES MARKET, BY COUNTRY, 2018–2026, (TONS)
TABLE 23.   EUROPE AUTOTRANSFUSION DEVICES AND CONSUMABLES MARKET, BY COUNTRY, 2018–2026, ($MILLION)
TABLE 24.   GERMANY AUTOTRANSFUSION DEVICES AND CONSUMABLES MARKET, BY PRODUCT TYPE, 2018–2026, ($MILLION)
TABLE 25.   GERMANY AUTOTRANSFUSION DEVICES AND CONSUMABLES MARKET, BY END USE, 2018–2026, ($MILLION)
TABLE 26.   FRANCE AUTOTRANSFUSION DEVICES AND CONSUMABLES MARKET, BY PRODUCT TYPE, 2018–2026, ($MILLION)
TABLE 27.   FRANCE AUTOTRANSFUSION DEVICES AND CONSUMABLES MARKET, BY END USE, 2018–2026, ($MILLION)
TABLE 28.   UK AUTOTRANSFUSION DEVICES AND CONSUMABLES MARKET, BY PRODUCT TYPE, 2018–2026, ($MILLION)
TABLE 29.   UK AUTOTRANSFUSION DEVICES AND CONSUMABLES MARKET, BY END USE, 2018–2026, ($MILLION)
TABLE 30.   ITALY AUTOTRANSFUSION DEVICES AND CONSUMABLES MARKET, BY PRODUCT TYPE, 2018–2026, ($MILLION)
TABLE 31.   ITALY AUTOTRANSFUSION DEVICES AND CONSUMABLES MARKET, BY END USE, 2018–2026, ($MILLION)
TABLE 32.   SPAIN AUTOTRANSFUSION DEVICES AND CONSUMABLES MARKET, BY PRODUCT TYPE, 2018–2026, ($MILLION)
TABLE 33.   SPAIN AUTOTRANSFUSION DEVICES AND CONSUMABLES MARKET, BY END USE, 2018–2026, ($MILLION)
TABLE 34.   REST OF EUROPE AUTOTRANSFUSION DEVICES AND CONSUMABLES MARKET, BY PRODUCT TYPE, 2018–2026, ($MILLION)
TABLE 35.   REST OF EUROPE AUTOTRANSFUSION DEVICES AND CONSUMABLES MARKET, BY END USE, 2018–2026, ($MILLION)
TABLE 36.   ASIA-PACIFIC AUTOTRANSFUSION DEVICES AND CONSUMABLES MARKET, BY PRODUCT TYPE, 2018–2026, ($MILLION)
TABLE 37.   ASIA-PACIFIC AUTOTRANSFUSION DEVICES AND CONSUMABLES MARKET, BY END USE, 2018–2026, ($MILLION)
TABLE 38.   ASIA-PACIFIC AUTOTRANSFUSION DEVICES AND CONSUMABLES MARKET, BY COUNTRY, 2018–2026, ($MILLION)
TABLE 39.   ASIA-PACIFIC AUTOTRANSFUSION DEVICES AND CONSUMABLES MARKET, BY COUNTRY, 2018–2026, (TONS)
TABLE 40.   ASIA-PACIFIC AUTOTRANSFUSION DEVICES AND CONSUMABLES MARKET, BY COUNTRY, 2018–2026, ($MILLION)
TABLE 41.   JAPAN AUTOTRANSFUSION DEVICES AND CONSUMABLES MARKET, BY PRODUCT TYPE, 2018–2026, ($MILLION)
TABLE 42.   JAPAN AUTOTRANSFUSION DEVICES AND CONSUMABLES MARKET, BY END USE, 2018–2026, ($MILLION)
TABLE 43.   CHINA AUTOTRANSFUSION DEVICES AND CONSUMABLES MARKET, BY PRODUCT TYPE, 2018–2026, ($MILLION)
TABLE 44.   CHINA AUTOTRANSFUSION DEVICES AND CONSUMABLES MARKET, BY END USE, 2018–2026, ($MILLION)
TABLE 45.   INDIA AUTOTRANSFUSION DEVICES AND CONSUMABLES MARKET, BY PRODUCT TYPE, 2018–2026, ($MILLION)
TABLE 46.   INDIA AUTOTRANSFUSION DEVICES AND CONSUMABLES MARKET, BY END USE, 2018–2026, ($MILLION)
TABLE 47.   AUSTRALIA AUTOTRANSFUSION DEVICES AND CONSUMABLES MARKET, BY PRODUCT TYPE, 2018–2026, ($MILLION)
TABLE 48.   AUSTRALIA AUTOTRANSFUSION DEVICES AND CONSUMABLES MARKET, BY END USE, 2018–2026, ($MILLION)
TABLE 49.   REST OF ASIA-PACIFIC AUTOTRANSFUSION DEVICES AND CONSUMABLES MARKET, BY PRODUCT TYPE, 2018–2026, ($MILLION)
TABLE 50.   REST OF ASIA-PACIFIC AUTOTRANSFUSION DEVICES AND CONSUMABLES MARKET, BY END USE, 2018–2026, ($MILLION)
TABLE 51.   LAMEA AUTOTRANSFUSION DEVICES AND CONSUMABLES MARKET, BY PRODUCT TYPE, 2018–2026, ($MILLION)
TABLE 52.   LAMEA AUTOTRANSFUSION DEVICES AND CONSUMABLES MARKET, BY END USE, 2018–2026, ($MILLION)
TABLE 53.   LAMEA AUTOTRANSFUSION DEVICES AND CONSUMABLES MARKET, BY COUNTRY, 2018–2026, ($MILLION)
TABLE 54.   LAMEA AUTOTRANSFUSION DEVICES AND CONSUMABLES MARKET, BY COUNTRY, 2018–2026, (TONS)
TABLE 55.   LAMEA AUTOTRANSFUSION DEVICES AND CONSUMABLES MARKET, BY COUNTRY, 2018–2026, ($MILLION)
TABLE 56.   BRAZIL AUTOTRANSFUSION DEVICES AND CONSUMABLES MARKET, BY PRODUCT TYPE, 2018–2026, ($MILLION)
TABLE 57.   BRAZIL AUTOTRANSFUSION DEVICES AND CONSUMABLES MARKET, BY END USE, 2018–2026, ($MILLION)
TABLE 58.   SOUTH AFRICA AUTOTRANSFUSION DEVICES AND CONSUMABLES MARKET, BY PRODUCT TYPE, 2018–2026, ($MILLION)
TABLE 59.   SOUTH AFRICA AUTOTRANSFUSION DEVICES AND CONSUMABLES MARKET, BY END USE, 2018–2026, ($MILLION)
TABLE 60.   REST OF LAMEA AUTOTRANSFUSION DEVICES AND CONSUMABLES MARKET, BY PRODUCT TYPE, 2018–2026, ($MILLION)
TABLE 61.   REST OF LAMEA AUTOTRANSFUSION DEVICES AND CONSUMABLES MARKET, BY END USE, 2018–2026, ($MILLION)
TABLE 62.   BD: COMPANY SNAPSHOT
TABLE 63.   BD: OPERATING SEGMENTS
TABLE 64.   BD: PRODUCT PORTFOLIO
TABLE 65.   BRIGHTWAKE: COMPANY SNAPSHOT
TABLE 66.   BRIGHTWAKE: PRODUCT PORTFOLIO
TABLE 67.   FRESENIUS: COMPANY SNAPSHOT
TABLE 68.   FRESENIUS: OPERATING SEGMENTS
TABLE 69.   FRESENIUS: PRODUCT PORTFOLIO
TABLE 70.   GETINGE: COMPANY SNAPSHOT
TABLE 71.   GETINGE: OPERATING SEGMENTS
TABLE 72.   GETINGE: PRODUCT PORTFOLIO
TABLE 73.   HAEMONETICS LIMITED: COMPANY SNAPSHOT
TABLE 74.   HAEMONETICS LIMITED: OPERATING SEGMENTS
TABLE 75.   HAEMONETICS LIMITED: PRODUCT PORTFOLIO
TABLE 76.   LIVANOVA: COMPANY SNAPSHOT
TABLE 77.   LIVANOVA: OPERATING SEGMENTS
TABLE 78.   LIVANOVA: PRODUCT PORTFOLIO
TABLE 79.   MEDTRONIC: COMPANY SNAPSHOT
TABLE 80.   MEDTRONIC: OPERATING SEGMENTS
TABLE 81.   MEDTRONIC: PRODUCT PORTFOLIO
TABLE 82.   STRYKER: COMPANY SNAPSHOT
TABLE 83.   STRYKER: OPERATING SEGMENTS
TABLE 84.   STRYKER: PRODUCT PORTFOLIO
LIST OF FIGURES
FIGURE 01.   TOP INVESTMENT POCKETS, 2018
FIGURE 02.   PARENT MARKET
FIGURE 03.   MODERATE BARGAINING POWER OF SUPPLIERS
FIGURE 04.   HIGH BARGAINING POWER OF BUYERS
FIGURE 05.   HIGH THREAT OF NEW ENTRANTS
FIGURE 06.   MODERATE THREAT OF SUBSTITUTES
FIGURE 07.   HIGH INTENSITY OF RIVALRY
FIGURE 08.   PRICING ANALYSIS, BY REGION, 2018 & 2025
FIGURE 09.   VALUE CHAIN ANALYSIS
FIGURE 10.   INDUSTRY PAIN POINT ANALYSIS
FIGURE 11.   PATENT ANALYSIS, BY REGION
FIGURE 12.   PATENT ANALYSIS, BY APPLICANT
FIGURE 13.   MARKET SHARE ANALYSIS, 2018
FIGURE 14.   COMPARATIVE SHARE ANALYSIS OF AUTOTRANSFUSION DEVICES AND CONSUMABLES MARKET FOR DEVICES, BY COUNTRY, 2018 & 2026 (%)
FIGURE 15.   COMPARATIVE SHARE ANALYSIS OF AUTOTRANSFUSION DEVICES AND CONSUMABLES MARKET FOR CONSUMABLES, BY COUNTRY, 2018 & 2026 (%)
FIGURE 16.   COMPARATIVE SHARE ANALYSIS OF AUTOTRANSFUSION DEVICES AND CONSUMABLES MARKET FOR NUTRACEUTICALS, BY COUNTRY, 2018 & 2026 (%)
FIGURE 17.   COMPARATIVE SHARE ANALYSIS OF AUTOTRANSFUSION DEVICES AND CONSUMABLES MARKET FOR COSMETICS, BY COUNTRY, 2018 & 2026 (%)
FIGURE 18.   COMPARATIVE SHARE ANALYSIS OF AUTOTRANSFUSION DEVICES AND CONSUMABLES MARKET FOR FOOD AND BEVERAGES, BY COUNTRY, 2018 & 2026 (%)
FIGURE 19.   BD: NET SALES, 2016–2018 ($MILLION)
FIGURE 20.   BD: REVENUE SHARE BY SEGMENT, 2018 (%)
FIGURE 21.   BD: REVENUE SHARE BY GEOGRAPHY, 2018 (%)
FIGURE 22.   FRESENIUS: NET SALES, 2016–2018 ($MILLION)
FIGURE 23.   FRESSENIUS: REVENUE SHARE BY SEGMENT, 2018 (%)
FIGURE 24.   FRESSENIUS: REVENUE SHARE BY REGION, 2018 (%)
FIGURE 25.   GETINGE: NET SALES, 2015–2017 ($MILLION)
FIGURE 26.   GETINGE: REVENUE SHARE BY SEGMENT, 2018 (%)
FIGURE 27.   GETINGE: REVENUE SHARE BY GEOGRAPHY, 2018 (%)
FIGURE 28.   HAEMONETICS LIMITED: NET SALES, 2016–2018 ($MILLION)
FIGURE 29.   HAEMONETICS LIMITED: REVENUE SHARE BY SEGMENT, 2018 (%)
FIGURE 30.   HAEMONETICS LIMITED: REVENUE SHARE BY GEOGRAPHY, 2018 (%)
FIGURE 31.   LIVANOVA: NET SALES, 2016–2018 ($MILLION)
FIGURE 32.   LIVANOVA: REVENUE SHARE BY SEGMENT, 2018 (%)
FIGURE 33.   LIVANOVA: REVENUE SHARE BY GEOGRAPHY, 2018 (%)
FIGURE 34.   MEDTRONIC: NET SALES, 2016–2018 ($MILLION)
FIGURE 35.   MEDTRONIC: REVENUE SHARE BY SEGMENT, 2018 (%)
FIGURE 36.   MEDTRONIC: REVENUE SHARE BY GEOGRAPHY, 2018 (%)
FIGURE 37.   STRYKER: NET SALES, 2016–2018 ($MILLION)
FIGURE 38.   STRYKER: REVENUE SHARE BY SEGMENT, 2018 (%)
FIGURE 39.   STRYKER: REVENUE SHARE BY GEOGRAPHY, 2018 (%)
The technological advancements in the autotransfusion devices and adoption of the same during different surgeries such as cardiac, orthopedic, and vascular surgeries by healthcare professionals propelled the growth of the autotransfusion devices and consumables market. Moreover, autotransfusion devices and consumables market is anticipated to witness significant growth due to increase in cases of cardiovascular, orthopedic, and other diseases. In addition, the improvement in healthcare infrastructure in the developing nations with rise in government support for better healthcare facilities allow lucrative opportunities for the growth of this market. Furthermore, the autotransfusion devices and consumables market has gained immense interest of the healthcare industry due to its high importance and affordability in surgeries. Asia-Pacific is projected to register highest growth rate in the global autotransfusion devices & consumables market due to massively increasing population, higher prevalence of diseases, and growth in the healthcare market.
Autotransfusion devices and consumables have gained popularity in developing countries, as it is the most cost effective and time efficient for cardiac, trauma, and orthopedic surgeries. However, failure in qualitative purification of blood adverse effects in few patients are expected to restrain the market growth.
North America was the leading revenue contributor to the global autotransfusion devices and consumables market in 2018 and is expected to remain dominant throughout the forecast period. This is attributed to the increase in demand due to rise in safety concerns for transfusion transmitted infections caused during to allogeneic transfusion and preference of autotransfusion devices and consumables over allogeneic transfusion. However, Asia-Pacific is expected to grow at the highest CAGR during the study period, as it offers lucrative opportunities for the market players due to robust growth medical devices and consumables industry in the region.
Â
Start reading instantly.
This Report and over 67,068+ more Reports, Available with Avenue Library. T&C*.
Enterprise
License/PDF
Library
Membership
*Taxes/Fees, if applicable will be added during checkout. All prices in USD
To ensure high-level data integrity, accurate analysis, and impeccable forecasts
For complete satisfaction
On-demand customization of scope of the report to exactly meet your needs
Targeted market view to provide pertinent information and save time of readers
Get insights on topics that are crucial for your business. Stay abreast of your interest areas.
Get Industry Data AlertsTo ensure high-level data integrity, accurate analysis, and impeccable forecasts
For complete satisfaction
On-demand customization of scope of the report to exactly meet your needs
Targeted market view to provide pertinent information and save time of readers