0
New
New
2023
Banking Wearable Market

Banking Wearable Market

by Type (Fitness Tracker, Payment Wristbands, Smart Watches, Others), by Technology (Near Field Communication (NFC), Quick Response (QR) Codes, Radio Frequency Identification (RFID), Others), by Application (Retail, Entertainment Centers, Restaurants and Bars, Healthcare, Others): Global Opportunity Analysis and Industry Forecast, 2023-2032

Report Code: A06966
Jul 2023 | Pages: 266
Tables: 132
Charts: 67
  • Formats*:

  • pdf

    Single User License, Five User
    License & Enterprise User License

  • xls

    Data Pack Excel License

  • ppt

    It comes with the additional cost
    of $2500.00 contact sales.


Banking Wearable Market Research, 2032

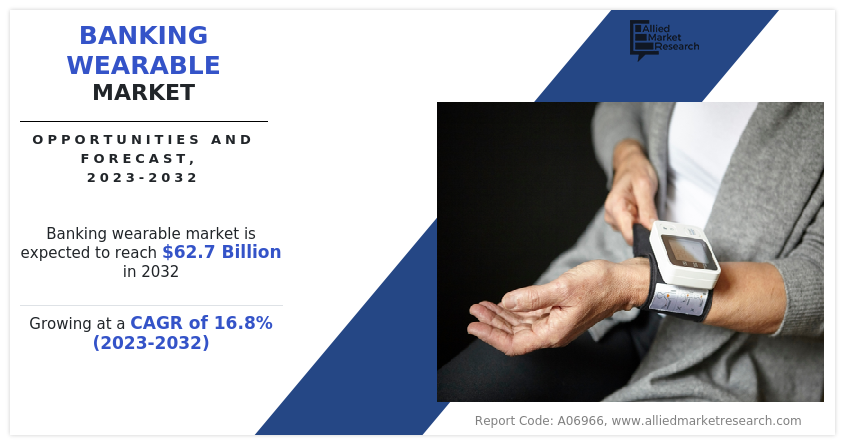
The global banking wearable market was valued at $13.7 billion in 2022, and is projected to reach $62.7 billion by 2032, growing at a CAGR of 16.8% from 2023 to 2032.

Banking wearable refers to a device that is designed to enable banking transactions and services through a wearable device, such as a smart watch or a fitness tracker. These wearables are typically equipped with technologies like near field communication (NFC) or Bluetooth that allow them to communicate with banking systems and perform various banking functions. One of the primary functions of banking wearables is to facilitate contactless payments. By linking the wearable device to a user's bank account or payment card, they can make purchases by simply tapping or waving the device near a compatible payment terminal.
The increase in demand for wearable payment devices is a key driver for the growth of banking wearable market. Wearable payment devices offer users a remarkable level of convenience and ease of use. These devices allow individuals to make payments effortlessly and seamlessly without the burden of carrying physical wallets or mobile phones. The inherent wearable design of these devices, such as smartwatches or fitness bands, grants users swift and convenient access to payment features, empowering them to conduct transactions on the move. In addition, the growth in adoption of cashless transactions and increase in demand for host card emulation (HCE) are the major driving factors for the market. However, the high cost of banking wearable devices is a major factor hampering the growth of the market. The high costs associated with banking wearable devices have prevented individuals and businesses from adopting these devices, which is hindering the growth of the market. In addition, fees vary for services related to wearable devices and contactless payments, such as maintenance, referrals, and upgrades. Contrarily, the increasing use of near field communication (NFC) and radio frequency identification (RFID) presents a significant opportunity for the banking wearable industry. NFC and RFID technologies provide enhanced security features for banking wearables. NFC facilitates secure communication between wearable devices and payment terminals, ensuring protection of sensitive payment information.

The report focuses on growth prospects, restraints, and trends of the banking wearable market analysis. The study provides Porter’s five forces analysis to understand the impact of various factors, such as bargaining power of suppliers, competitive intensity of competitors, threat of new entrants, threat of substitutes, and bargaining power of buyers, on the banking wearable market.

The pandemic accelerated the transition to contactless payment methods to minimize physical contact with surfaces. Payment-enabled wearables, such as smartwatches or wristbands, provided convenient and secure contactless payment options. As a result, demand for payment-enabled wearables increased during the pandemic.

Banking Wearable Market

The banking wearable market is segmented into Type, Technology and Application.

Segment Review

The banking wearable market is segmented on the basis of type, technology, application, and region. On the basis of type, it is categorized into fitness tracker, payment wristbands, smart watches, and others. By technology, it is divided into near field communication (NFC), quick response (QR) codes, radio frequency identification (RFID), and others. On the basis of application, it is classified into retail, entertainment centers, restaurants and bars, healthcare, and others. On the basis of region, it is analyzed across North America, Europe, Asia-Pacific, and LAMEA.   
Banking Wearable Market

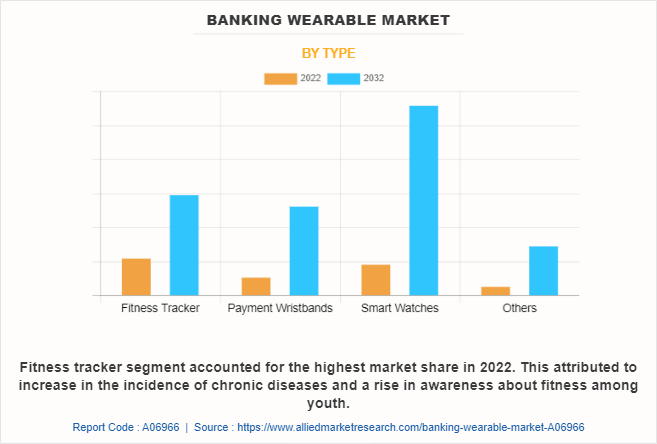
On the basis of type, the fitness tracker segment attained the highest banking wearable market size in 2022. This is attributed to the fact that customers are widely opting for fitness trackers owing to their increased safety feature, which protects them from frauds and identity thefts at the time of payment processes. In addition, many businesses have started incorporating mobile payments into their fitness trackers.  
Banking Wearable Market

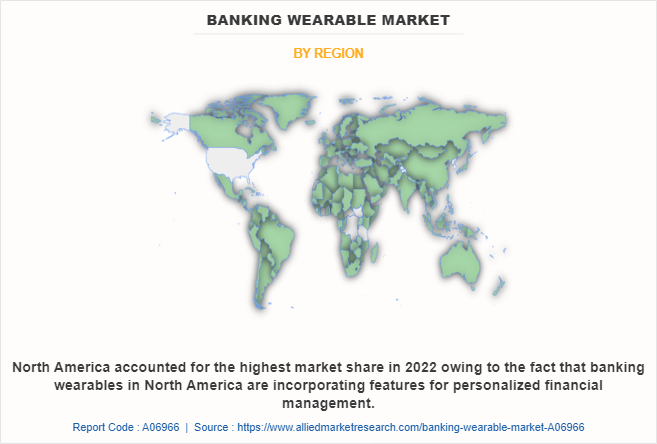
On the basis of region, North America held the highest banking wearable market share in 2022. Banking wearable’s in North America are incorporating features for personalized financial management. Users can track spending, set budgets, receive insights into financial habits, and get personalized recommendations to manage their finances more effectively. In addition, banking wearable’s in North America often work alongside existing mobile banking applications, allowing users to access account information and perform transactions seamlessly across devices.

The report analyzes the profiles of key players operating in the banking wearable market such as Google LLC, Apple Inc., Fidesmo, Xiaomi Corporation, Visa Inc., Wirecard, Thales, Nymi Inc., Gemalto NV, and Samsung Electronics. These players have adopted various strategies to increase their market penetration and strengthen their position in the banking wearable market.

Market Landscape and Trends

The adoption of banking wearables is steadily increasing due to technological advances and the popularity of wearable devices. With more consumers using smartwatches, fitness trackers, and other wearables, which has created a market opportunity for integrating banking and financial services into these devices.. Moreover, the decreasing costs for deploying NFC technology are encouraging the rise in demand for the technology. Businesses widely use this technology to transfer data from their devices to various contactless payment terminals, such as NFC tags and smartphones. In addition, the rapid growth in the use of contactless payments is driven by the mandates of digital payment networks by the governments across the globe, which, as a result, has increased the adoption of payment-enabled devices. Furthermore, the banking wearable market has also seen the emergence of startups and fintech companies that specialize in developing innovative banking solutions for wearables. These companies focus on creating user-friendly banking apps, advanced security features, and personalized financial insights for wearable devices. Therefore, the banking wearable industry is constantly evolving, with new trends emerging as technology advances.

Top Impacting Factors

Increase in demand for host card emulation (HCE) 

The increasing preference for convenience and speed in contactless transactions has spurred the demand for HCE technology. HCE technology help users to securely make contactless payments via their mobile devices, eliminating the need for physical cards. This viable solution simplifies the payment process and eliminates the need to carry multiple cards as consumers opt for contactless payments. Moreover, banking wearables with HCE technology offer a hassle-free and time-saving payment experience. Users can simply tap their wearable devices to make payments, eliminating the need for physical cards or mobile phones. This convenient feature makes the payment process easier, particularly in situations when accessing a phone or wallet is inconvenient. In addition, advancements in wearable technology such as improved sensors, longer battery life and improved connectivity are making it easier to integrate HCE functionality into banking wearables. Growing demand for HCE continues to drive innovation in the banking wearables market, resulting in more feature-rich and advanced devices. Furthermore, the combination of HCE and banking wearables creates a compelling value proposition that expands the market and drives adoption of these devices among tech-savvy consumers. Therefore, these trends are driving banking wearable market growth.

Growth in adoption of cashless transaction    

Cashless transactions offer convenience and speed to consumers as they do not need to carry physical cash and reduce transaction time. Banking wearables provide a seamless and efficient method of cashless payments. Users only need to tap or wave the wearable device to complete the transaction, which is faster and more convenient than traditional payment methods. Ease of use and fast payment processing are contributing to the growing demand for banking wearables. Moreover, the proliferation of digital wallets such as Apple Pay, Google Pay or Samsung Pay has played a vital role in driving the demand for banking wearables. These wallets allow users to securely store payment information on mobile devices and make transactions using NFC technology. Banking wearables seamlessly integrate with digital wallets, extending the convenience of cashless payments to the wearable form factor. Furthermore, the increasing popularity of cashless transactions has played a significant role in the expansion of the banking wearable market. For instance, as per LiveMint, the volume of digital payments in India has increased by 33% year-on-year during the financial year 2021-2022. A total of 7,422 crore digital payment transactions were recorded during this period, up from 5,554 crore transactions seen in FY 2020-21, said the Ministry of Electronics and IT (MeitY). This growth has been further driven by the convenience and enhanced security provided by banking wearables. 

Increase in demand for wearable payment devices

Wearable payment devices have become more accessible and compatible with a wide range of payment terminals. Many point-of-sale systems and retailers have upgraded their infrastructure to support contactless payments, including wearable devices, which has further fueled their demand. In addition, the appearance and layout of wearable payment devices have undergone changes to meet the preferences of fashion-savvy consumers. Currently, manufacturers provide fashionable and personalized choices that seamlessly merge technology and fashion, resulting in wearable payment devices that are more attractive and socially embraced. The fusion of fashion and technology has broadened the range of consumers, appealing to individuals who value both functionality and style. For instance, in March 2021, Axis Bank became the first bank in India to launch its own range of wearable contactless payment devices ‘Wear N Pay’, these wearable devices are directly linked to the customers’ bank account and function like a regular debit card. Furthermore, advancements in wearable technology, such as improved sensors, longer battery life, and enhanced connectivity, have played a significant role in the growth of wearable payment devices.  

High costs of banking wearable devices

The high costs associated with banking wearable devices have prevented individuals and businesses from adopting these devices, which is hindering the growth of the market. In addition, fees vary for services related to wearable devices and contactless payments, such as maintenance, referrals, and upgrades. Furthermore, the high initial production price of banking wearables leads to additional costs. In addition, banking wearable device manufacturers have to spend large sums of money on research, marketing and promotion, shipping, licensing, software, and wearable development, thus incurring significant costs. Moreover, high costs can impede the achievement of economies of scale. Manufacturing and producing banking wearable devices at large volumes can help reduce production costs per unit. Overall, high cost of banking wearable devices is major restraining factor for the growth of market.           

Increase in use of NFC and RFID

NFC and RFID technologies provide enhanced security features for banking wearables. NFC facilitates secure communication between wearable devices and payment terminals, ensuring protection of sensitive payment information. In addition, RFID technology enables secure access control and authentication, adding an extra layer of security to portable devices. The increasing emphasis on secure payment methods creates an opportunity for banking wearables that use NFC and RFID technology. Furthermore, the development of contactless cards and wearable devices by many manufacturers, including Apple, Samsung, and Huawei, uses NFC and RFID technologies, which are projected to provide lucrative chances for global market expansion. Additionally, many businesses are implementing host card emulation and NFC technology to give their customers simple access to the merchandise displayed on their smartphones. For instance, KFC launched an NFC-based advertising campaign in the UK in 2020. The campaign's main objective was to publicize KFC's Hot Shots Meal Box. KFC launched this service to encourage home delivery services and broaden the use of contactless payment methods. In addition, businesses are using host card emulation technology in their wearable devices to empower wearables and boost the performance of various mobile and wearable devices, which is a potential growth prospect for the industry.

Integration of digital banking services

The integration of banking wearables and digital banking services allow users to access various banking functions directly from their wearables. Users may check account balances, view transaction history, send money, receive real-time notifications, and more. This integration will enhance the overall banking experience, giving users convenient and instant access to financial information and services. In addition, integration with digital banking services allows for personalization and customization of banking wearables. Users can customize their preferences, such as selecting specific accounts to display, setting spending limits, or choosing notification preferences. Personalization features create a tailored experience, making banking wearables more engaging and relevant to individual users. Furthermore, digital banking services often incorporate robust security measures such as multi-factor authentication and real-time fraud detection. This integration ensures safe and secure transactions and increases user confidence when using banking wearables for financial transactions. These advantages create a compelling proposition for users, will contribute to the adoption and growth of banking wearable in the market.

Key Benefits for Stakeholders

  • This report provides a quantitative analysis of the market segments, current trends, estimations, and dynamics of the banking wearable market forecast from 2022 to 2032 to identify the prevailing market opportunities.
  • Market research is offered along with information related to key drivers, restraints, and opportunities of banking wearable market outlook.
  • Porter's five forces analysis highlights the potency of buyers and suppliers to enable stakeholders to make profit-oriented business decisions and strengthen their supplier-buyer network.
  •  In-depth analysis of the banking wearable market segmentation assists in determining the prevailing banking wearable market opportunity.
  • Major countries in each region are mapped according to their revenue contribution to the global market.
  • Market player positioning facilitates benchmarking and provides a clear understanding of the present position of the market players.
  • The report includes an analysis of the regional as well as global banking wearable market trends, key players, market segments, application areas, and market growth strategies.

Banking Wearable Market Report Highlights

Aspects Details
Market Size By 2032 USD 62.7 billion
Growth Rate CAGR of 16.8%
Forecast period 2022 - 2032
Report Pages 266
By Type
  • Fitness Tracker
  • Payment Wristbands
  • Smart Watches
  • Others
By Technology
  • Near Field Communication (NFC)
  • Quick Response (QR) Codes
  • Radio Frequency Identification (RFID)
  • Others
By Application
  • Retail
  • Entertainment Centers
  • Restaurants and Bars
  • Healthcare
  • Others
By Region
  • North America  (U.S., Canada)
  • Europe  (UK, Germany, France, Italy, Spain, Rest of Europe)
  • Asia-Pacific  (China, Japan, India, Australia, South Korea, Rest of Asia-Pacific)
  • LAMEA  (Latin America, Middle East, Africa)
Key Market Players Fidesmo, Apple Inc., Visa Inc., Thales, Google LLC, Wirecard, Nymi Inc., Xiaomi Corporation, Gemalto NV, Samsung Electronics

Analyst Review

As per the insights of the top-level CXOs, a banking wearable is a device developed to make it possible to access banking services and transactions using a wearable device, like a smart watch or a fitness tracker. These wearables commonly include near field communication (NFC) or Bluetooth technology, which enables them to interact with banking systems and carry out different financial tasks. Wearables for banking frequently have built-in security safeguards to safeguard user information and transactions. These include functions like remote wearable device deactivation in the event of loss or theft, secure encrypted communications, and biometric identification. Furthermore, banking wearables allow users to check their account balances conveniently. With just a glance at their wearable device, users can access their available funds without the need to log in to a banking app or visit an ATM.

The CXOs further added that market players are adopting strategies like partnership for enhancing their services in the market and improving customer satisfaction. For instance, in March 2023, DIGISEQ, the wearable payments tech pioneer, announced its partnership with financial super app, Curve, bringing large-scale wearable payment technology to the UK fintech’s 4 million customers across 31 European countries. Furthermore, the growth of the market is expected to be driven by the increasing use of contactless payments at places such as gas stations, toll stations, ticketing devices and vending machines. Therefore, such strategies are expected to boost the growth of the banking wearable market in the upcoming years.  

Moreover, some of the key players profiled in the report are Google LLC, Apple Inc., Fidesmo, Xiaomi Corporation, Visa Inc., Wirecard, Thales, Nymi Inc., Gemalto NV, and Samsung Electronics. These players have adopted various strategies to increase their market penetration and strengthen their position in the industry.  

 
  • CHAPTER 1: INTRODUCTION

    • 1.1. Report description

    • 1.2. Key market segments

    • 1.3. Key benefits to the stakeholders

    • 1.4. Research Methodology

      • 1.4.1. Primary research

      • 1.4.2. Secondary research

      • 1.4.3. Analyst tools and models

  • CHAPTER 2: EXECUTIVE SUMMARY

    • 2.1. CXO Perspective

  • CHAPTER 3: MARKET OVERVIEW

    • 3.1. Market definition and scope

    • 3.2. Key findings

      • 3.2.1. Top impacting factors

      • 3.2.2. Top investment pockets

    • 3.3. Porter’s five forces analysis

      • 3.3.1. Moderate-to-high bargaining power of suppliers

      • 3.3.2. Moderate-to-high threat of new entrants

      • 3.3.3. Low-to-moderate threat of substitutes

      • 3.3.4. Moderate-to-high intensity of rivalry

      • 3.3.5. Low-to-high bargaining power of buyers

    • 3.4. Market dynamics

      • 3.4.1. Drivers

        • 3.4.1.1. Growth in adoption of cashless transaction
        • 3.4.1.2. Increase in demand for host card emulation (HCE)
        • 3.4.1.3. Increase in demand for wearable payment devices

      • 3.4.2. Restraints

        • 3.4.2.1. High costs of banking wearable devices

      • 3.4.3. Opportunities

        • 3.4.3.1. Increase in use of NFC and RFID
        • 3.4.3.2. Integration of digital banking services

    • 3.5. COVID-19 Impact Analysis on the market

  • CHAPTER 4: BANKING WEARABLE MARKET, BY TYPE

    • 4.1. Overview

      • 4.1.1. Market size and forecast

    • 4.2. Fitness Tracker

      • 4.2.1. Key market trends, growth factors and opportunities

      • 4.2.2. Market size and forecast, by region

      • 4.2.3. Market share analysis by country

    • 4.3. Payment Wristbands

      • 4.3.1. Key market trends, growth factors and opportunities

      • 4.3.2. Market size and forecast, by region

      • 4.3.3. Market share analysis by country

    • 4.4. Smart Watches

      • 4.4.1. Key market trends, growth factors and opportunities

      • 4.4.2. Market size and forecast, by region

      • 4.4.3. Market share analysis by country

    • 4.5. Others

      • 4.5.1. Key market trends, growth factors and opportunities

      • 4.5.2. Market size and forecast, by region

      • 4.5.3. Market share analysis by country

  • CHAPTER 5: BANKING WEARABLE MARKET, BY TECHNOLOGY

    • 5.1. Overview

      • 5.1.1. Market size and forecast

    • 5.2. Near Field Communication (NFC)

      • 5.2.1. Key market trends, growth factors and opportunities

      • 5.2.2. Market size and forecast, by region

      • 5.2.3. Market share analysis by country

    • 5.3. Quick Response (QR) Codes

      • 5.3.1. Key market trends, growth factors and opportunities

      • 5.3.2. Market size and forecast, by region

      • 5.3.3. Market share analysis by country

    • 5.4. Radio Frequency Identification (RFID)

      • 5.4.1. Key market trends, growth factors and opportunities

      • 5.4.2. Market size and forecast, by region

      • 5.4.3. Market share analysis by country

    • 5.5. Others

      • 5.5.1. Key market trends, growth factors and opportunities

      • 5.5.2. Market size and forecast, by region

      • 5.5.3. Market share analysis by country

  • CHAPTER 6: BANKING WEARABLE MARKET, BY APPLICATION

    • 6.1. Overview

      • 6.1.1. Market size and forecast

    • 6.2. Retail

      • 6.2.1. Key market trends, growth factors and opportunities

      • 6.2.2. Market size and forecast, by region

      • 6.2.3. Market share analysis by country

    • 6.3. Entertainment Centers

      • 6.3.1. Key market trends, growth factors and opportunities

      • 6.3.2. Market size and forecast, by region

      • 6.3.3. Market share analysis by country

    • 6.4. Restaurants and Bars

      • 6.4.1. Key market trends, growth factors and opportunities

      • 6.4.2. Market size and forecast, by region

      • 6.4.3. Market share analysis by country

    • 6.5. Healthcare

      • 6.5.1. Key market trends, growth factors and opportunities

      • 6.5.2. Market size and forecast, by region

      • 6.5.3. Market share analysis by country

    • 6.6. Others

      • 6.6.1. Key market trends, growth factors and opportunities

      • 6.6.2. Market size and forecast, by region

      • 6.6.3. Market share analysis by country

  • CHAPTER 7: BANKING WEARABLE MARKET, BY REGION

    • 7.1. Overview

      • 7.1.1. Market size and forecast By Region

    • 7.2. North America

      • 7.2.1. Key trends and opportunities

      • 7.2.2. Market size and forecast, by Type

      • 7.2.3. Market size and forecast, by Technology

      • 7.2.4. Market size and forecast, by Application

      • 7.2.5. Market size and forecast, by country

        • 7.2.5.1. U.S.
          • 7.2.5.1.1. Key market trends, growth factors and opportunities
          • 7.2.5.1.2. Market size and forecast, by Type
          • 7.2.5.1.3. Market size and forecast, by Technology
          • 7.2.5.1.4. Market size and forecast, by Application
        • 7.2.5.2. Canada
          • 7.2.5.2.1. Key market trends, growth factors and opportunities
          • 7.2.5.2.2. Market size and forecast, by Type
          • 7.2.5.2.3. Market size and forecast, by Technology
          • 7.2.5.2.4. Market size and forecast, by Application
    • 7.3. Europe

      • 7.3.1. Key trends and opportunities

      • 7.3.2. Market size and forecast, by Type

      • 7.3.3. Market size and forecast, by Technology

      • 7.3.4. Market size and forecast, by Application

      • 7.3.5. Market size and forecast, by country

        • 7.3.5.1. UK
          • 7.3.5.1.1. Key market trends, growth factors and opportunities
          • 7.3.5.1.2. Market size and forecast, by Type
          • 7.3.5.1.3. Market size and forecast, by Technology
          • 7.3.5.1.4. Market size and forecast, by Application
        • 7.3.5.2. Germany
          • 7.3.5.2.1. Key market trends, growth factors and opportunities
          • 7.3.5.2.2. Market size and forecast, by Type
          • 7.3.5.2.3. Market size and forecast, by Technology
          • 7.3.5.2.4. Market size and forecast, by Application
        • 7.3.5.3. France
          • 7.3.5.3.1. Key market trends, growth factors and opportunities
          • 7.3.5.3.2. Market size and forecast, by Type
          • 7.3.5.3.3. Market size and forecast, by Technology
          • 7.3.5.3.4. Market size and forecast, by Application
        • 7.3.5.4. Italy
          • 7.3.5.4.1. Key market trends, growth factors and opportunities
          • 7.3.5.4.2. Market size and forecast, by Type
          • 7.3.5.4.3. Market size and forecast, by Technology
          • 7.3.5.4.4. Market size and forecast, by Application
        • 7.3.5.5. Spain
          • 7.3.5.5.1. Key market trends, growth factors and opportunities
          • 7.3.5.5.2. Market size and forecast, by Type
          • 7.3.5.5.3. Market size and forecast, by Technology
          • 7.3.5.5.4. Market size and forecast, by Application
        • 7.3.5.6. Rest of Europe
          • 7.3.5.6.1. Key market trends, growth factors and opportunities
          • 7.3.5.6.2. Market size and forecast, by Type
          • 7.3.5.6.3. Market size and forecast, by Technology
          • 7.3.5.6.4. Market size and forecast, by Application
    • 7.4. Asia-Pacific

      • 7.4.1. Key trends and opportunities

      • 7.4.2. Market size and forecast, by Type

      • 7.4.3. Market size and forecast, by Technology

      • 7.4.4. Market size and forecast, by Application

      • 7.4.5. Market size and forecast, by country

        • 7.4.5.1. China
          • 7.4.5.1.1. Key market trends, growth factors and opportunities
          • 7.4.5.1.2. Market size and forecast, by Type
          • 7.4.5.1.3. Market size and forecast, by Technology
          • 7.4.5.1.4. Market size and forecast, by Application
        • 7.4.5.2. Japan
          • 7.4.5.2.1. Key market trends, growth factors and opportunities
          • 7.4.5.2.2. Market size and forecast, by Type
          • 7.4.5.2.3. Market size and forecast, by Technology
          • 7.4.5.2.4. Market size and forecast, by Application
        • 7.4.5.3. India
          • 7.4.5.3.1. Key market trends, growth factors and opportunities
          • 7.4.5.3.2. Market size and forecast, by Type
          • 7.4.5.3.3. Market size and forecast, by Technology
          • 7.4.5.3.4. Market size and forecast, by Application
        • 7.4.5.4. Australia
          • 7.4.5.4.1. Key market trends, growth factors and opportunities
          • 7.4.5.4.2. Market size and forecast, by Type
          • 7.4.5.4.3. Market size and forecast, by Technology
          • 7.4.5.4.4. Market size and forecast, by Application
        • 7.4.5.5. South Korea
          • 7.4.5.5.1. Key market trends, growth factors and opportunities
          • 7.4.5.5.2. Market size and forecast, by Type
          • 7.4.5.5.3. Market size and forecast, by Technology
          • 7.4.5.5.4. Market size and forecast, by Application
        • 7.4.5.6. Rest of Asia-Pacific
          • 7.4.5.6.1. Key market trends, growth factors and opportunities
          • 7.4.5.6.2. Market size and forecast, by Type
          • 7.4.5.6.3. Market size and forecast, by Technology
          • 7.4.5.6.4. Market size and forecast, by Application
    • 7.5. LAMEA

      • 7.5.1. Key trends and opportunities

      • 7.5.2. Market size and forecast, by Type

      • 7.5.3. Market size and forecast, by Technology

      • 7.5.4. Market size and forecast, by Application

      • 7.5.5. Market size and forecast, by country

        • 7.5.5.1. Latin America
          • 7.5.5.1.1. Key market trends, growth factors and opportunities
          • 7.5.5.1.2. Market size and forecast, by Type
          • 7.5.5.1.3. Market size and forecast, by Technology
          • 7.5.5.1.4. Market size and forecast, by Application
        • 7.5.5.2. Middle East
          • 7.5.5.2.1. Key market trends, growth factors and opportunities
          • 7.5.5.2.2. Market size and forecast, by Type
          • 7.5.5.2.3. Market size and forecast, by Technology
          • 7.5.5.2.4. Market size and forecast, by Application
        • 7.5.5.3. Africa
          • 7.5.5.3.1. Key market trends, growth factors and opportunities
          • 7.5.5.3.2. Market size and forecast, by Type
          • 7.5.5.3.3. Market size and forecast, by Technology
          • 7.5.5.3.4. Market size and forecast, by Application
  • CHAPTER 8: COMPETITIVE LANDSCAPE

    • 8.1. Introduction

    • 8.2. Top winning strategies

    • 8.3. Product Mapping of Top 10 Player

    • 8.4. Competitive Dashboard

    • 8.5. Competitive Heatmap

    • 8.6. Top player positioning, 2022

  • CHAPTER 9: COMPANY PROFILES

    • 9.1. Google LLC

      • 9.1.1. Company overview

      • 9.1.2. Key Executives

      • 9.1.3. Company snapshot

      • 9.1.4. Operating business segments

      • 9.1.5. Product portfolio

      • 9.1.6. Business performance

      • 9.1.7. Key strategic moves and developments

    • 9.2. Thales

      • 9.2.1. Company overview

      • 9.2.2. Key Executives

      • 9.2.3. Company snapshot

      • 9.2.4. Operating business segments

      • 9.2.5. Product portfolio

      • 9.2.6. Business performance

      • 9.2.7. Key strategic moves and developments

    • 9.3. Apple Inc.

      • 9.3.1. Company overview

      • 9.3.2. Key Executives

      • 9.3.3. Company snapshot

      • 9.3.4. Operating business segments

      • 9.3.5. Product portfolio

      • 9.3.6. Business performance

      • 9.3.7. Key strategic moves and developments

    • 9.4. Fidesmo

      • 9.4.1. Company overview

      • 9.4.2. Key Executives

      • 9.4.3. Company snapshot

      • 9.4.4. Operating business segments

      • 9.4.5. Product portfolio

      • 9.4.6. Key strategic moves and developments

    • 9.5. Samsung Electronics

      • 9.5.1. Company overview

      • 9.5.2. Key Executives

      • 9.5.3. Company snapshot

      • 9.5.4. Operating business segments

      • 9.5.5. Product portfolio

      • 9.5.6. Business performance

      • 9.5.7. Key strategic moves and developments

    • 9.6. Xiaomi Corporation

      • 9.6.1. Company overview

      • 9.6.2. Key Executives

      • 9.6.3. Company snapshot

      • 9.6.4. Operating business segments

      • 9.6.5. Product portfolio

      • 9.6.6. Business performance

      • 9.6.7. Key strategic moves and developments

    • 9.7. Visa Inc.

      • 9.7.1. Company overview

      • 9.7.2. Key Executives

      • 9.7.3. Company snapshot

      • 9.7.4. Operating business segments

      • 9.7.5. Product portfolio

      • 9.7.6. Business performance

      • 9.7.7. Key strategic moves and developments

    • 9.8. Nymi Inc.

      • 9.8.1. Company overview

      • 9.8.2. Key Executives

      • 9.8.3. Company snapshot

      • 9.8.4. Operating business segments

      • 9.8.5. Product portfolio

      • 9.8.6. Key strategic moves and developments

    • 9.9. Wirecard

      • 9.9.1. Company overview

      • 9.9.2. Key Executives

      • 9.9.3. Company snapshot

      • 9.9.4. Operating business segments

      • 9.9.5. Product portfolio

    • 9.10. Gemalto NV

      • 9.10.1. Company overview

      • 9.10.2. Key Executives

      • 9.10.3. Company snapshot

      • 9.10.4. Operating business segments

      • 9.10.5. Product portfolio

  • LIST OF TABLES

  • TABLE 01. GLOBAL BANKING WEARABLE MARKET, BY TYPE, 2022-2032 ($MILLION)
    TABLE 02. BANKING WEARABLE MARKET FOR FITNESS TRACKER, BY REGION, 2022-2032 ($MILLION)
    TABLE 03. BANKING WEARABLE MARKET FOR PAYMENT WRISTBANDS, BY REGION, 2022-2032 ($MILLION)
    TABLE 04. BANKING WEARABLE MARKET FOR SMART WATCHES, BY REGION, 2022-2032 ($MILLION)
    TABLE 05. BANKING WEARABLE MARKET FOR OTHERS, BY REGION, 2022-2032 ($MILLION)
    TABLE 06. GLOBAL BANKING WEARABLE MARKET, BY TECHNOLOGY, 2022-2032 ($MILLION)
    TABLE 07. BANKING WEARABLE MARKET FOR NEAR FIELD COMMUNICATION (NFC), BY REGION, 2022-2032 ($MILLION)
    TABLE 08. BANKING WEARABLE MARKET FOR QUICK RESPONSE (QR) CODES, BY REGION, 2022-2032 ($MILLION)
    TABLE 09. BANKING WEARABLE MARKET FOR RADIO FREQUENCY IDENTIFICATION (RFID), BY REGION, 2022-2032 ($MILLION)
    TABLE 10. BANKING WEARABLE MARKET FOR OTHERS, BY REGION, 2022-2032 ($MILLION)
    TABLE 11. GLOBAL BANKING WEARABLE MARKET, BY APPLICATION, 2022-2032 ($MILLION)
    TABLE 12. BANKING WEARABLE MARKET FOR RETAIL, BY REGION, 2022-2032 ($MILLION)
    TABLE 13. BANKING WEARABLE MARKET FOR ENTERTAINMENT CENTERS, BY REGION, 2022-2032 ($MILLION)
    TABLE 14. BANKING WEARABLE MARKET FOR RESTAURANTS AND BARS, BY REGION, 2022-2032 ($MILLION)
    TABLE 15. BANKING WEARABLE MARKET FOR HEALTHCARE, BY REGION, 2022-2032 ($MILLION)
    TABLE 16. BANKING WEARABLE MARKET FOR OTHERS, BY REGION, 2022-2032 ($MILLION)
    TABLE 17. BANKING WEARABLE MARKET, BY REGION, 2022-2032 ($MILLION)
    TABLE 18. NORTH AMERICA BANKING WEARABLE MARKET, BY TYPE, 2022-2032 ($MILLION)
    TABLE 19. NORTH AMERICA BANKING WEARABLE MARKET, BY TECHNOLOGY, 2022-2032 ($MILLION)
    TABLE 20. NORTH AMERICA BANKING WEARABLE MARKET, BY APPLICATION, 2022-2032 ($MILLION)
    TABLE 21. NORTH AMERICA BANKING WEARABLE MARKET, BY COUNTRY, 2022-2032 ($MILLION)
    TABLE 22. U.S. BANKING WEARABLE MARKET, BY TYPE, 2022-2032 ($MILLION)
    TABLE 23. U.S. BANKING WEARABLE MARKET, BY TECHNOLOGY, 2022-2032 ($MILLION)
    TABLE 24. U.S. BANKING WEARABLE MARKET, BY APPLICATION, 2022-2032 ($MILLION)
    TABLE 25. CANADA BANKING WEARABLE MARKET, BY TYPE, 2022-2032 ($MILLION)
    TABLE 26. CANADA BANKING WEARABLE MARKET, BY TECHNOLOGY, 2022-2032 ($MILLION)
    TABLE 27. CANADA BANKING WEARABLE MARKET, BY APPLICATION, 2022-2032 ($MILLION)
    TABLE 28. EUROPE BANKING WEARABLE MARKET, BY TYPE, 2022-2032 ($MILLION)
    TABLE 29. EUROPE BANKING WEARABLE MARKET, BY TECHNOLOGY, 2022-2032 ($MILLION)
    TABLE 30. EUROPE BANKING WEARABLE MARKET, BY APPLICATION, 2022-2032 ($MILLION)
    TABLE 31. EUROPE BANKING WEARABLE MARKET, BY COUNTRY, 2022-2032 ($MILLION)
    TABLE 32. UK BANKING WEARABLE MARKET, BY TYPE, 2022-2032 ($MILLION)
    TABLE 33. UK BANKING WEARABLE MARKET, BY TECHNOLOGY, 2022-2032 ($MILLION)
    TABLE 34. UK BANKING WEARABLE MARKET, BY APPLICATION, 2022-2032 ($MILLION)
    TABLE 35. GERMANY BANKING WEARABLE MARKET, BY TYPE, 2022-2032 ($MILLION)
    TABLE 36. GERMANY BANKING WEARABLE MARKET, BY TECHNOLOGY, 2022-2032 ($MILLION)
    TABLE 37. GERMANY BANKING WEARABLE MARKET, BY APPLICATION, 2022-2032 ($MILLION)
    TABLE 38. FRANCE BANKING WEARABLE MARKET, BY TYPE, 2022-2032 ($MILLION)
    TABLE 39. FRANCE BANKING WEARABLE MARKET, BY TECHNOLOGY, 2022-2032 ($MILLION)
    TABLE 40. FRANCE BANKING WEARABLE MARKET, BY APPLICATION, 2022-2032 ($MILLION)
    TABLE 41. ITALY BANKING WEARABLE MARKET, BY TYPE, 2022-2032 ($MILLION)
    TABLE 42. ITALY BANKING WEARABLE MARKET, BY TECHNOLOGY, 2022-2032 ($MILLION)
    TABLE 43. ITALY BANKING WEARABLE MARKET, BY APPLICATION, 2022-2032 ($MILLION)
    TABLE 44. SPAIN BANKING WEARABLE MARKET, BY TYPE, 2022-2032 ($MILLION)
    TABLE 45. SPAIN BANKING WEARABLE MARKET, BY TECHNOLOGY, 2022-2032 ($MILLION)
    TABLE 46. SPAIN BANKING WEARABLE MARKET, BY APPLICATION, 2022-2032 ($MILLION)
    TABLE 47. REST OF EUROPE BANKING WEARABLE MARKET, BY TYPE, 2022-2032 ($MILLION)
    TABLE 48. REST OF EUROPE BANKING WEARABLE MARKET, BY TECHNOLOGY, 2022-2032 ($MILLION)
    TABLE 49. REST OF EUROPE BANKING WEARABLE MARKET, BY APPLICATION, 2022-2032 ($MILLION)
    TABLE 50. ASIA-PACIFIC BANKING WEARABLE MARKET, BY TYPE, 2022-2032 ($MILLION)
    TABLE 51. ASIA-PACIFIC BANKING WEARABLE MARKET, BY TECHNOLOGY, 2022-2032 ($MILLION)
    TABLE 52. ASIA-PACIFIC BANKING WEARABLE MARKET, BY APPLICATION, 2022-2032 ($MILLION)
    TABLE 53. ASIA-PACIFIC BANKING WEARABLE MARKET, BY COUNTRY, 2022-2032 ($MILLION)
    TABLE 54. CHINA BANKING WEARABLE MARKET, BY TYPE, 2022-2032 ($MILLION)
    TABLE 55. CHINA BANKING WEARABLE MARKET, BY TECHNOLOGY, 2022-2032 ($MILLION)
    TABLE 56. CHINA BANKING WEARABLE MARKET, BY APPLICATION, 2022-2032 ($MILLION)
    TABLE 57. JAPAN BANKING WEARABLE MARKET, BY TYPE, 2022-2032 ($MILLION)
    TABLE 58. JAPAN BANKING WEARABLE MARKET, BY TECHNOLOGY, 2022-2032 ($MILLION)
    TABLE 59. JAPAN BANKING WEARABLE MARKET, BY APPLICATION, 2022-2032 ($MILLION)
    TABLE 60. INDIA BANKING WEARABLE MARKET, BY TYPE, 2022-2032 ($MILLION)
    TABLE 61. INDIA BANKING WEARABLE MARKET, BY TECHNOLOGY, 2022-2032 ($MILLION)
    TABLE 62. INDIA BANKING WEARABLE MARKET, BY APPLICATION, 2022-2032 ($MILLION)
    TABLE 63. AUSTRALIA BANKING WEARABLE MARKET, BY TYPE, 2022-2032 ($MILLION)
    TABLE 64. AUSTRALIA BANKING WEARABLE MARKET, BY TECHNOLOGY, 2022-2032 ($MILLION)
    TABLE 65. AUSTRALIA BANKING WEARABLE MARKET, BY APPLICATION, 2022-2032 ($MILLION)
    TABLE 66. SOUTH KOREA BANKING WEARABLE MARKET, BY TYPE, 2022-2032 ($MILLION)
    TABLE 67. SOUTH KOREA BANKING WEARABLE MARKET, BY TECHNOLOGY, 2022-2032 ($MILLION)
    TABLE 68. SOUTH KOREA BANKING WEARABLE MARKET, BY APPLICATION, 2022-2032 ($MILLION)
    TABLE 69. REST OF ASIA-PACIFIC BANKING WEARABLE MARKET, BY TYPE, 2022-2032 ($MILLION)
    TABLE 70. REST OF ASIA-PACIFIC BANKING WEARABLE MARKET, BY TECHNOLOGY, 2022-2032 ($MILLION)
    TABLE 71. REST OF ASIA-PACIFIC BANKING WEARABLE MARKET, BY APPLICATION, 2022-2032 ($MILLION)
    TABLE 72. LAMEA BANKING WEARABLE MARKET, BY TYPE, 2022-2032 ($MILLION)
    TABLE 73. LAMEA BANKING WEARABLE MARKET, BY TECHNOLOGY, 2022-2032 ($MILLION)
    TABLE 74. LAMEA BANKING WEARABLE MARKET, BY APPLICATION, 2022-2032 ($MILLION)
    TABLE 75. LAMEA BANKING WEARABLE MARKET, BY COUNTRY, 2022-2032 ($MILLION)
    TABLE 76. LATIN AMERICA BANKING WEARABLE MARKET, BY TYPE, 2022-2032 ($MILLION)
    TABLE 77. LATIN AMERICA BANKING WEARABLE MARKET, BY TECHNOLOGY, 2022-2032 ($MILLION)
    TABLE 78. LATIN AMERICA BANKING WEARABLE MARKET, BY APPLICATION, 2022-2032 ($MILLION)
    TABLE 79. MIDDLE EAST BANKING WEARABLE MARKET, BY TYPE, 2022-2032 ($MILLION)
    TABLE 80. MIDDLE EAST BANKING WEARABLE MARKET, BY TECHNOLOGY, 2022-2032 ($MILLION)
    TABLE 81. MIDDLE EAST BANKING WEARABLE MARKET, BY APPLICATION, 2022-2032 ($MILLION)
    TABLE 82. AFRICA BANKING WEARABLE MARKET, BY TYPE, 2022-2032 ($MILLION)
    TABLE 83. AFRICA BANKING WEARABLE MARKET, BY TECHNOLOGY, 2022-2032 ($MILLION)
    TABLE 84. AFRICA BANKING WEARABLE MARKET, BY APPLICATION, 2022-2032 ($MILLION)
    TABLE 85. GOOGLE LLC: KEY EXECUTIVES
    TABLE 86. GOOGLE LLC: COMPANY SNAPSHOT
    TABLE 87. GOOGLE LLC: SERVICE SEGMENTS
    TABLE 88. GOOGLE LLC: PRODUCT PORTFOLIO
    TABLE 89. GOOGLE LLC: KEY STRATERGIES
    TABLE 90. THALES: KEY EXECUTIVES
    TABLE 91. THALES: COMPANY SNAPSHOT
    TABLE 92. THALES: PRODUCT SEGMENTS
    TABLE 93. THALES: PRODUCT PORTFOLIO
    TABLE 94. THALES: KEY STRATERGIES
    TABLE 95. APPLE INC.: KEY EXECUTIVES
    TABLE 96. APPLE INC.: COMPANY SNAPSHOT
    TABLE 97. APPLE INC.: PRODUCT SEGMENTS
    TABLE 98. APPLE INC.: PRODUCT PORTFOLIO
    TABLE 99. APPLE INC.: KEY STRATERGIES
    TABLE 100. FIDESMO: KEY EXECUTIVES
    TABLE 101. FIDESMO: COMPANY SNAPSHOT
    TABLE 102. FIDESMO: SERVICE SEGMENTS
    TABLE 103. FIDESMO: PRODUCT PORTFOLIO
    TABLE 104. FIDESMO: KEY STRATERGIES
    TABLE 105. SAMSUNG ELECTRONICS: KEY EXECUTIVES
    TABLE 106. SAMSUNG ELECTRONICS: COMPANY SNAPSHOT
    TABLE 107. SAMSUNG ELECTRONICS: PRODUCT SEGMENTS
    TABLE 108. SAMSUNG ELECTRONICS: PRODUCT PORTFOLIO
    TABLE 109. SAMSUNG ELECTRONICS: KEY STRATERGIES
    TABLE 110. XIAOMI CORPORATION: KEY EXECUTIVES
    TABLE 111. XIAOMI CORPORATION: COMPANY SNAPSHOT
    TABLE 112. XIAOMI CORPORATION: PRODUCT SEGMENTS
    TABLE 113. XIAOMI CORPORATION: PRODUCT PORTFOLIO
    TABLE 114. XIAOMI CORPORATION: KEY STRATERGIES
    TABLE 115. VISA INC.: KEY EXECUTIVES
    TABLE 116. VISA INC.: COMPANY SNAPSHOT
    TABLE 117. VISA INC.: SERVICE SEGMENTS
    TABLE 118. VISA INC.: PRODUCT PORTFOLIO
    TABLE 119. VISA INC.: KEY STRATERGIES
    TABLE 120. NYMI INC.: KEY EXECUTIVES
    TABLE 121. NYMI INC.: COMPANY SNAPSHOT
    TABLE 122. NYMI INC.: SERVICE SEGMENTS
    TABLE 123. NYMI INC.: PRODUCT PORTFOLIO
    TABLE 124. NYMI INC.: KEY STRATERGIES
    TABLE 125. WIRECARD: KEY EXECUTIVES
    TABLE 126. WIRECARD: COMPANY SNAPSHOT
    TABLE 127. WIRECARD: SERVICE SEGMENTS
    TABLE 128. WIRECARD: PRODUCT PORTFOLIO
    TABLE 129. GEMALTO NV: KEY EXECUTIVES
    TABLE 130. GEMALTO NV: COMPANY SNAPSHOT
    TABLE 131. GEMALTO NV: SERVICE SEGMENTS
    TABLE 132. GEMALTO NV: PRODUCT PORTFOLIO
  • LIST OF FIGURES

  • FIGURE 01. BANKING WEARABLE MARKET, 2022-2032
    FIGURE 02. SEGMENTATION OF BANKING WEARABLE MARKET, 2022-2032
    FIGURE 03. TOP INVESTMENT POCKETS IN BANKING WEARABLE MARKET (2023-2032)
    FIGURE 04. MODERATE-TO-HIGH BARGAINING POWER OF SUPPLIERS
    FIGURE 05. MODERATE-TO-HIGH THREAT OF NEW ENTRANTS
    FIGURE 06. LOW-TO-MODERATE THREAT OF SUBSTITUTES
    FIGURE 07. MODERATE-TO-HIGH INTENSITY OF RIVALRY
    FIGURE 08. LOW-TO-HIGH BARGAINING POWER OF BUYERS
    FIGURE 09. DRIVERS, RESTRAINTS AND OPPORTUNITIES: GLOBALBANKING WEARABLE MARKET
    FIGURE 09. BANKING WEARABLE MARKET, BY TYPE, 2022(%)
    FIGURE 10. COMPARATIVE SHARE ANALYSIS OF BANKING WEARABLE MARKET FOR FITNESS TRACKER, BY COUNTRY 2022 AND 2032(%)
    FIGURE 11. COMPARATIVE SHARE ANALYSIS OF BANKING WEARABLE MARKET FOR PAYMENT WRISTBANDS, BY COUNTRY 2022 AND 2032(%)
    FIGURE 12. COMPARATIVE SHARE ANALYSIS OF BANKING WEARABLE MARKET FOR SMART WATCHES, BY COUNTRY 2022 AND 2032(%)
    FIGURE 13. COMPARATIVE SHARE ANALYSIS OF BANKING WEARABLE MARKET FOR OTHERS, BY COUNTRY 2022 AND 2032(%)
    FIGURE 14. BANKING WEARABLE MARKET, BY TECHNOLOGY, 2022(%)
    FIGURE 15. COMPARATIVE SHARE ANALYSIS OF BANKING WEARABLE MARKET FOR NEAR FIELD COMMUNICATION (NFC), BY COUNTRY 2022 AND 2032(%)
    FIGURE 16. COMPARATIVE SHARE ANALYSIS OF BANKING WEARABLE MARKET FOR QUICK RESPONSE (QR) CODES, BY COUNTRY 2022 AND 2032(%)
    FIGURE 17. COMPARATIVE SHARE ANALYSIS OF BANKING WEARABLE MARKET FOR RADIO FREQUENCY IDENTIFICATION (RFID), BY COUNTRY 2022 AND 2032(%)
    FIGURE 18. COMPARATIVE SHARE ANALYSIS OF BANKING WEARABLE MARKET FOR OTHERS, BY COUNTRY 2022 AND 2032(%)
    FIGURE 19. BANKING WEARABLE MARKET, BY APPLICATION, 2022(%)
    FIGURE 20. COMPARATIVE SHARE ANALYSIS OF BANKING WEARABLE MARKET FOR RETAIL, BY COUNTRY 2022 AND 2032(%)
    FIGURE 21. COMPARATIVE SHARE ANALYSIS OF BANKING WEARABLE MARKET FOR ENTERTAINMENT CENTERS, BY COUNTRY 2022 AND 2032(%)
    FIGURE 22. COMPARATIVE SHARE ANALYSIS OF BANKING WEARABLE MARKET FOR RESTAURANTS AND BARS, BY COUNTRY 2022 AND 2032(%)
    FIGURE 23. COMPARATIVE SHARE ANALYSIS OF BANKING WEARABLE MARKET FOR HEALTHCARE, BY COUNTRY 2022 AND 2032(%)
    FIGURE 24. COMPARATIVE SHARE ANALYSIS OF BANKING WEARABLE MARKET FOR OTHERS, BY COUNTRY 2022 AND 2032(%)
    FIGURE 25. BANKING WEARABLE MARKET BY REGION, 2022
    FIGURE 26. U.S. BANKING WEARABLE MARKET, 2022-2032 ($MILLION)
    FIGURE 27. CANADA BANKING WEARABLE MARKET, 2022-2032 ($MILLION)
    FIGURE 28. UK BANKING WEARABLE MARKET, 2022-2032 ($MILLION)
    FIGURE 29. GERMANY BANKING WEARABLE MARKET, 2022-2032 ($MILLION)
    FIGURE 30. FRANCE BANKING WEARABLE MARKET, 2022-2032 ($MILLION)
    FIGURE 31. ITALY BANKING WEARABLE MARKET, 2022-2032 ($MILLION)
    FIGURE 32. SPAIN BANKING WEARABLE MARKET, 2022-2032 ($MILLION)
    FIGURE 33. REST OF EUROPE BANKING WEARABLE MARKET, 2022-2032 ($MILLION)
    FIGURE 34. CHINA BANKING WEARABLE MARKET, 2022-2032 ($MILLION)
    FIGURE 35. JAPAN BANKING WEARABLE MARKET, 2022-2032 ($MILLION)
    FIGURE 36. INDIA BANKING WEARABLE MARKET, 2022-2032 ($MILLION)
    FIGURE 37. AUSTRALIA BANKING WEARABLE MARKET, 2022-2032 ($MILLION)
    FIGURE 38. SOUTH KOREA BANKING WEARABLE MARKET, 2022-2032 ($MILLION)
    FIGURE 39. REST OF ASIA-PACIFIC BANKING WEARABLE MARKET, 2022-2032 ($MILLION)
    FIGURE 40. LATIN AMERICA BANKING WEARABLE MARKET, 2022-2032 ($MILLION)
    FIGURE 41. MIDDLE EAST BANKING WEARABLE MARKET, 2022-2032 ($MILLION)
    FIGURE 42. AFRICA BANKING WEARABLE MARKET, 2022-2032 ($MILLION)
    FIGURE 43. TOP WINNING STRATEGIES, BY YEAR
    FIGURE 44. TOP WINNING STRATEGIES, BY DEVELOPMENT
    FIGURE 45. TOP WINNING STRATEGIES, BY COMPANY
    FIGURE 46. PRODUCT MAPPING OF TOP 10 PLAYERS
    FIGURE 47. COMPETITIVE DASHBOARD
    FIGURE 48. COMPETITIVE HEATMAP: BANKING WEARABLE MARKET
    FIGURE 49. TOP PLAYER POSITIONING, 2022
    FIGURE 50. GOOGLE LLC: NET REVENUE, 2020-2022 ($MILLION)
    FIGURE 51. GOOGLE LLC: REVENUE SHARE BY SEGMENT, 2022 (%)
    FIGURE 52. GOOGLE LLC: REVENUE SHARE BY REGION, 2022 (%)
    FIGURE 53. THALES: NET REVENUE, 2020-2022 ($MILLION)
    FIGURE 54. THALES: REVENUE SHARE BY SEGMENT, 2022 (%)
    FIGURE 55. THALES: REVENUE SHARE BY REGION, 2022 (%)
    FIGURE 56. APPLE INC.: NET REVENUE, 2020-2022 ($MILLION)
    FIGURE 57. APPLE INC.: REVENUE SHARE BY SEGMENT, 2022 (%)
    FIGURE 58. APPLE INC.: REVENUE SHARE BY REGION, 2022 (%)
    FIGURE 59. SAMSUNG ELECTRONICS: NET SALES, 2020-2022 ($MILLION)
    FIGURE 60. SAMSUNG ELECTRONICS: REVENUE SHARE BY SEGMENT, 2022 (%)
    FIGURE 61. SAMSUNG ELECTRONICS: REVENUE SHARE BY REGION, 2022 (%)
    FIGURE 62. XIAOMI CORPORATION: NET SALES, 2020-2022 ($MILLION)
    FIGURE 63. XIAOMI CORPORATION: REVENUE SHARE BY SEGMENT, 2021 (%)
    FIGURE 64. XIAOMI CORPORATION: REVENUE SHARE BY REGION, 2021 (%)
    FIGURE 65. VISA INC.: NET REVENUE, 2020-2022 ($MILLION)
    FIGURE 66. VISA INC.: REVENUE SHARE BY SEGMENT, 2022 (%)
    FIGURE 67. VISA INC.: REVENUE SHARE BY REGION, 2022 (%)


PURCHASE OPTIONS

Call or Email us

U.S.-Canada Toll-free: +1-800-792-5285
Int'l : +1-503-894-6022
Europe : +44-845-528-1300
Email : help@alliedmarketresearch.com
 
FREQUENTLY ASKED QUESTIONS?

A. The banking wearable market is estimated to grow at a CAGR of 16.8% from 2023 to 2032.

A. The banking wearable market is projected to reach $62.70 billion by 2032.

A. Increase in demand for host card emulation (HCE), growth in adoption of cashless transaction and increase in demand for wearable payment devices majorly contribute toward the growth of the market.

A. The key players profiled in the report include banking wearable market analysis includes top companies operating in the market such as Google LLC, Apple Inc., Fidesmo, Xiaomi Corporation, Visa Inc., Wirecard, Thales, Nymi Inc., Gemalto NV, and Samsung Electronics.

A. The key growth strategies of banking wearable players include product portfolio expansion, mergers & acquisitions, agreements, geographical expansion, and collaborations.

Looking for Customization?

 Customization Request

Have a Question?

 Speak with Analyst

Any Confusion?

 Inquire Before Buying

Have a glance of the Report

  Request Sample
RELATED TAGS

Purchase Full Report of
Banking Wearable Market

Start reading instantly.
This Report and over 67,132+ more Reports, Available with Avenue Library. T&C*.

  • Online Only
  • $3,570
  • Online cloud access only
  • Restricted print, copy, paste & download
  • Read only
  • Free industry update
    (Within 180 days)
  • Free report update in next update cycle
    (Jul 2024 - Jul 2025)
  • Data Pack
  • $3,840
  • Restricted to one authorized user
  • One print only
  • Available in
    Excel
  • Free industry update
    (Within 180 days)
  •   Free report update in next update cycle
    (Jul 2024 - Jul 2025)
  • Single User
  • $5,730
  • Restricted to one authorized user
  • One print only
  • Available in
    PDF
  • Free industry update
    (Within 180 days)
  •   Free report update in next update cycle
    (Jul 2024 - Jul 2025)
  • Five Users
  • $6,450
  • Limited to five authorized users
  • Print upto five copies
  • Available in
    PDF
  • Free industry update
    (Within 180 days)
  •   Free report update in next update cycle
    (Jul 2024 - Jul 2025)
  • Enterprise
    License/PDF

  • $9,600
  • Unlimited
    within
    company/enterprise
  • Available in Excel & PDF
  • Free industry update
    (Within 180 days)
  •   Free report update in next update cycle
    (Jul 2024 - Jul 2025)
  • Library
    Membership

  • $999 $ 1,175
    Per User/ Per month/ Billed annually
  • Published Content
    E-access
  • Company Profiles
    E-access
  • Newly Added Content Access
  • 10 PDF
    Downloads
  • 5 Excel Data
    Pack Downloads
  • 250 Company Profiles PDF Downloads
  • Buy Now

*Taxes/Fees, if applicable will be added during checkout. All prices in USD

RELATED REPORTS
 

Why Allied Market Research?


Infallible Methodology

To ensure high-level data integrity, accurate analysis, and impeccable forecasts

Analyst Support

For complete satisfaction

Customization

On-demand customization of scope of the report to exactly meet your needs

TARGETED MARKET VIEW

Targeted market view to provide pertinent information and save time of readers

Get fresh content delivered

Get insights on topics that are crucial for your business. Stay abreast of your interest areas.

Get Industry Data Alerts

Why Allied Market Research?

Infallible Methodology

To ensure high-level data integrity, accurate analysis, and impeccable forecasts

Analyst Support

For complete satisfaction

Customization

On-demand customization of scope of the report to exactly meet your needs

TARGETED MARKET VIEW

Targeted market view to provide pertinent information and save time of readers