✷ Report Code: A01222 | Feb 2022 | Pages: 382 | ||
Tables: 230 | Charts: 85 |
|
Pandemic disrupted the entire world and affected many industries.
Get detailed COVID-19 impact analysis on the Base Oil Market
Request Now !
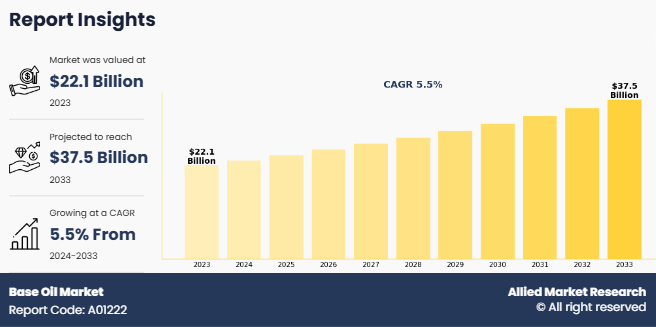
The global base oil market was valued at $34.9 billion in 2020, and is projected to reach $41.7 billion by 2030, growing at a CAGR of 1.8% from 2021 to 2030.
Statement for COVID-19 banner: The COVID-19 pandemic has negatively affected the base oil market due to a reduction in consumption and over-supply of refined petroleum products and declining economic development due to various lockdown measures implemented globally.
A refinery can produce base oil as one of its specialty products. Base oil is the refined petroleum mineral or synthetic material produced by a refinery to a required set of specifications, typically lubricant base stock. Base oils are made by extracting and processing high-viscosity material from vacuum gasoil or vacuum reside distillation cuttings. This necessitates unique processing through a range of lubes plant units. The quality of a lubricant can depend upon the type of base oil used for the refining and/or production method used to produce the base oil. It is critical toward the grade of lubricant as base oils normally make up to 70–97% of formulation of lubricants.
Demand for oils in the automotive industry, especially from developing countries, and stringent environmental legislation leading to strict performance standards drive the global base oil market growth. Furthermore, increase in demand for hydraulic oil in the automobile industry drives the growth of oil base market. However, fluctuating costs of crude oil and regulations concerning emission norms hamper the market growth. The global shift from group I base oils to group II & III present numerous growth opportunities to market players.
The base oil market is segmented on the basis of resin type, application, and region. Depending on type, the market is categorized into group I, II, III, IV, and V. According to application, it is classified into automotive oil, industrial oil, metalworking fluids, hydraulic oil, greases, and others. Region wise, it is analyzed across North America, Europe, Asia-Pacific, and LAMEA.
Comprehensive competitive analysis and profiles of major market players, such as Phillips 66 Company, Chevron Corporation, Exxon Mobil Corporation , Evonik Industries AG, Neste Oyj, PT Pertamina, S-OIL Corporation, Royal Dutch Shell Plc, AVISTA OIL AG, and Saudi Aramco are considered in the report.
The group I segment dominated the global base oil market in 2020, and is expected to maintain its dominance during the forecast period, as group I base oils are the cheapest base oils available in the market. The range of temperature for these base oils is from 30 to 150 degree Fahrenheit. In addition, these base oils are produced from a simple refining process, and thus are solvent-refined, which reduces the overall cost of these oils.
The automotive oil segment dominated the global base oil market in 2020, and is expected to maintain its dominance during the forecast period, owing to increase in demand for best quality base oils for automobiles across the globe.
Asia-Pacific accounted for the largest share of the base oil market in 2020, and is expected to grow at the highest CAGR, in terms of both volume and value, owing to the growing rate of motorization in the developing countries. This is driving the demand for lubricants, which, in turn, increases the demand for base oil.
Key Benefits For Stakeholders
Impact Of Covid-19 On The Global Base Oil Market
Base Oil Market Report Highlights
Aspects | Details |
---|---|
By Type |
|
By Application |
|
By Region |
|
By Key Market Players |
|
CHAPTER 1:INTRODUCTION
1.1.Report description
1.2.Key benefits for stakeholders
1.3.Key market segments
1.4.Research methodology
1.4.1.Primary research
1.4.2.Secondary research
1.5.Analyst tools and models
CHAPTER 2:EXECUTIVE SUMMARY
2.1.Key findings of the study
2.2.CXO perspective
CHAPTER 3:MARKET LANDSCAPE
3.1.Market definition and scope
3.2.Key findings
3.2.1.Top investment pockets
3.3.Porter's five forces analysis
3.5.Market share analysis & top player positioning, 2020
3.5.1.Top player positioning, 2020
3.6.Market dynamics
3.6.1.Drivers
3.6.1.1.Increase in demand for high-grade oils in the automotive industry
3.6.1.2.Stringent environmental legislations
3.6.2.Restraint
3.6.2.1.Fluctuating price of crude oil
3.6.3.Opportunities
3.6.3.1.Global shift from Group I base oils to Group II and III
3.7.Value chain
3.8.Impact of key regulations on the global Base Oil market
3.9.Impact of COVID-19 outburst on the Base Oil market
CHAPTER 4:BASE OIL MARKET, BY TYPE
4.1.Overview
4.1.1.Market size and forecast
4.2.GROUP I
4.2.1.Key market trends, growth factors, and opportunities
4.2.2.Market size and forecast, by region
4.2.3.Market analysis, by country
4.3.Group II
4.3.1.Key market trends, growth factors, and opportunities
4.3.2.Market size and forecast, by region
4.3.3.Market analysis, by country
4.4.Group III
4.4.1.Key market trends, growth factors, and opportunities
4.4.2.Market size and forecast, by region
4.4.3.Market analysis, by country
4.5.Group IV
4.5.1.Key market trends, growth factors, and opportunities
4.5.2.Market size and forecast, by region
4.5.3.Market analysis, by country
4.6.Group V
4.6.1.Key market trends, growth factors, and opportunities
4.6.2.Market size and forecast, by region
4.6.3.Market analysis, by country
CHAPTER 5:BASE OIL MARKET, BY APPLICATION
5.1.Overview
5.1.1.Market size and forecast
5.2.Industrial Oil
5.2.1.Key market trends, growth factors, and opportunities
5.2.2.Market size and forecast, by region
5.2.3.Market analysis, by country
5.3.Metalworking Fluids
5.3.1.Key market trends, growth factors, and opportunities
5.3.2.Market size and forecast, by region
5.3.3.Market analysis, by country
5.4.Hydraulic Oil
5.4.1.Key market trends, growth factors, and opportunities
5.4.2.Market size and forecast, by region
5.4.3.Market analysis, by country
5.5.Greases
5.5.1.Key market trends, growth factors, and opportunities
5.5.2.Market size and forecast, by region
5.5.3.Market analysis, by country
5.6.Industrial Oil
5.6.1.Key market trends, growth factors, and opportunities
5.6.2.Market size and forecast, by region
5.6.3.Market analysis, by country
5.7.Others
5.7.1.Key market trends, growth factors, and opportunities
5.7.2.Market size and forecast, by region
5.7.3.Market analysis, by country
CHAPTER 6:BASE OIL MARKET, BY REGION
6.1.Overview
6.1.1.Market size and forecast
6.2.North America
6.2.1.Key market trends, growth factors, and opportunities
6.2.2.Market size and forecast, by Type
6.2.3.Market size and forecast, by Application
6.2.4.Market share analysis, by country
6.2.4.1.U.S.
6.2.4.1.1.Market size and forecast, by Type
6.2.4.1.2.Market size and forecast, by Application
6.2.4.2.Canada
6.2.4.2.1.Market size and forecast, by Type
6.2.4.2.2.Market size and forecast, by Application
6.2.4.3.Mexico
6.2.4.3.1.Market size and forecast, by Type
6.2.4.3.2.Market size and forecast, by Application
6.3.Europe
6.3.1.Key market trends, growth factors, and opportunities
6.3.2.Market size and forecast, by Type
6.3.3.Market size and forecast, by Application
6.3.4.Market share analysis, by country
6.3.4.1.Germany
6.3.4.1.1.Market size and forecast, by Type
6.3.4.1.2.Market size and forecast, by Application
6.3.4.2.UK
6.3.4.2.1.Market size and forecast, by Type
6.3.4.2.2.Market size and forecast, by Application
6.3.4.3.France
6.3.4.3.1.Market size and forecast, by Type
6.3.4.3.2.Market size and forecast, by Application
6.3.4.4.Italy
6.3.4.4.1.Market size and forecast, by Type
6.3.4.4.2.Market size and forecast, by Application
6.3.4.5.Spain
6.3.4.5.1.Market size and forecast, by Type
6.3.4.5.2.Market size and forecast, by Application
6.3.4.6.Rest of Europe
6.3.4.6.1.Market size and forecast, by Type
6.3.4.6.2.Market size and forecast, by Application
6.4.Asia-Pacific
6.4.1.Key market trends, growth factors, and opportunities
6.4.2.Market size and forecast, by Type
6.4.3.Market size and forecast, by Application
6.4.4.Market share analysis, by country
6.4.4.1.China
6.4.4.1.1.Market size and forecast, by Type
6.4.4.1.2.Market size and forecast, by Application
6.4.4.2.Japan
6.4.4.2.1.Market size and forecast, by Type
6.4.4.2.2.Market size and forecast, by Application
6.4.4.3.India
6.4.4.3.1.Market size and forecast, by Type
6.4.4.3.2.Market size and forecast, by Application
6.4.4.4.South Korea
6.4.4.4.1.Market size and forecast, by Type
6.4.4.4.2.Market size and forecast, by Application
6.4.4.5.Australia
6.4.4.5.1.Market size and forecast, by Type
6.4.4.5.2.Market size and forecast, by Application
6.4.4.6.Rest of Asia-Pacific
6.4.4.6.1.Market size and forecast, by Type
6.4.4.6.2.Market size and forecast, by Application
6.5.LAMEA
6.5.1.Key market trends, growth factors, and opportunities
6.5.2.Market size and forecast, by Type
6.5.3.Market size and forecast, by Application
6.5.4.Market share analysis, by country
6.5.4.1.Brazil
6.5.4.1.1.Market size and forecast, by TYPE
6.5.4.1.2.Market size and forecast, by APPLICATION
6.5.4.2.Saudi Arabia
6.5.4.2.1.Market size and forecast, by TYPE
6.5.4.2.2.Market size and forecast, by APPLICATION
6.5.4.3.South Africa
6.5.4.3.1.Market size and forecast, by TYPE
6.5.4.3.2.Market size and forecast, by APPLICATION
6.5.4.4.Rest of LAMEA
6.5.4.4.1.Market size and forecast, by TYPE
6.5.4.4.2.Market size and forecast, by APPLICATION
CHAPTER 7:COMPETITIVE LANDSCAPE
7.1.Introduction
7.2.Product mapping of top 10 players
7.3.Competitive Heatmap
7.4.Key development
7.4.1.Business Expansion
7.4.2.New Product
7.4.3.Acquisition
CHAPTER 8:COMPANY PROFILES
8.1.Phillips 66 Company
8.1.1.Company overview
8.1.2.Company snapshot
8.1.3.Operating business segments
8.1.4.Product portfolio
8.1.5.Research and development
8.1.6.Business performance
8.1.7.Key strategic moves and developments
8.2.The Chevron Corporation
8.2.1.Company overview
8.2.2.Company snapshot
8.2.3.Operating business segments
8.2.4.Product portfolio
8.2.5.Business performance
8.2.6.Key strategic moves and developments
8.3.EXXON MOBIL CORPORATION
8.3.1.Company overview
8.3.2.Company snapshot
8.3.3.Operating business segments
8.3.4.Product portfolio
8.3.5.Research and development
8.3.6.Business performance
8.3.7.Key strategic moves and developments
8.4.Evonik Industries AG
8.4.1.Company overview
8.4.2.Company snapshot
8.4.3.Operating business segments
8.4.4.Product portfolio
8.4.5.Business performance
8.5.NESTE OYJ
8.5.1.Company overview
8.5.2.Company snapshot
8.5.3.Operating business segments
8.5.4.Product portfolio
8.5.5.Research and development
8.5.6.Business performance
8.5.7.Key strategic moves and developments
8.6.PT Pertamina Inc
8.6.1.Company overview
8.6.2.Company snapshot
8.6.3.Operating business segments
8.6.4.Product portfolio
8.6.5.Business performance
8.6.6.Key strategic moves and developments
8.7.Kansai Paint Co.Ltd.
8.7.1.Company overview
8.7.2.Company snapshot
8.7.3.Product portfolio
8.7.4.Business performance
8.7.5.Key strategic moves and developments
8.8.Royal Dutch Shell Plc
8.8.1.Company overview
8.8.2.Company snapshot
8.8.3.Operating business segments
8.8.4.Product portfolio
8.8.5.Business performance
8.9.AVISTA OIL AG
8.9.1.Company overview
8.9.2.Company snapshot
8.9.3.Operating business segments
8.9.4.Product portfolio
8.9.5.Research and development
8.9.6.Business performance
8.9.7.Key strategic moves and developments
8.10.Saudi Aramco
8.10.1.Company overview
8.10.2.Company snapshot
8.10.3.Product portfolio
LIST OF TABLES
TABLE 01.GLOBAL BASE OIL, BY TYPE, 2020–2030 (KILOTONS)
TABLE 02.GLOBAL BASE OIL MARKET, BY TYPE, 2020–2030($MILLION)
TABLE 03.GROUP I BASE OIL MARKET, BY REGION, 2020-2030 (KILOTONS)
TABLE 04.GROUP I BASE OIL MARKET, BY REGION, 2020-2030 ($MILLION)
TABLE 05.GROUP II BASE OIL MARKET, BY REGION, 2020-2030 (KILOTONS)
TABLE 06.GROUP II BASE OIL MARKET, BY REGION, 2020-2030 ($MILLION)
TABLE 07.GROUP III BASE OIL MARKET, BY REGION, 2020-2030 (KILOTONS)
TABLE 08.GROUP III BASE OIL MARKET, BY REGION, 2020-2030 ($MILLION)
TABLE 09.GROUP IV BASE OIL MARKET, BY REGION, 2020-2030 (KILOTONS)
TABLE 10.GROUP IV BASE OIL MARKET, BY REGION, 2020-2030 ($MILLION)
TABLE 11.GROUP V BASE OIL MARKET, BY REGION, 2020-2030 (KILOTONS)
TABLE 12.GROUP V BASE OIL MARKET, BY REGION, 2020-2030 ($MILLION)
TABLE 17.GLOBAL BASE OIL, BY TYPE, 2020–2030 (KILOTONS)
TABLE 18.GLOBAL BASE OIL MARKET, BY TYPE, 2020–2030($MILLION)
TABLE 19.INDUSTRIAL OIL BASE OIL MARKET, BY REGION, 2020-2030 (KILOTONS)
TABLE 20.INDUSTRIAL OIL BASE OIL MARKET, BY REGION, 2020-2030 ($MILLION)
TABLE 21.METALWORKING FLUIDS BASE OIL MARKET, BY REGION, 2020-2030 (KILOTONS)
TABLE 22.METALWORKING FLUIDS BASE OIL MARKET, BY REGION, 2020-2030 ($MILLION)
TABLE 23.HYDRAULIC OIL BASE OIL MARKET, BY REGION, 2020-2030 (KILOTONS)
TABLE 24.HYDRAULIC OIL BASE OIL MARKET, BY REGION, 2020-2030 ($MILLION)
TABLE 25.GREASES BASE OIL MARKET, BY REGION, 2020-2030 (KILOTONS)
TABLE 26.GREASES BASE OIL MARKET, BY REGION, 2020-2030 ($MILLION)
TABLE 27.OTHERS BASE OIL MARKET, BY REGION, 2020-2030 (KILOTONS)
TABLE 28.OTHERS BASE OIL MARKET, BY REGION, 2020-2030 ($MILLION)
TABLE 39.NORTH AMERICA BASE OIL MARKET, BY TYPE, 2020-2030 (KILOTONS)
TABLE 40.NORTH AMERICA BASE OIL MARKET, BY TYPE, 2020-2030 ($MILLION)
TABLE 41.NORTH AMERICA BASE OIL MARKET, BY APPLICATION, 2020-2030 (KILOTONS)
TABLE 42.NORTH AMERICA BASE OIL MARKET, BY APPLICATION, 2020-2030 ($MILLION)
TABLE 43.NORTH AMERICA BASE OIL MARKET, BY COUNTRY, 2020-2030 (KILOTONS)
TABLE 44.NORTH AMERICA BASE OIL MARKET, BY COUNTRY, 2020-2030 ($MILLION)
TABLE 45.U.S. BASE OIL MARKET, BY TYPE, 2020-2030 (KILOTONS)
TABLE 46.U.S. BASE OIL MARKET, BY TYPE, 2020-2030 ($MILLION)
TABLE 47.U.S. BASE OIL MARKET, BY APPLICATION, 2020-2030 (KILOTONS)
TABLE 48.U.S. BASE OIL MARKET, BY APPLICATION, 2020-2030 ($MILLION)
TABLE 49.CANADA BASE OIL MARKET, BY TYPE, 2020-2030 (KILOTONS)
TABLE 50.CANADA BASE OIL MARKET, BY TYPE, 2020-2030 ($MILLION)
TABLE 51.CANADA BASE OIL MARKET, BY APPLICATION, 2020-2030 (KILOTONS)
TABLE 52.CANADA BASE OIL MARKET, BY APPLICATION, 2020-2030 ($MILLION)
TABLE 53.MEXICO BASE OIL MARKET, BY TYPE, 2020-2030 (KILOTONS)
TABLE 54.MEXICO BASE OIL MARKET, BY TYPE, 2020-2030 ($MILLION)
TABLE 55.MEXICO BASE OIL MARKET, BY APPLICATION, 2020-2030 (KILOTONS)
TABLE 56.MEXICO BASE OIL MARKET, BY APPLICATION, 2020-2030 ($MILLION)
TABLE 57.EUROPE BASE OIL MARKET, BY TYPE, 2020-2030 (KILOTONS)
TABLE 58.EUROPE BASE OIL MARKET, BY TYPE, 2020-2030 ($MILLION)
TABLE 59.EUROPE BASE OIL MARKET, BY APPLICATION, 2020-2030 (KILOTONS)
TABLE 60.EUROPE BASE OIL MARKET, BY APPLICATION, 2020-2030 ($MILLION)
TABLE 61.EUROPE BASE OIL MARKET, BY COUNTRY, 2020-2030 (KILOTONS)
TABLE 62.EUROPE BASE OIL MARKET, BY COUNTRY, 2020-2030 ($MILLION)
TABLE 63.GERMANY BASE OIL MARKET, BY TYPE, 2020-2030 (KILOTONS)
TABLE 64.GERMANY BASE OIL MARKET, BY TYPE, 2020-2030 ($MILLION)
TABLE 65.GERMANY BASE OIL MARKET, BY APPLICATION, 2020-2030 (KILOTONS)
TABLE 66.GERMANY BASE OIL MARKET, BY APPLICATION, 2020-2030 ($MILLION)
TABLE 67.UK BASE OIL MARKET, BY TYPE, 2020-2030 (KILOTONS)
TABLE 68.UK BASE OIL MARKET, BY TYPE, 2020-2030 ($MILLION)
TABLE 69.UK BASE OIL MARKET, BY APPLICATION, 2020-2030 (KILOTONS)
TABLE 70.UK BASE OIL MARKET, BY APPLICATION, 2020-2030 ($MILLION)
TABLE 71.FRANCE BASE OIL MARKET, BY TYPE, 2020-2030 (KILOTONS)
TABLE 72.FRANCE BASE OIL MARKET, BY TYPE, 2020-2030 ($MILLION)
TABLE 73.FRANCE BASE OIL MARKET, BY APPLICATION, 2020-2030 (KILOTONS
TABLE 74.FRANCE BASE OIL MARKET, BY APPLICATION, 2020-2030 ($MILLION)
TABLE 75.ITALY BASE OIL MARKET, BY TYPE, 2020-2030 (KILOTONS)
TABLE 76.ITALY BASE OIL MARKET, BY TYPE, 2020-2030 ($MILLION)
TABLE 77.ITALY BASE OIL MARKET, BY APPLICATION, 2020-2030 (KILOTONS)
TABLE 78.ITALY BASE OIL MARKET, BY APPLICATION, 2020-2030 ($MILLION)
TABLE 79.SPAIN BASE OIL MARKET, BY TYPE, 2020-2030 (KILOTONS)
TABLE 80.SPAIN BASE OIL MARKET, BY TYPE ($MILLION)
TABLE 81.SPAIN BASE OIL MARKET, BY APPLICATION, 2020-2030 (KILOTONS)
TABLE 82.SPAIN BASE OIL MARKET, BY APPLICATION, 2020-2030 ($MILLION)
TABLE 83.REST OF EUROPE BASE OIL MARKET, BY TYPE, 2020-2030 (KILOTONS)
TABLE 84.REST OF EUROPE BASE OIL MARKET, BY TYPE, 2020-2030 ($MILLION)
TABLE 85.REST OF EUROPE BASE OIL MARKET, BY APPLICATION, 2020-2030 (KILOTONS)
TABLE 86.REST OF EUROPE BASE OIL MARKET, BY APPLICATION, 2020-2030 ($MILLION)
TABLE 87.ASIA-PACIFIC BASE OIL MARKET, BY TYPE, 2020-2030 (KILOTONS)
TABLE 88.ASIA-PACIFIC BASE OIL MARKET, BY TYPE, 2020-2030 ($MILLION)
TABLE 89.ASIA-PACIFIC BASE OIL MARKET, BY APPLICATION, 2020-2030 (KILOTONS)
TABLE 90.ASIA-PACIFIC BASE OIL MARKET, BY APPLICATION, 2020-2030 ($MILLION)
TABLE 91.ASIA-PACIFIC BASE OIL MARKET, BY COUNTRY, 2020-2030 (KILOTONS)
TABLE 92.ASIA-PACIFIC BASE OIL MARKET, BY COUNTRY, 2020-2030 ($MILLION)
TABLE 93.CHINA BASE OIL MARKET, BY TYPE, 2020-2030 (KILOTONS)
TABLE 94.CHINA BASE OIL MARKET, BY TYPE, 2020-2030 ($MILLION)
TABLE 95.CHINA BASE OIL MARKET, BY APPLICATION, 2020-2030 (KILOTONS)
TABLE 96.CHINA BASE OIL MARKET, BY APPLICATION, 2020-2030 ($MILLION)
TABLE 97.JAPAN BASE OIL MARKET, BY TYPE, 2020-2030 (KILOTONS)
TABLE 98.JAPAN BASE OIL MARKET, BY TYPE, 2020-2030 ($MILLION)
TABLE 99.JAPAN BASE OIL MARKET, BY APPLICATION, 2020-2030 (KILOTONS)
TABLE 100.JAPAN BASE OIL MARKET, BY APPLICATION, 2020-2030 ($MILLION)
TABLE 101.INDIA BASE OIL MARKET, BY TYPE, 2020-2030 (KILOTONS)
TABLE 102.INDIA BASE OIL MARKET, BY TYPE, 2020-2030 ($MILLION)
TABLE 103.INDIA BASE OIL MARKET, BY APPLICATION, 2020-2030 (KILOTONS)
TABLE 104.INDIA BASE OIL MARKET, BY APPLICATION, 2020-2030 ($MILLION)
TABLE 105.SOUTH KOREA BASE OIL MARKET, BY TYPE, 2020-2030 (KILOTONS)
TABLE 106.SOUTH KOREA BASE OIL MARKET, BY TYPE, 2020-2030 ($MILLION)
TABLE 107.SOUTH KOREA BASE OIL MARKET, BY APPLICATION, 2020-2030 (KILOTONS)
TABLE 108.SOUTH KOREA BASE OIL MARKET, BY APPLICATION, 2020-2030 ($MILLION)
TABLE 109.AUSTRALIA BASE OIL MARKET, BY TYPE, 2020-2030 (KILOTONS)
TABLE 110.AUSTRALIA BASE OIL MARKET, BY TYPE, 2020-2030 ($MILLION)
TABLE 111.AUSTRALIA BASE OIL MARKET, BY APPLICATION, 2020-2030 (KILOTONS)
TABLE 112.AUSTRALIA BASE OIL MARKET, BY APPLICATION, 2020-2030 ($MILLION)
TABLE 113.REST OF ASIA-PACIFIC BASE OIL MARKET, BY TYPE, 2020-2030 (KILOTONS)
TABLE 114.REST OF ASIA-PACIFIC BASE OIL MARKET, BY TYPE, 2020-2030 ($MILLION)
TABLE 115.REST OF ASIA-PACIFIC BASE OIL MARKET, BY APPLICATION, 2020-2030 (KILOTONS)
TABLE 116.REST OF ASIA-PACIFIC BASE OIL MARKET, BY APPLICATION, 2020-2030 ($MILLION)
TABLE 117.LAMEA BASE OIL MARKET, BY TYPE, 2020-2030 (KILOTONS)
TABLE 118.LAMEA BASE OIL MARKET, BY TYPE, 2020-2030 ($MILLION)
TABLE 119.LAMEA BASE OIL MARKET, BY APPLICATION, 2020-2030 (KILOTONS)
TABLE 120.LAMEA BASE OIL MARKET, BY APPLICATION, 2020-2030 ($MILLION)
TABLE 121.LAMEA BASE OIL MARKET, BY COUNTRY, 2020-2030 (KILOTONS)
TABLE 122.LAMEA BASE OIL MARKET, BY COUNTRY, 2020-2030 ($MILLION)
TABLE 123.BRAZIL BASE OIL MARKET, BY TYPE, 2020-2030 (KILOTONS)
TABLE 124.BRAZIL BASE OIL MARKET, BY TYPE, 2020-2030 ($MILLION)
TABLE 125.BRAZIL BASE OIL MARKET, BY APPLICATION, 2020-2030 (KILOTONS)
TABLE 126.BRAZIL BASE OIL MARKET, BY APPLICATION, 2020-2030 ($MILLION)
TABLE 127.SAUDI ARABIA BASE OIL MARKET, BY TYPE, 2020-2030 (KILOTONS)
TABLE 128.SAUDI ARABIA BASE OIL MARKET, BY TYPE, 2020-2030 ($MILLION)
TABLE 129.SAUDI ARABIA BASE OIL MARKET, BY APPLICATION, 2020-2030 (KILOTONS)
TABLE 130.SAUDI ARABIA BASE OIL MARKET, BY APPLICATION, 2020-2030 ($MILLION)
TABLE 131.SOUTH AFRICA BASE OIL MARKET, BY TYPE, 2020-2030 (KILOTONS)
TABLE 132.SOUTH AFRICA BASE OIL MARKET, BY TYPE, 2020-2030 ($MILLION)
TABLE 133.SOUTH AFRICA BASE OIL MARKET, BY APPLICATION, 2020-2030 (KILOTONS)
TABLE 134.SOUTH AFRICA BASE OIL MARKET, BY APPLICATION, 2020-2030 ($MILLION)
TABLE 135.REST OF LAMEA BASE OIL MARKET, BY TYPE, 2020-2030 (KILOTONS)
TABLE 136.REST OF LAMEA BASE OIL MARKET, BY TYPE, 2020-2030 ($MILLION)
TABLE 137.REST OF LAMEA BASE OIL MARKET, BY APPLICATION, 2020-2030 (KILOTONS)
TABLE 138.REST OF LAMEA BASE OIL MARKET, BY APPLICATION, 2020-2030 ($MILLION)
TABLE 139.KEY BUSINESS EXPANSION
TABLE 140.KEY NEW PRODUCT
TABLE 141.KEY ACQUISITION
TABLE 142.PHILLIPS 66 COMPANY: COMPANY SNAPSHOT
TABLE 143.PHILLIPS 66 COMPANY: OPERATING SEGMENT
TABLE 144.PHILLIPS 66 COMPANY PRODUCT PORTFOLIO
TABLE 145.PHILLIPS 66 COMPANY: R&D EXPENDITURE, 2018–2020 ($MILLION)
TABLE 146.PHILLIPS 66 COMPANY: NET SALES, 2018–2020 ($MILLION)
TABLE 147.PHILLIPS 66 COMPANY.: KEY STRATEGIC MOVES AND DEVELOPMENTS
TABLE 148.CHEVRON CORPORATION: COMPANY SNAPSHOT
TABLE 149.CHEVRON CORPORATION: OPERATING SEGMENT
TABLE 150.CHEVRON CORPORATION PRODUCT PORTFOLIO
TABLE 151.CHEVRON CORPORATION: NET SALES, 2018–2020 ($MILLION)
TABLE 152.CHEVRON CORPORATION.: KEY STRATEGIC MOVES AND DEVELOPMENTS
TABLE 153.EXXON MOBIL CORPORATION: COMPANY SNAPSHOT
TABLE 154.EXXON MOBIL CORPORATION: OPERATING SEGMENT
TABLE 155.EXXON MOBIL CORPORATION PRODUCT PORTFOLIO
TABLE 156.EXXON MOBIL CORPORATION: R&D EXPENDITURE, 2018–2020 ($MILLION)
TABLE 157.EXXON MOBIL CORPORATION: NET SALES, 2018–2020 ($MILLION)
TABLE 158.EXXON MOBIL CORPORATION.: KEY STRATEGIC MOVES AND DEVELOPMENTS
TABLE 159.EVONIK INDUSTRIES AG: COMPANY SNAPSHOT
TABLE 160.EVONIK INDUSTRIES AG: OPERATING SEGMENTS
TABLE 161.EVONIK INDUSTRIES AG: NET SALES, 2018–2020 ($MILLION)
TABLE 162.NESTE OYJ: COMPANY SNAPSHOT
TABLE 163.NESTE OYJ: OPERATING SEGMENT
TABLE 164.NESTE OYJ PRODUCT PORTFOLIO
TABLE 165.NESTE OYJ: R&D EXPENDITURE, 2018–2020 ($MILLION)
TABLE 166.NESTE OYJ: NET SALES, 2018–2020 ($MILLION)
TABLE 167.NESTE OYJ.: KEY STRATEGIC MOVES AND DEVELOPMENTS
TABLE 168.PT PERTAMINA: COMPANY SNAPSHOT
TABLE 169.PT PERTAMINA F: OPERATING SEGMENT
TABLE 170.PT PERTAMINA PRODUCT PORTFOLIO
TABLE 171.PT PERTAMINA: NET SALES, 2018–2020 ($MILLION)
TABLE 172.PT PERTAMINA.: KEY STRATEGIC MOVES AND DEVELOPMENTS
TABLE 173.S-OIL CORPORATION: COMPANY SNAPSHOT
TABLE 174.S-OIL CORPORATION PRODUCT PORTFOLIO
TABLE 175.S-OIL CORPORATION: NET SALES, 2018–2020 ($MILLION)
TABLE 176.S-OIL CORPORATION.: KEY STRATEGIC MOVES AND DEVELOPMENTS
TABLE 177.ROYAL DUTCH SHELL PLC: COMPANY SNAPSHOT
TABLE 178.ROYAL DUTCH SHELL PLC: OPERATING SEGMENT
TABLE 179.ROYAL DUTCH SHELL PLC PRODUCT PORTFOLIO
TABLE 180.ROYAL DUTCH SHELL PLC: NET SALES, 2018–2020 ($MILLION)
TABLE 181.AVISTA OIL AG: COMPANY SNAPSHOT
TABLE 182.AVISTA OIL AG: OPERATING SEGMENT
TABLE 183.AVISTA OIL AG PRODUCT PORTFOLIO
TABLE 184.AVISTA OIL AG: R&D EXPENDITURE, 2018–2020 ($MILLION)
TABLE 185.AVISTA OIL AG: NET SALES, 2018–2020 ($MILLION)
TABLE 186.AVISTA OIL AG.: KEY STRATEGIC MOVES AND DEVELOPMENTS
TABLE 187.SAUDI ARAMCO: COMPANY SNAPSHOT
TABLE 188.SAUDI ARAMCO: PRODUCT PORTFOLIO
LIST OF FIGURES
FIGURE 01.KEY MARKET SEGMENTS
FIGURE 02.EXECUTIVE SUMMARY, BY SEGMENT
FIGURE 03.EXECUTIVE SUMMARY, BY COUNTRY
FIGURE 04.TOP INVESTMENT POCKETS, BY COUNTRY
FIGURE 05.HIGH BARGAINING POWER OF SUPPLIERS
FIGURE 06.MODERATE THREAT OF NEW ENTRANTS
FIGURE 07.MODERATE THREAT OF SUBSTITUTES
FIGURE 08.MODERATE INTENSITY OF RIVALRY
FIGURE 09.HIGH BARGAINING POWER OF BUYERS
FIGURE 10.TOP PLAYER POSITIONING, 2020
FIGURE 11.BASE OIL DYNAMICS
FIGURE 12.BASE OIL MARKET: VALUE CHAIN
FIGURE 13.GLOBAL BASE OIL MARKET, BY TYPE, 2020–2030 ($MILLION)
FIGURE 14.COMPARATIVE SHARE ANALYSIS OF GROUP I BASE OIL MARKET, BY COUNTRY, 2020 & 2030 ($MILLION)
FIGURE 15.COMPARATIVE SHARE ANALYSIS OF GROUP II BASE OIL MARKET, BY COUNTRY, 2020 & 2030 ($MILLION)
FIGURE 16.COMPARATIVE SHARE ANALYSIS OF GROUP III BASE OIL MARKET, BY COUNTRY, 2020 & 2030 ($MILLION)
FIGURE 17.COMPARATIVE SHARE ANALYSIS OF GROUP IV BASE OIL MARKET, BY COUNTRY, 2020 & 2030 ($MILLION)
FIGURE 18.COMPARATIVE SHARE ANALYSIS OF GROUP V BASE OIL MARKET, BY COUNTRY, 2020 & 2030 ($MILLION)
FIGURE 19.COMPARATIVE SHARE ANALYSIS OF URETHANE BASE OIL MARKET, BY COUNTRY, 2020 & 2030 ($MILLION)
FIGURE 20.COMPARATIVE SHARE ANALYSIS OF OTHERS BASE OIL MARKET, BY COUNTRY, 2020 & 2030 ($MILLION)
FIGURE 21.GLOBAL BASE OIL MARKET, BY APPLICATION, 2020–2030 ($MILLION)
FIGURE 22.COMPARATIVE SHARE ANALYSIS OF INDUSTRIAL OIL BASE OIL MARKET, BY COUNTRY, 2020 & 2030 ($MILLION)
FIGURE 23.COMPARATIVE SHARE ANALYSIS OF METALWORKING FLUIDS BASE OIL MARKET, BY COUNTRY, 2020 & 2030 ($MILLION)
FIGURE 24.COMPARATIVE SHARE ANALYSIS OF HYDRAULIC OIL BASE OIL MARKET, BY COUNTRY, 2020 & 2030 ($MILLION)
FIGURE 25.COMPARATIVE SHARE ANALYSIS OF GREASES BASE OIL MARKET, BY COUNTRY, 2020 & 2030 ($MILLION)
FIGURE 26.COMPARATIVE SHARE ANALYSIS OF OTHERS BASE OIL MARKET, BY COUNTRY, 2020 & 2030 ($MILLION)
FIGURE 27.COMPARATIVE SHARE ANALYSIS OF PRIMERS BASE OIL MARKET, BY COUNTRY, 2020 & 2030 ($MILLION)
FIGURE 28.COMPARATIVE SHARE ANALYSIS OF SEALERS BASE OIL MARKET, BY COUNTRY, 2020 & 2030 ($MILLION)
FIGURE 29.COMPARATIVE SHARE ANALYSIS OF STAINS BASE OIL MARKET, BY COUNTRY, 2020 & 2030 ($MILLION)
FIGURE 30.COMPARATIVE SHARE ANALYSIS OF VARNISHES BASE OIL MARKET, BY COUNTRY, 2020 & 2030 ($MILLION)
FIGURE 31.BASE OIL MARKET, BY TECHNOLOGY, 2020–2030 ($MILLION)
FIGURE 32.COMPARATIVE ANALYSIS OF BASE OIL MARKET, FOR SOLVENT BORNE, BY COUNTRY, 2020 & 2030 ($MILLION)
FIGURE 33.COMPARATIVE ANALYSIS OF BASE OIL MARKET, FOR WATER BORNE, BY COUNTRY, 2020 & 2030 ($MILLION)
FIGURE 34.BASE OIL MARKET, BY END-USE, 2020–2030 ($MILLION)
FIGURE 35.COMPARATIVE ANALYSIS OF BASE OIL MARKET, FOR RESIDENTIAL, BY COUNTRY, 2020 & 2030 ($MILLION)
FIGURE 36.COMPARATIVE ANALYSIS OF BASE OIL MARKET, FOR NON-RESIDENTIAL, BY COUNTRY, 2020 & 2030 ($MILLION)
FIGURE 37.U.S. BASE OIL MARKET REVENUE, 2020-2030 ($MILLION)
FIGURE 38.CANADA BASE OIL MARKET REVENUE, 2020-2030 ($MILLION)
FIGURE 39.MEXICO BASE OIL MARKET REVENUE, 2020-2030 ($MILLION)
FIGURE 40.GERMANY BASE OIL MARKET REVENUE, 2020-2030 ($MILLION)
FIGURE 41.UK BASE OIL MARKET REVENUE, 2020-2030 ($MILLION)
FIGURE 42.FRANCE BASE OIL MARKET REVENUE, 2020-2030 ($MILLION)
FIGURE 43.ITALY BASE OIL MARKET REVENUE, 2020-2030 ($MILLION)
FIGURE 44.SPAIN BASE OIL MARKET REVENUE, 2020-2030 ($MILLION)
FIGURE 45.REST OF EUROPE BASE OIL MARKET REVENUE, 2020-2030 ($MILLION)
FIGURE 46.CHINA BASE OIL MARKET REVENUE, 2020-2030 ($MILLION)
FIGURE 47.JAPAN BASE OIL MARKET REVENUE, 2020-2030 ($MILLION)
FIGURE 48.INDIA BASE OIL MARKET REVENUE, 2020-2030 ($MILLION)
FIGURE 49.SOUTH KOREA BASE OIL MARKET REVENUE, 2020-2030 ($MILLION)
FIGURE 50.AUSTRALIA BASE OIL MARKET REVENUE, 2020-2030 ($MILLION)
FIGURE 51.REST OF ASIA-PACIFIC BASE OIL MARKET REVENUE, 2020-2030 ($MILLION)
FIGURE 52.BRAZIL BASE OIL MARKET REVENUE, 2020-2030 ($MILLION)
FIGURE 53.SAUDI ARABIA BASE OIL MARKET REVENUE, 2020-2030 ($MILLION)
FIGURE 54.SOUTH AFRICA BASE OIL MARKET REVENUE, 2020-2030 ($MILLION)
FIGURE 55.REST OF LAMEA BASE OIL MARKET REVENUE, 2020-2030 ($MILLION)
FIGURE 56.PRODUCT MAPPING OF TOP 10 PLAYERS SOURCE: COMPANY WEBSITE,
FIGURE 57.COMPETITIVE HEATMAP
FIGURE 58.PHILLIPS 66 COMPANY R&D, 2018–2020 ($MILLION)
FIGURE 59.PHILLIPS 66 COMPANY: NET SALES, 2018–2020 ($MILLION)
FIGURE 60.PHILLIPS 66 COMPANY: REVENUE SHARE BY SEGMENT, 2020 (%)
FIGURE 61.PHILLIPS 66 COMPANY: REVENUE SHARE BY REGION, 2020 (%)
FIGURE 62.CHEVRON CORPORATION: NET SALES, 2018–2020 ($MILLION)
FIGURE 63.CHEVRON CORPORATION: REVENUE SHARE BY SEGMENT, 2020 (%)
FIGURE 64.EXXON MOBIL CORPORATION R&D, 2018–2020 ($MILLION)
FIGURE 65.EXXON MOBIL CORPORATION: NET SALES, 2018–2020 ($MILLION)
FIGURE 66.EXXON MOBIL CORPORATION: REVENUE SHARE BY SEGMENT, 2020 (%)
FIGURE 67.EXXON MOBIL CORPORATION: REVENUE SHARE BY REGION, 2020 (%)
FIGURE 68.EVONIK INDUSTRIES AG: NET SALES, 2018–2020 ($MILLION)
FIGURE 69.EVONIK INDUSTRIES AG: REVENUE SHARE BY SEGMENT, 2020 (%)
FIGURE 70.NESTE OYJ R&D, 2018–2020 ($MILLION)
FIGURE 71.NESTE OYJ: NET SALES, 2018–2020 ($MILLION)
FIGURE 72.NESTE OYJ: REVENUE SHARE BY SEGMENT, 2020 (%)
FIGURE 73.NESTE OYJ: REVENUE SHARE BY REGION, 2020 (%)
FIGURE 74.PT PERTAMINA: NET SALES, 2018–2020 ($MILLION)
FIGURE 75.PT PERTAMINA: REVENUE SHARE BY SEGMENT, 2020 (%)
FIGURE 76.PT PERTAMINA: REVENUE SHARE BY REGION, 2020 (%)
FIGURE 77.S-OIL CORPORATION: NET SALES, 2018–2020 ($MILLION)
FIGURE 78.S-OIL CORPORATION: REVENUE SHARE BY REGION, 2020 (%)
FIGURE 79.ROYAL DUTCH SHELL PLC: NET SALES, 2018–2020 ($MILLION)
FIGURE 80.ROYAL DUTCH SHELL PLC: REVENUE SHARE BY SEGMENT, 2020 (%)
FIGURE 81.ROYAL DUTCH SHELL PLC: REVENUE SHARE BY REGION, 2020 (%)
FIGURE 82.AVISTA OIL AG R&D, 2018–2020 ($MILLION)
FIGURE 83.AVISTA OIL AG: NET SALES, 2018–2020 ($MILLION)
FIGURE 84.AVISTA OIL AG: REVENUE SHARE BY SEGMENT, 2020 (%)
FIGURE 85.AVISTA OIL AG: REVENUE SHARE BY REGION, 2020 (%)
Changing lubricant grades necessitate the constant substitution of group I base oils by group II-and III-based products, leading to plant terminations across the globe. Low crude oil cost is expected to aid the industry for group I manufacturers and support for the base oil industry. Base oils in group I contain less than 90% saturates, greater than 0.03% sulfur, and Society of Automotive Engineers (SAE) viscosity index of 80 to 120. Operating temperature range is 32-150°F. These oils are solvent-refined, which is a less time-consuming refining technique, making them the most affordable base oils.
The global economy profits from reduction in oil costs because of high financial multiplier in emerging oil-importing economies. Therefore, base oil utilization in the automotive sector is expected to grow through both increase in purchasing power (new and second-hand automotive deals) and surge in vehicle usage. This growth is expected to be particularly noticeable in developing countries and control the decline in group I base oil demand. However, in 2020, COVID-19 had a negative impact on the market. Declining automotive industry and temporary shutdown of automotive manufacturing and industrial units as a result of the pandemic scenario, resulted in lower consumption of engine oil, gear oils, greases, and metalworking fluid, reducing the demand for base oil.
Asia-Pacific is expected to have a significant global market share by 2030, owing to enhanced demand from automotive sector and surge in industrial growth. Increase in inclination toward higher grade lubricants and base stocks expands Asia-Pacific’s market share, owing to lower costs of base oils.
The drivers, restraints, and opportunities are explained in the report to better understand the market dynamics. This report further highlights the key areas of investment. In addition, it includes Porter’s five forces analysis to understand the competitive scenario of the industry and role of each stakeholder. The report features the strategies adopted by key market players to strengthen their foothold in the market. Furthermore, it highlights the competitive landscape of the key players to increase their market share and sustain intense competition in the industry.
A. High industrial growth and increase in demand for high-grade oils in automotive industry are expected to boost the base oil market growth.
A. The market value of global base oil market in 2021 is expected to be $ 35.4 billion and projected to rise to $ 41.7 billion in 2030.
A. The leading players in the market Phillips 66 Company, Chevron Corporation, Exxon Mobil Corporation , Evonik Industries AG, Neste Oyj, PT Pertamina, S-OIL Corporation, Royal Dutch Shell Plc, AVISTA OIL AG, and Saudi Aramco
A. The automotive industry is projected to increase the demand for base oil market
A. The global base oil market is segmented on the basis of derivative type, application, and region.
A. Increase in demand for high-grade oils in the automotive industry is the main driver of base oil Market
A. Due to COVID-19 pandemic, transport limitations were implemented, resulting in reduced industrial production and disrupted supply chains, which affected global economic growth by a substantial proportion, severely impacting market growth.
Start reading instantly.
This Report and over 67,404+ more Reports, Available with Avenue Library. T&C*.
Enterprise
License/PDF
Library
Membership
*Taxes/Fees, if applicable will be added during checkout. All prices in USD
To ensure high-level data integrity, accurate analysis, and impeccable forecasts
For complete satisfaction
On-demand customization of scope of the report to exactly meet your needs
Targeted market view to provide pertinent information and save time of readers
Get insights on topics that are crucial for your business. Stay abreast of your interest areas.
Get Industry Data AlertsTo ensure high-level data integrity, accurate analysis, and impeccable forecasts
For complete satisfaction
On-demand customization of scope of the report to exactly meet your needs
Targeted market view to provide pertinent information and save time of readers