
BB Cream Market Overview, 2033
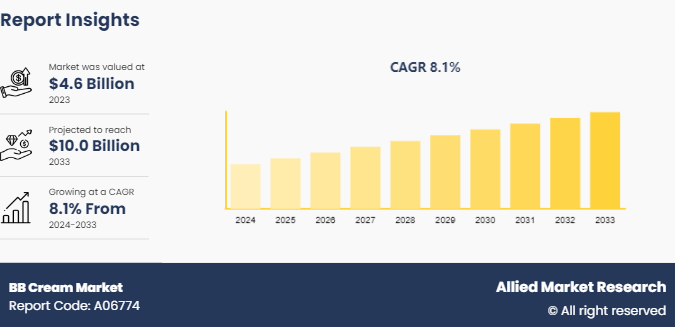
The global BB cream market size was valued at $4.6 billion in 2023, and is projected to reach $10.0 billion by 2033, growing at a CAGR of 8.1% from 2024 to 2033. BB cream, short for "blemish balm" or "beauty balm, " is a multifunctional cosmetic product that combines skincare and makeup benefits. Originally developed to provide coverage and promote healing for patients recovering from laser skin treatments.
BB creams have evolved into popular beauty staples. They offer a range of benefits, including moisturization to keep the skin hydrated, sun protection to shield against UV radiation, and light to medium coverage to even out skin tone & conceal imperfections. In addition, many BB creams contain skincare ingredients such as antioxidants and vitamins, providing anti-aging, brightening, or soothing effects. With their convenient all-in-one formula, lightweight texture, and versatility for various skin types, BB creams simplify beauty routines while promoting a natural, healthy-looking complexion.
Key Takeaways
The BB cream market study covers 20 countries. The research includes a segment analysis of each country in terms of value ($Billion) for the forecast period 2024-2035.
More than 1, 500 product literatures, industry releases, annual reports, and other such documents of major paper cup industry participants along with authentic industry journals, trade associations' releases, and government websites have been reviewed for generating high-value industry insights.
- The study integrated high-quality data, professional opinions and analysis, and critical independent perspectives. The research approach is intended to provide a balanced view of global markets and assist stakeholders in making educated decisions to achieve their most ambitious growth objectives.
Key Market Dynamics
The increase in demand for multi-functional cosmetics is a primary driver propelling the growth of the BB cream market. Consumers today prioritize convenience and efficiency in their skincare and makeup routines, seeking products that offer multiple benefits in one. BB creams, with their ability to moisturize, provide sun protection, offer coverage, and sometimes even include anti-aging properties. As individuals strive for simplicity and effectiveness in their beauty regimens, the all-in-one nature of BB creams appeals to a broad demographic, driving their popularity and contributing to the expansion of the BB Cream industry.
The rise in awareness of skincare benefits propels the BB cream market growth consumers increasingly seek products that offer both cosmetic coverage and skincare advantages. With the rise in emphasis on understanding ingredients and their effects on skin health, consumers are drawn to BB creams containing moisturizing agents, SPF protection, antioxidants, and other skincare-enhancing components. This heightened awareness aligns with the shift toward holistic beauty routines, where individuals prioritize products that conceal imperfections and nourish & protect the skin. Consequently, the demand for BB creams continues to surge as they cater to the evolving preferences of skincare-conscious consumers worldwide. The rising awareness regarding skincare is expected to create BB cream market opportunities.
- The expanding beauty and personal care market in the Asia-Pacific region serves as a significant driver for the growth of the BB cream market globally. Countries such as South Korea, Japan, and China have established themselves as trendsetters in the beauty industry, with consumers in these regions prioritizing skincare and seeking innovative products. BB creams, originating from South Korea, align with the emphasis on multi-functional skincare and natural-looking makeup favored in Asia-Pacific markets. Additionally, the influence of Korean beauty trends, coupled with increasing disposable incomes and urbanization in the region, fuels the BB cream market demand.

Value Chain Analysis
A value chain analysis of the BB cream market involves examining the various activities involved in the creation and distribution of BB creams, from raw material sourcing to the end consumer. Each stage of the value chain, companies identify opportunities for efficiency improvement, cost optimization, and value creation to gain a competitive advantage in the BB cream market.
Raw Material Sourcing: This stage involves sourcing raw materials such as moisturizers, sunscreens, pigments, and other active ingredients used in BB cream formulations. Suppliers play a crucial role in providing high-quality ingredients that meet regulatory standards and consumer preferences.
- Manufacturing and Production: Manufacturers blend and process the raw materials to create BB cream formulations. This includes formulation development, mixing, emulsifying, and packaging. Quality control processes are implemented to ensure consistency and safety of the final product.
- Packaging and Branding: Packaging plays a vital role in attracting consumers and conveying brand identity. Companies invest in aesthetically pleasing and functional packaging designs that reflect the product's benefits and target audience. Branding efforts also include marketing campaigns, product positioning, and celebrity endorsements to differentiate the product in the market.
- Distribution and Logistics: Distribution channels vary from retail stores to online platforms, depending on consumer preferences and market dynamics. Companies must establish efficient distribution networks to ensure timely delivery of products to retailers or directly to consumers. Logistics management is crucial for inventory control, warehousing, and transportation to minimize costs and meet demand fluctuations.
- Retail and Sales: BB creams are sold through various retail channels, including department stores, specialty beauty stores, pharmacies, and e-commerce platforms. Retailers play a role in product placement, promotion, and customer education. Sales teams engage with retailers to negotiate pricing, promotions, and shelf space to maximize visibility and sales.
- After-Sales Service and Customer Feedback: Providing excellent customer service and addressing consumer feedback is essential for building brand loyalty and sustaining long-term relationships. Companies may offer product samples, tutorials, and skincare consultations to enhance the customer experience and gather insights for product improvement.
- Regulatory Compliance and Quality Assurance: Compliance with regulatory requirements, such as ingredient safety, labeling standards, and product testing, is crucial to ensure product efficacy and consumer safety. Quality assurance processes, including batch testing and quality control checks, are implemented throughout the value chain to maintain product integrity and meet industry standards.
Market Segmentation
The BB cream market is segmented into skin type, SPF type, end user, distribution channel, and region. By skin type, the market is divided into dry, normal, oily, combination, and sensitive. By SPF type, the market is segregated into below 15 SPF, between 15-30 SPF, and above 30 SPF. By end user, the market is bifurcated into men and women. As per distribution channel, the market is classified into hypermarkets & supermarkets, specialty stores, online retail, and others. Region-wise, the market is analyzed across North America, Europe, Asia-Pacific, Latin America, and the Middle East and Africa.
Regional Market Outlook
Asia-Pacific held the major BB cream market share in 2023. This is attributed to the fact that people are more inclined toward cosmetic products and that Asian consumers are now more familiar with beauty products. The use of beauty products has risen in the Asia-Pacific region, owing to a rise in middle class and constant increase in disposable income among consumers, which propels the region to the top of the global cosmetics market.
Asia-Pacific includes some of the largest beauty brands of the world that contribute toward significant sales volumes across the region, and account for about 40% of the worldwide cosmetics market. The most promising growth rate on this course is expected to come from Asia-Pacific.
Industry Trends
Natural and Organic Formulations: The increase in consumer demand for clean beauty products has led to a rise in usage of BB creams formulated with natural and organic ingredients. Brands are focusing on plant-based extracts, minerals, and vitamins to offer skincare benefits alongside makeup coverage. this trend is expected to boost the market growth during BB cream market forecast
In October 2023, Organic Harvest entered the color cosmetics category with the launch of a new makeup line, offering toxin-free and cruelty-free formulations. The makeup collection offers 6 new product categories - matte lipstick in 12 shades, matte liquid lipstick in 8 shades, BB cream in 3 shades, matte compact in 3 shades, kohl, and liquid eyeliner.
- Customization and Personalization: Brands are offering BB creams in a wider range of shades to match diverse skin tones. Some companies also provide customizable options, allowing consumers to adjust coverage, finish, and skincare benefits based on their individual preferences and needs.
Competitive Landscape
The major players operating in the BB cream market include L’Oreal S.A., The Estee Lauder Companies Inc., The Clorox Company, L'Occitane International S.A., AmorePacific Corporation, Stila Styles LLC, Tarte Inc., Lancome SA, Groupe Marcelle, Bobbi Brown Professional Cosmetics Inc., Physicians Formula Holdings Inc., Clinique Laboratories LLC, Dr. Jart, Missha US Inc., Shiseido Company, Limited, Unilever, Christian Dior SE, Avon Products, Inc., Coty, Inc., and Revlon, Inc.
Recent Key Strategies and Developments
In October 2021, KOSÉ and Kao to embark on Comprehensive Collaboration in the Sustainability Domain of the Cosmetics Business Parties to Create Solutions to Promote a Sustainable Society in a Wide Range of Fields.
In March 2022, L'Occitane acquired a majority share of Grown Alchemist from boutique investment band Lempriere Wells.
- In December 2021, L’Oréal S.A. acquired Youth to the People, a skincare company based in California, that utilizes extracts form superfoods for the creation of its skin care products.
- In December 2019, L’Oréal S.A. formed an exclusive licensing agreement with Prada to create and distribute cosmetics for Prada.
Key Sources Referred
FDA (Food and Drug Administration)
EU Cosmetics Regulation
- Cosmetic Ingredient Review (CIR)
- Korean Food and Drug Administration (KFDA)
- Japan Cosmetic Center (JCC)
- Cosmetic, Toiletry, and Fragrance Association (CTFA)
- International Organization for Standardization (ISO)
- American Academy of Dermatology (AAD)
- Cosmetic Executive Women (CEW)
- Cosmetic, Toiletry, and Perfumery Association (CTPA)
- Health Canada
- Australian Competition and Consumer Commission (ACCC)
- China Food and Drug Administration (CFDA)
- International Nomenclature of Cosmetic Ingredients (INCI)
Key Benefits For Stakeholders
This report provides a quantitative analysis of the market segments, current trends, estimations, and dynamics of the BB cream market analysis from 2024 to 2033 to identify the prevailing market opportunities.
The market research is offered along with information related to key drivers, restraints, and opportunities.
- Porter's five forces analysis highlights the potency of buyers and suppliers to enable stakeholders make profit-oriented business decisions and strengthen their supplier-buyer network.
- In-depth analysis of the BB cream market segmentation assists to determine the prevailing market opportunities.
- Major countries in each region are mapped according to their revenue contribution to the global market.
- Market player positioning facilitates benchmarking and provides a clear understanding of the present position of the market players.
- The report includes the analysis of the regional as well as global BB cream market trends, key players, market segments, application areas, and market growth strategies.
BB Cream Market Report Highlights
| Aspects | Details |
| Market Size By 2033 | USD 10.0 Billion |
| Growth Rate | CAGR of 8.1% |
| Forecast period | 2024 - 2033 |
| Report Pages | 334 |
| By Skin Type |
|
| By SPF Type |
|
| By End User |
|
| By Distribution Channel |
|
| By Region |
|
| Key Market Players | Tarte Inc., The Clorox Company, Missha US Inc., Avon Products, Inc., Revlon, Inc., L'Occitane International S.A., Coty, Inc., Bobbi Brown Professional Cosmetics Inc., Dr. Jart, Physicians Formula Holdings Inc., Shiseido Company, Limited, Groupe Marcelle, Christian Dior SE, AmorePacific Corporation, The Estee Lauder Companies Inc., Hindustan Unilever Limited, Stila Styles LLC, L’Oreal S.A., Clinique Laboratories LLC, Lancome SA |
The global bb cream market was valued at $4.6 billion in 2023, and is projected to reach $10.0 Billion by 2033, growing at a CAGR of 8.1% from 2024 to 2033
The BB cream market is segmented into skin type, SPF type, end user, distribution channel, and region. By skin type, the market is divided into dry, normal, oily, combination, and sensitive. By SPF type, the market is segregated into below 15 SPF, between 15-30 SPF, and above 30 SPF. By end user, the market is bifurcated into men and women. As per distribution channel, the market is classified into hypermarkets & supermarkets, specialty stores, online retail, and others. Region-wise, the market
Asia-Pacific is the largest regional market for bb cream
The major players operating in the BB cream market include L’Oreal S.A., The Estee Lauder Companies Inc., The Clorox Company, L'Occitane International S.A., AmorePacific Corporation, Stila Styles LLC, Tarte Inc., Lancome SA, Groupe Marcelle, Bobbi Brown Professional Cosmetics Inc., Physicians Formula Holdings Inc., Clinique Laboratories LLC, Dr. Jart, Missha US Inc., Shiseido Company, Limited, Unilever, Christian Dior SE, Avon Products, Inc., Coty, Inc., and Revlon, Inc.
The global bb cream market report is available on request on the website of Allied Market Research.
Loading Table Of Content...

