
Beta-Alanine Market Research, 2033
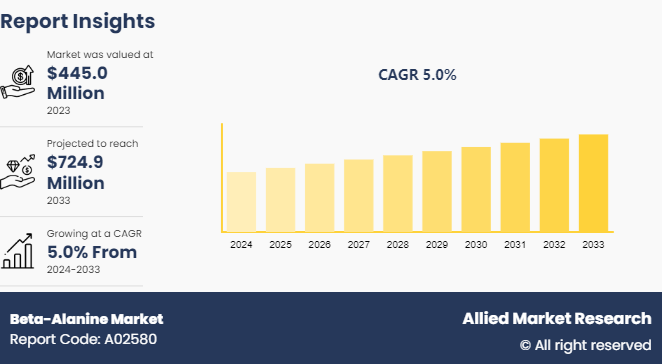
The global beta-alanine market was valued at $445.0 million in 2023, and is projected to reach $724.9 million by 2033, growing at a CAGR of 5% from 2024 to 2033.
Market Introduction and Definition
Beta-Alanine is a non-essential amino acid and a beta amino acid, characterized by the amino group being at the beta position from the carboxyl group. It differs from alpha-alanine, a constituent of proteins. Beta-alanine is crucial in muscle performance due to its role in synthesizing carnosine, which buffers hydrogen ions in muscle tissues, thereby reducing fatigue during high-intensity exercise. This buffering capability helps to maintain optimal pH levels in muscles, enhancing endurance and performance.
Beta-alanine is commonly consumed as a dietary supplement by athletes and bodybuilders to improve physical performance. It is naturally found in poultry, meat, and fish. Beta-alanine supplementation is associated with a harmless tingling sensation known as paresthesia, a temporary effect resulting from high doses. Research supports its efficacy in increasing carnosine levels and delaying muscle fatigue, making it popular in sports nutrition.
Key Takeaways
- The Beta-Alanine market study covers 20 countries. The research includes a segment analysis of each country in terms of value for the projected period.
- More than 1,500 product literatures, industry releases, annual reports, and other such documents of major beta-alanine industry participants along with authentic industry journals, trade associations' releases, and government websites have been reviewed for generating high-value industry insights.
- The study integrated high-quality data, professional opinions and analysis, and critical independent perspectives. The research approach is intended to provide a balanced view of global markets and to assist stakeholders in making educated decisions to achieve their most ambitious growth objectives.
Key Market Dynamics
The expanding poultry industry presents a promising avenue for driving the growth of the beta-alanine market. Beta-Alanine, a non-essential amino acid, has gained traction as a feed additive in poultry production due to its potential to enhance muscle growth, improve meat quality, and boost overall productivity. Poultry producers are seeking innovative ways to optimize their operations and meet growing market demands as the global demand for poultry products continues to rise, driven by factors such as population growth, urbanization, and increase in protein consumption. Incorporating Beta-Alanine into poultry feed formulations offers a viable solution for improving feed efficiency, enhancing muscle development, and ultimately increasing the yield of high-quality poultry products. Furthermore, beta-alanine supplementation has been linked to improvements in feed conversion ratios and carcass characteristics, which can translate into cost savings for producers and higher profitability across the poultry value chain.
In recent years, there has been a notable rise in the poultry population globally, driven by increase in demand for chicken meat and eggs as staples in daily diets. This shift toward poultry products has been spurred by rise in prices of alternative meats, notably pork, particularly evident in the U.S. Over the period from 2017 to 2021, Europe witnessed a 4.6% increase in egg consumption, reaching 6, 135 metric tons by 2021. The Middle East is also expected to witness growth in poultry production during the forecast period. Notably, companies like Almarai in Saudi Arabia are heavily investing in the sector, allocating $ 1.12 billion toward the establishment of new farms to expand production capacities. With the poultry industry poised for further expansion, there is significant potential for beta-alanine suppliers and manufacturers to capitalize on the growth by providing tailored solutions that address the evolving needs of poultry producers for efficient and sustainable production practices.
Regulatory compliance is a significant restraint projected to hamper the growth of the beta-alanine market. Dietary supplements, including those containing beta-alanine, must adhere to strict regulations set by agencies such as the U.S. Food and Drug Administration (FDA) and the European Food Safety Authority (EFSA) . These regulations include various aspects, including ingredient safety, labeling, health claims, and manufacturing practices. Complying with these regulatory requirements can be complex and costly, as companies must invest in rigorous testing and quality assurance to demonstrate the safety and efficacy of their products. In addition, any health benefits claimed by beta-alanine supplements must be backed by substantial scientific evidence. Regulatory bodies meticulously scrutinize these claims, and failure to provide sufficient proof can lead to restrictions, product recalls, or bans, hampering consumer trust and reducing market acceptance. Furthermore, navigating the varying regulatory landscapes across different regions adds another layer of complexity, potentially delaying product launches and expansion plans. As a result, these regulatory challenges can significantly impact the operational costs, market entry, and overall growth potential of the beta-alanine market, making it harder for companies to thrive in this competitive industry.
The sports nutrition industry presents a lucrative opportunity for the growth of the beta-alanine market, fueled by the increase in demand for supplements that enhance athletic performance and support muscle development. Beta-alanine, a naturally occurring amino acid, has gained widespread popularity among athletes and fitness enthusiasts due to its ability to increase muscle carnosine levels. This elevation in carnosine concentration is linked to improved endurance, muscle strength, and overall athletic performance, making beta-alanine a sought-after ingredient in pre-workout and performance-enhancing supplements. Moreover, as the fitness and sports sectors continue to experience robust growth globally, there is a parallel surge in consumer interest in products that optimize physical performance and recovery. Athletes, from professional competitors to weekend warriors, are increasingly turning to science-backed supplements to gain a competitive edge and achieve their fitness goals. This trend drives the demand for innovative formulations that leverage beta-alanine's benefits alongwith other synergistic ingredients tailored to meet the diverse needs of athletes across various sports disciplines. Furthermore, the evolving landscape of sports nutrition extends beyond traditional athletes to include a broader demographic of health-conscious individuals seeking to enhance their fitness routines and overall well-being. This expansion of the market creates opportunities for beta-alanine manufacturers.
Market Segmentation
The beta-alanine market is segmented into grade, form, application, and region. By grade, the market is classified into food grade, pharmaceutical grade, feed grade and others. By form, the market is divided into powder, tablet, liquid and capsule. By application, the market is categorized into dietary supplements, pharmaceuticals, cosmetics, food additives, feed additives and others. Region-wise the market is analyzed across North America, Europe, Asia-Pacific, and LAMEA.
Patent Analysis of Global Beta-Alanine Market
China dominates the beta-alanine patent landscape with 35.42% of filings, reflecting its strong focus on innovation and development in the market. The U.S. follows at 21.55%, indicating significant activity and investment. The Europe and Canada hold 11.48% and 8.80%, respectively, showcasing Europe's and North America's competitive edge. The PCT system, at 5.99%, highlights the global reach of patent protection. The UK, the South Korea, France, Australia, and Spain contribute smaller, yet notable shares, underscoring their roles in this niche market. This distribution underscores the international interest and competition in the beta-alanine sector.

Competitive Landscape
The major players operating in the beta-alanine market include Natural Alternatives International, Inc., Anhui Huaheng Biotechnology Co., Ltd., Now Foods Inc., Prinova Group LLC., Spectrum Chemical, Wuxi Jinghai Amino Acid Co., Ltd., Xinfa Pharamceuticals Co.Ltd., NutraBio, Ultimate Nutrition, and Cellucor Inc.
Recent Key Strategies and Developments
- In January 2023, CarnoSyn Beta Alanine SR, is a sustained-release solution that was introduced by Natural Alternatives International (NAI) , the company that makes the patented CarnoSyn beta-alanine component. CarnoSyn Beta Alanine SR is made to gradually supply a continuous supply of beta-alanine to the muscles to optimize the advantages of beta-alanine supplementation.
- In December 2022, Bayannaoer Huaheng Biotechnology Co., Ltd. began a 7'000 t/a expansion project for beta-alanine derivatives in the Shuangfeng Industrial Zone in Hefei City, Anhui province. The goal is to have the project completed by March 2023. The manufacture of 500, 000 t/a of succinic acid and 50, 000 t/a of malic acid are planned additions.
- In February 2022, MusclePharm Corporation, a well-known international business that specializes in lifestyle-focused branded nutritional supplements and sports nutrition, has established a strategic partnership with Alliance Sales & Marketing at the national level. The principal aim of this collaboration is to accelerate the growth of MusclePharm's energy drink segment.
- In July 2021, to develop a cutting-edge powdered nutritional supplement for pre-workout use, NutraBio confidentially worked with KLZ. 3D Pump Breakthrough's benefits and synergistic effects are maximized with this revolutionary supplement.
Regional Market Outlook
Asia-Pacific is experiencing robust economic growth. The beta-alanine market in Asia-Pacific is poised for significant growth due to the increase in application of feed additives. Beta-alanine, an amino acid crucial for muscle endurance and reducing fatigue, is becoming integral in animal nutrition to enhance performance and overall health. This rise is driven by the expanding livestock industry and the demand for high-quality animal products. In addition, advancements in animal husbandry practices and surge in awareness among farmers about the benefits of feed additives are further propelling market expansion. The region's economic growth and increase in investment in the agricultural sector also contribute to the surge in demand for beta-alanine-based feed additives.
- In 2022, fish feed dominated the global feed market, making up 73.2% due to the high consumption and production of fish, especially in the Asia-Pacific region. The following fish, shrimp and other aquatic species also held significant shares in the market. Shrimp, in particular, is heavily imported by European countries and the U.S. To meet the increasing demand for seafood, countries are intensifying their aquaculture efforts. For example, India significantly raised its Department of Fisheries budget from $ 114.1 million in 2020 to $ 168.8 million in 2021 to boost production, which is anticipated to drive feed additives demand during the forecast period. Thus, the increase in feed additives is expected to drive the growth of beta-alanine market.
- The Asia-Pacific region has become the leading producer of poultry birds, witnessing a 6.6% rise in production from 2017 to 2022. This surge is attributed to the increased demand for animal protein following the African Swine Fever outbreak, which led to a decrease in pork supply. China, contributing 40% to the global production, houses over 900 million laying hens. In addition, China's largest layer poultry farm can hatch 60 million chicks annually.
- The demand for -feed additives is rising with the increase in poultry industry. Thus, the beta-alanine industry is growing rapidly, with flourishing demand in feed additive application.
Industry Trends
- The color cosmetics industry, encompassing eye, facial, and lip makeup categories, is thriving in countries like India and China. In India, local companies such as the Shahnaz Husain Group are exclusively offering herbal and ayurvedic cosmetic products, highlighting their long-term health benefits for the skin.
- In addition, premium global brands are experiencing increased sales as Indian consumers shift from basic products to more advanced and specialized cosmetics. International brands such as Revlon, Elle18, MAC, Sephora, L'Oreal, and Oriflame are expanding their presence in the Indian market by introducing more products, focusing on convenient and attractive packaging, and incorporating vegan ingredients to appeal to the youth.
- According to the World's Top Exporters, China was the third-largest importer of cosmetics globally in 2021, with imports totaling approximately $18.5 billion. Hong Kong followed as the next-largest cosmetics importer in the Asia-Pacific region, with imports valued at over $ 7.3 billion in 2021.
- Thus, the growing cosmetic industry is anticipated to boost the growth of the beta-alanine market due to its use in anti-aging products and skin care formulations. Beta-alanine’s properties improve skin elasticity and hydration, making it a popular ingredient in cosmetics aimed at enhancing skin health and appearance.
Key Sources Referred
- UNICEF
- Invest India
- Food and Drug Administration (FDA)
- World Health Organization (WHO)
- International Feed Industry Federation
- CLFMA Of India
Key Benefits For Stakeholders
- This report provides a quantitative analysis of the market segments, current trends, estimations, and dynamics of the market analysis to identify the prevailing beta-alanine market opportunities.
- The market research is offered along with information related to key drivers, restraints, and opportunities.
- Porter's five forces analysis highlights the potency of buyers and suppliers to enable stakeholders make profit-oriented business decisions and strengthen their supplier-buyer network.
- In-depth analysis of the beta-alanine market segmentation assists to determine the prevailing market opportunities.
- Major countries in each region are mapped according to their revenue contribution to the global market.
- Market player positioning facilitates benchmarking and provides a clear understanding of the present position of the market players.
- The report includes the analysis of the regional as well as global beta-alanine market trends, key players, market segments, application areas, and market growth strategies.
Beta-Alanine Market Report Highlights
| Aspects | Details |
| Market Size By 2033 | USD 724.9 Million |
| Growth Rate | CAGR of 5% |
| Forecast period | 2024 - 2033 |
| Report Pages | 300 |
| By Grade |
|
| By Form |
|
| By Application |
|
| By Region |
|
| Key Market Players | Ultimate Nutrition, NATURAL ALTERNATIVES INTERNATIONAL, INC., Anhui Huaheng Biotechnology Co., Ltd., Now Foods Inc., Spectrum Chemical, Cellucor Inc, Nutrabio Labs, Inc., Prinova Group LLC., Xinfa Pharamceuticals Co.Ltd., Wuxi Jinghai Amino Acid Co., Ltd. |
Beta-alanine market was valued at $445.0 million in 2023, and is estimated to reach $726.4 million by 2033, growing at a CAGR of 5.1% from 2024 to 2033.
Asia-Pacific is the largest regional market for Beta-Alanine.
Dietary supplements is the leading application of Beta-Alanine Market.
Natural Alternatives International, Inc., Anhui Huaheng Biotechnology Co., Ltd., Now Foods Inc., Prinova Group LLC., Spectrum Chemical, Wuxi Jinghai Amino Acid Co., Ltd., Xinfa Pharamceuticals Co.Ltd., NutraBio, Ultimate Nutrition, and Cellucor Inc are the top companies to hold the market share in Beta-Alanine.
Increasing demand for medical applications is the upcoming trend of Beta-Alanine Market in the globe.
Loading Table Of Content...

