0
New
New
2023
Bike Sharing Market

Bike Sharing Market

by Bike Type (Traditional/Convectional Bikes, E-Bikes), by Sharing System (Docked, Dock-less): Global Opportunity Analysis and Industry Forecast, 2023-2032

Report Code: A11309
Jun 2023 | Pages: 196
Tables: 101
Charts: 44
  • Formats*:

  • pdf

    Single User License, Five User
    License & Enterprise User License

  • xls

    Data Pack Excel License

  • ppt

    It comes with the additional cost
    of $2500.00 contact sales.


The global bike sharing market size was valued at $6.6 billion in 2022, and is projected to reach $18.4 billion by 2032, growing at a CAGR of 11% from 2023 to 2032.

Report Key Highlighters:

  • The bike sharing market analysis study covers 16 countries. The research includes a segment analysis of each country in terms of value ($billion) for the projected period 2023-2032.
  • The study incorporated  research methodology aims to present a comprehensive outlook on global markets and aid key stakeholders & players in making well-informed decisions to accomplish their ambitious growth goals.
  • Over 1,500 product literatures, industry statements, annual reports, and other comparable materials from major bike sharing industry participants were reviewed to gain a better understanding of the market.
  • The  bike sharing market is fragmented, with several players including Anywheel Pte. Ltd, Bird Rides, Inc, BIXI, Bond Mobility (Europe) AG, Lime, Lyft, Inc., Mobike, Nextbike GmbH, Spin, and Uber Technologies Inc. Also tracked key strategies such as acquisitions, product launches, developments, partnership, mergers, expansion etc. of the players operating in the bike sharing industry.

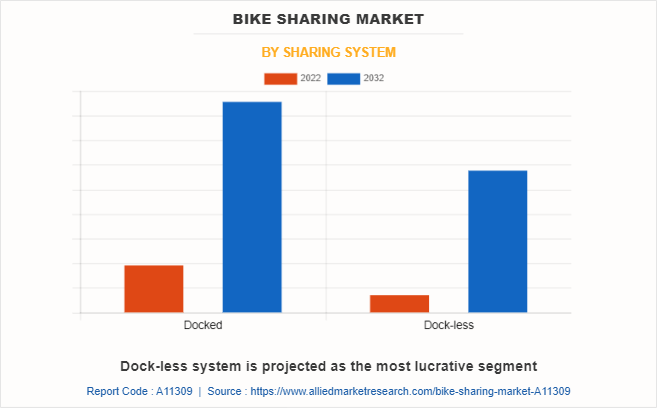
Bike sharing is a shared transport service in which conventional bikes or electric bikes are made available for shared use to individuals on a short-term basis for a price or free. Users may pick up bicycles around the city from multiple docked or dock-less stations and return them at another same system. Docks are special bike racks that lock the bike, and only release it by computer control, while dock-less bike share does not require a docking station, bikes can be parked within a defined bike rack or along the sidewalk. Bike sharing provides both locals and tourists an easy, low-cost, efficient means of transportation around cities. Bike sharing systems are often facilitated through mobile applications or membership cards, enabling users to locate and unlock bikes, track their usage, and make payments. The bike sharing market statistics has witnessed significant growth in recent years, driven by increasing urbanization, a focus on sustainable transportation options, and the popularity of shared mobility services.

Bike Sharing Market

The bike sharing market offers several benefits, including reduced traffic congestion, improved air quality, enhanced accessibility, and healthier lifestyles. It provides an affordable and eco-friendly transportation option for short-distance commuting, sightseeing, and leisure activities. In addition, bike sharing market share may complement existing public transportation networks, offering first-mile and last-mile connectivity. However, high initial investment cost and rise in bike vandalism & theft are expected to hinder the market growth. Further, technological advancements in bike sharing systems are projected to offer lucrative opportunities for market growth during the forecast period.

Bike Sharing Market

The bike sharing market is segmented on the basis of bike type, sharing system, and region. On the basis of bike type, it is bifurcated into traditional/convectional and e-bike. On the basis of sharing system, it is bifurcated into docked and dock-less. On the basis of region, the market is studied across North America, Europe, Asia-Pacific, and LAMEA.

The key players operating in the bike sharing market are Anywheel Pte. Ltd, Bird Rides, Inc, BIXI, Bond Mobility (Europe) AG, Lime, Lyft, Inc., Mobike, Nextbike GmbH, Spin, and Uber Technologies Inc.

Rise in venture capital and strategic investments

The significant rise in the preference for carpool and bike pool services among the regular office commuters is the primary factor contributing toward the growth of the ride hailing and ride sharing services. In addition, the increase in the services offered by the leading market players, including Uber and Ola, and the option to choose convenient pick-up and drop locations is encouraging the consumers to opt for ride hailing and ride sharing services and further boost its bike sharing market share. Moreover, a significant rise in the number of multiple ride-hailing and ride-sharing services such as bike sharing and auto sharing services even for short distance travel fuels the growth of the bike sharing industry. Furthermore, the ride sharing service providers are offering advantages such as affordable doorstep pick-up and drop, co-passenger information, and higher convenience as compared to the traditional transport service providers. This is expected to propel the demand for ride share services. In addition, several service providers offer various facilities, offers, and discounts such as monthly pass on shared ride to reduce the expenses of daily commuters and further boost bike sharing market trends.
Bike Sharing Market

Increase in inclusion of e-bikes in the sharing fleet

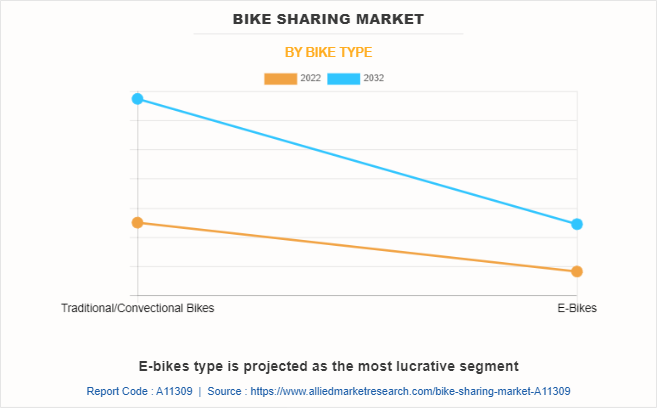
There is an increase in demand for e-bikes across the globe owing to their fast & flexible operations and zero carbon emissions. In addition, the rise in consumer inclination toward the usage of e-bikes as a cost-effective & eco-friendly transport solution adds up to bike sharing expansion. Moreover, an e-bike is the preferred option, as it better fulfils the requirement for higher speed in short-distance commuting, when compared to a pedal operated bike. Features such as higher speed, more convenience, effortless driving, and variable motor power as per the road conditions make e-bikes more preferred for sharing purposes.

Furthermore, governments across the world have taken various initiatives to promote the usage of e-bikes. For instance, the majority of the governments across the world look forward to converting fuel vehicles into electric vehicles to tackle environmental issues. Furthermore, several bike sharing providers have started focusing on expanding their fleet of e-bikes to sustain the growth in competition in the bike sharing industry. For instance, in April 2023, Nike, Lyft, and the Portland Bureau of Transportation made a joint announcement to expand their bike fleet by adding 500 bikes. In addition, bike-sharing startups such as Mobike, Hellobike and Ofo announced plans to add electric bikes to its fleet. Increase in adoption of e-bikes in bike sharing services is propelling the market growth.
Bike Sharing Market

Rise in bike vandalism and theft

Theft and vandalism of bikes have been a significant issue around the world, where dock-less operations have grown exponentially. Several dock-less bike-sharing service providers have reported the instance regarding the theft of the dock-less bikes. For instance, Chinese bike share startup Mobike has admitted that more than 200,000 of its rent-by-app bicycles were lost to theft or vandalism in 2019.

Moreover, the growth in theft and vandalism of electric bikes force market players to pull out their operations in several countries across the world. For instance, in November 2021, Nextbike announced that it is anticipated to shut down the scheme in the UK after months of vandalism, theft, and threats against staff. A total of 260 bikes have been scrapped due to vandalism. Furthermore, in September 2021, Chandigarh public bike-sharing system was plagued by vandalism and theft since its launch in the city. According to reports, a total of 193 bikes were damaged, and in at least four instances, users even took the bikes to their homes. This has resulted in huge losses for the companies, which in turn, hinder growth for the bike sharing market trend.

Increase in government initiatives for the development of bike-sharing infrastructure

Various governments across the world are offering subsidies to service providers for developing stations and expanding their reach to many commuters. For instance, in 2018, Chinese Municipal governments subsidized the Public Bike Sharing Program (PBSP) development to encourage non-motorized transport and offer convenient, flexible, and low-cost mobility options. These services are majorly used in urban areas due to the rise in traffic congestion and increased fuel prices.

In addition, the government authorities have provided incentives for the adoption of environment-friendly transport solutions including bicycles and electric bikes, owing to growth in concerns related to the rise in environmental pollution. Moreover, the government has set up the bike charging infrastructure, dedicated bike lanes and parking zones. For instance, in June 2020, Pittsburgh unveiled a 10-year plan to significantly expand bike infrastructure in the city by more than 120 miles of new trails, bicycle lanes and other street improvements. Increase in government initiatives for the development of reliable bike-sharing infrastructure along with the proliferation of smart cities across the globe are anticipated to offer lucrative growth opportunities for bike sharing market.

COVID-19 cause a significant impact on shared mobility and more particularly on the use of shared bikes. Moreover, stay-at-home orders and limited business operations in countries across the world resulted in a decrease in demand for bike sharing services in the first quarter of 2020. For instance, according to Citi Bike general manager Laura Fox, lockdowns reduced the number of rides by 60% in the first quarter of 2020 compared with the same in 2019. However, the pandemic sparked a new bike sharing trend across the world. People chose bike sharing services to cover medium to short distances in view of health and safety concerns during the outbreak. Urban consumers have seen a rise in demand for bike sharing services for maintaining social distancing as well as an alternative to public transport. For instance, according to research firm ITDP, after re-opening, trips using dock-less bike systems in Guangzhou and Beijing increased 60% and 150%, respectively. Meanwhile, Europe-centered bike-share operator Nextbike reported a 35% year-over-year spike in ridership in May 2020. Also, in London, the transit authority projected a 10% increase in bike sharing. Moreover, Citi Bike bike-share system of New York City reported 67% increase in bike sharing rides after lifting restriction.

Recent Developments

In March 2023, MYBYK launched two electric bicycle variants, MYBYK Electric and MYBYK Electric Cargo. The MYBYK Electric model is designed to cater to the needs of both citizens and tourists, offering a solution for convenient first and last-mile connectivity. On the other hand, the MYBYK Electric Cargo model targets gig-workers and aims to address the last-mile delivery challenges they face.

In June 2022, Anywheel Pte. Ltd. expanded its business and started shared bike service in Ang Mo Kio, Pasir Ris, Punggol and Tampines. The expansion of areas covered by the firm comes after Anywheel secured approval from the Land Transport Authority (LTA) to double its fleet size to 30,000 shared bicycles.

In February 2020, Uber Technologies Inc. has launched its JUMP e-bikes in Auckland. This expansion has given Auckland residents more travel options to get from A to B without the use of a car. Further, it is a crucial piece of plan to bring together different modes of transport in the Uber app.

Key Benefits For Stakeholders

  • This report provides a quantitative analysis of the market segments, current trends, estimations, and dynamics of the bike sharing market analysis from 2022 to 2032 to identify the prevailing bike sharing market opportunities.
  • The market research is offered along with information related to key drivers, restraints, and opportunities.
  • Porter's five forces analysis highlights the potency of buyers and suppliers to enable stakeholders make profit-oriented business decisions and strengthen their supplier-buyer network.
  • In-depth analysis of the bike sharing market segmentation assists to determine the prevailing market opportunities.
  • Major countries in each region are mapped according to their revenue contribution to the global market.
  • Market player positioning facilitates benchmarking and provides a clear understanding of the present position of the market players.
  • The report includes the analysis of the regional as well as global bike sharing market trends, key players, market segments, application areas, and market growth strategies.

Bike Sharing Market Report Highlights

Aspects Details
Market Size By 2032 USD 18.4 billion
Growth Rate CAGR of 11%
Forecast period 2022 - 2032
Report Pages 196
By Sharing System
  • Docked
  • Dock-less
By Bike Type
  • Traditional/Convectional Bikes
  • E-Bikes
By Region
  • North America  (U.S., Canada, Mexico)
  • Europe  (UK, Germany, France, Italy, Rest of Europe)
  • Asia-Pacific  (China, Japan, India, South Korea, Rest of Asia-Pacific)
  • LAMEA  (Latin America, Middle East, Africa)
Key Market Players Bird Rides, Inc., BOND MOBILITY (EUROPE) AG, Lyft, Inc., TIER Mobility SE, MOBIKE, Uber Technologies Inc., BIXI, Lime, SPIN, Anywheel Pte. Ltd.
 
  • CHAPTER 1: INTRODUCTION

    • 1.1. Report description

    • 1.2. Key market segments

    • 1.3. Key benefits to the stakeholders

    • 1.4. Research Methodology

      • 1.4.1. Primary research

      • 1.4.2. Secondary research

      • 1.4.3. Analyst tools and models

  • CHAPTER 2: EXECUTIVE SUMMARY

    • 2.1. CXO Perspective

  • CHAPTER 3: MARKET OVERVIEW

    • 3.1. Market definition and scope

    • 3.2. Key findings

      • 3.2.1. Top impacting factors

      • 3.2.2. Top investment pockets

    • 3.3. Porter’s five forces analysis

      • 3.3.1. Moderate bargaining power of suppliers

      • 3.3.2. Moderate-high threat of new entrants

      • 3.3.3. Moderate threat of substitutes

      • 3.3.4. Moderate-high intensity of rivalry

      • 3.3.5. Moderate-high bargaining power of buyers

    • 3.4. Market dynamics

      • 3.4.1. Drivers

        • 3.4.1.1. Rise in venture capital and strategic investments
        • 3.4.1.2. Increase in inclusion of e-bikes in the sharing fleet
        • 3.4.1.3. Growth environment concerns

      • 3.4.2. Restraints

        • 3.4.2.1. High initial investment cost
        • 3.4.2.2. Rise in bike vandalism & theft

      • 3.4.3. Opportunities

        • 3.4.3.1. Technological advancement in bike sharing system
        • 3.4.3.2. Increase in government initiatives for the development of bike-sharing infrastructure

    • 3.5. COVID-19 Impact Analysis on the market

  • CHAPTER 4: BIKE SHARING MARKET, BY BIKE TYPE

    • 4.1. Overview

      • 4.1.1. Market size and forecast

    • 4.2. Traditional/Convectional Bikes

      • 4.2.1. Key market trends, growth factors and opportunities

      • 4.2.2. Market size and forecast, by region

      • 4.2.3. Market share analysis by country

    • 4.3. E-Bikes

      • 4.3.1. Key market trends, growth factors and opportunities

      • 4.3.2. Market size and forecast, by region

      • 4.3.3. Market share analysis by country

  • CHAPTER 5: BIKE SHARING MARKET, BY SHARING SYSTEM

    • 5.1. Overview

      • 5.1.1. Market size and forecast

    • 5.2. Docked

      • 5.2.1. Key market trends, growth factors and opportunities

      • 5.2.2. Market size and forecast, by region

      • 5.2.3. Market share analysis by country

    • 5.3. Dock-less

      • 5.3.1. Key market trends, growth factors and opportunities

      • 5.3.2. Market size and forecast, by region

      • 5.3.3. Market share analysis by country

  • CHAPTER 6: BIKE SHARING MARKET, BY REGION

    • 6.1. Overview

      • 6.1.1. Market size and forecast By Region

    • 6.2. North America

      • 6.2.1. Key trends and opportunities

      • 6.2.2. Market size and forecast, by Bike Type

      • 6.2.3. Market size and forecast, by Sharing System

      • 6.2.4. Market size and forecast, by country

        • 6.2.4.1. U.S.
          • 6.2.4.1.1. Key market trends, growth factors and opportunities
          • 6.2.4.1.2. Market size and forecast, by Bike Type
          • 6.2.4.1.3. Market size and forecast, by Sharing System
        • 6.2.4.2. Canada
          • 6.2.4.2.1. Key market trends, growth factors and opportunities
          • 6.2.4.2.2. Market size and forecast, by Bike Type
          • 6.2.4.2.3. Market size and forecast, by Sharing System
        • 6.2.4.3. Mexico
          • 6.2.4.3.1. Key market trends, growth factors and opportunities
          • 6.2.4.3.2. Market size and forecast, by Bike Type
          • 6.2.4.3.3. Market size and forecast, by Sharing System
    • 6.3. Europe

      • 6.3.1. Key trends and opportunities

      • 6.3.2. Market size and forecast, by Bike Type

      • 6.3.3. Market size and forecast, by Sharing System

      • 6.3.4. Market size and forecast, by country

        • 6.3.4.1. UK
          • 6.3.4.1.1. Key market trends, growth factors and opportunities
          • 6.3.4.1.2. Market size and forecast, by Bike Type
          • 6.3.4.1.3. Market size and forecast, by Sharing System
        • 6.3.4.2. Germany
          • 6.3.4.2.1. Key market trends, growth factors and opportunities
          • 6.3.4.2.2. Market size and forecast, by Bike Type
          • 6.3.4.2.3. Market size and forecast, by Sharing System
        • 6.3.4.3. France
          • 6.3.4.3.1. Key market trends, growth factors and opportunities
          • 6.3.4.3.2. Market size and forecast, by Bike Type
          • 6.3.4.3.3. Market size and forecast, by Sharing System
        • 6.3.4.4. Italy
          • 6.3.4.4.1. Key market trends, growth factors and opportunities
          • 6.3.4.4.2. Market size and forecast, by Bike Type
          • 6.3.4.4.3. Market size and forecast, by Sharing System
        • 6.3.4.5. Rest of Europe
          • 6.3.4.5.1. Key market trends, growth factors and opportunities
          • 6.3.4.5.2. Market size and forecast, by Bike Type
          • 6.3.4.5.3. Market size and forecast, by Sharing System
    • 6.4. Asia-Pacific

      • 6.4.1. Key trends and opportunities

      • 6.4.2. Market size and forecast, by Bike Type

      • 6.4.3. Market size and forecast, by Sharing System

      • 6.4.4. Market size and forecast, by country

        • 6.4.4.1. China
          • 6.4.4.1.1. Key market trends, growth factors and opportunities
          • 6.4.4.1.2. Market size and forecast, by Bike Type
          • 6.4.4.1.3. Market size and forecast, by Sharing System
        • 6.4.4.2. Japan
          • 6.4.4.2.1. Key market trends, growth factors and opportunities
          • 6.4.4.2.2. Market size and forecast, by Bike Type
          • 6.4.4.2.3. Market size and forecast, by Sharing System
        • 6.4.4.3. India
          • 6.4.4.3.1. Key market trends, growth factors and opportunities
          • 6.4.4.3.2. Market size and forecast, by Bike Type
          • 6.4.4.3.3. Market size and forecast, by Sharing System
        • 6.4.4.4. South Korea
          • 6.4.4.4.1. Key market trends, growth factors and opportunities
          • 6.4.4.4.2. Market size and forecast, by Bike Type
          • 6.4.4.4.3. Market size and forecast, by Sharing System
        • 6.4.4.5. Rest of Asia-Pacific
          • 6.4.4.5.1. Key market trends, growth factors and opportunities
          • 6.4.4.5.2. Market size and forecast, by Bike Type
          • 6.4.4.5.3. Market size and forecast, by Sharing System
    • 6.5. LAMEA

      • 6.5.1. Key trends and opportunities

      • 6.5.2. Market size and forecast, by Bike Type

      • 6.5.3. Market size and forecast, by Sharing System

      • 6.5.4. Market size and forecast, by country

        • 6.5.4.1. Latin America
          • 6.5.4.1.1. Key market trends, growth factors and opportunities
          • 6.5.4.1.2. Market size and forecast, by Bike Type
          • 6.5.4.1.3. Market size and forecast, by Sharing System
        • 6.5.4.2. Middle East
          • 6.5.4.2.1. Key market trends, growth factors and opportunities
          • 6.5.4.2.2. Market size and forecast, by Bike Type
          • 6.5.4.2.3. Market size and forecast, by Sharing System
        • 6.5.4.3. Africa
          • 6.5.4.3.1. Key market trends, growth factors and opportunities
          • 6.5.4.3.2. Market size and forecast, by Bike Type
          • 6.5.4.3.3. Market size and forecast, by Sharing System
  • CHAPTER 7: COMPETITIVE LANDSCAPE

    • 7.1. Introduction

    • 7.2. Top winning strategies

    • 7.3. Product Mapping of Top 10 Player

    • 7.4. Competitive Dashboard

    • 7.5. Competitive Heatmap

    • 7.6. Top player positioning, 2022

  • CHAPTER 8: COMPANY PROFILES

    • 8.1. Anywheel Pte. Ltd.

      • 8.1.1. Company overview

      • 8.1.2. Key Executives

      • 8.1.3. Company snapshot

      • 8.1.4. Operating business segments

      • 8.1.5. Product portfolio

      • 8.1.6. Key strategic moves and developments

    • 8.2. Bird Rides, Inc.

      • 8.2.1. Company overview

      • 8.2.2. Key Executives

      • 8.2.3. Company snapshot

      • 8.2.4. Operating business segments

      • 8.2.5. Product portfolio

      • 8.2.6. Key strategic moves and developments

    • 8.3. BIXI

      • 8.3.1. Company overview

      • 8.3.2. Key Executives

      • 8.3.3. Company snapshot

      • 8.3.4. Operating business segments

      • 8.3.5. Product portfolio

      • 8.3.6. Key strategic moves and developments

    • 8.4. BOND MOBILITY (EUROPE) AG

      • 8.4.1. Company overview

      • 8.4.2. Key Executives

      • 8.4.3. Company snapshot

      • 8.4.4. Operating business segments

      • 8.4.5. Product portfolio

      • 8.4.6. Key strategic moves and developments

    • 8.5. Lime

      • 8.5.1. Company overview

      • 8.5.2. Key Executives

      • 8.5.3. Company snapshot

      • 8.5.4. Operating business segments

      • 8.5.5. Product portfolio

      • 8.5.6. Key strategic moves and developments

    • 8.6. Lyft, Inc.

      • 8.6.1. Company overview

      • 8.6.2. Key Executives

      • 8.6.3. Company snapshot

      • 8.6.4. Operating business segments

      • 8.6.5. Product portfolio

      • 8.6.6. Business performance

      • 8.6.7. Key strategic moves and developments

    • 8.7. MOBIKE

      • 8.7.1. Company overview

      • 8.7.2. Key Executives

      • 8.7.3. Company snapshot

      • 8.7.4. Operating business segments

      • 8.7.5. Product portfolio

    • 8.8. TIER Mobility SE

      • 8.8.1. Company overview

      • 8.8.2. Key Executives

      • 8.8.3. Company snapshot

      • 8.8.4. Operating business segments

      • 8.8.5. Product portfolio

      • 8.8.6. Key strategic moves and developments

    • 8.9. SPIN

      • 8.9.1. Company overview

      • 8.9.2. Key Executives

      • 8.9.3. Company snapshot

      • 8.9.4. Operating business segments

      • 8.9.5. Product portfolio

      • 8.9.6. Key strategic moves and developments

    • 8.10. Uber Technologies Inc.

      • 8.10.1. Company overview

      • 8.10.2. Key Executives

      • 8.10.3. Company snapshot

      • 8.10.4. Operating business segments

      • 8.10.5. Product portfolio

      • 8.10.6. Business performance

      • 8.10.7. Key strategic moves and developments

  • LIST OF TABLES

  • TABLE 01. GLOBAL BIKE SHARING MARKET, BY BIKE TYPE, 2022-2032 ($MILLION)
    TABLE 02. BIKE SHARING MARKET FOR TRADITIONAL/CONVECTIONAL BIKES, BY REGION, 2022-2032 ($MILLION)
    TABLE 03. BIKE SHARING MARKET FOR E-BIKES, BY REGION, 2022-2032 ($MILLION)
    TABLE 04. GLOBAL BIKE SHARING MARKET, BY SHARING SYSTEM, 2022-2032 ($MILLION)
    TABLE 05. BIKE SHARING MARKET FOR DOCKED, BY REGION, 2022-2032 ($MILLION)
    TABLE 06. BIKE SHARING MARKET FOR DOCK-LESS, BY REGION, 2022-2032 ($MILLION)
    TABLE 07. BIKE SHARING MARKET, BY REGION, 2022-2032 ($MILLION)
    TABLE 08. NORTH AMERICA BIKE SHARING MARKET, BY BIKE TYPE, 2022-2032 ($MILLION)
    TABLE 09. NORTH AMERICA BIKE SHARING MARKET, BY SHARING SYSTEM, 2022-2032 ($MILLION)
    TABLE 10. NORTH AMERICA BIKE SHARING MARKET, BY COUNTRY, 2022-2032 ($MILLION)
    TABLE 11. U.S. BIKE SHARING MARKET, BY BIKE TYPE, 2022-2032 ($MILLION)
    TABLE 12. U.S. BIKE SHARING MARKET, BY SHARING SYSTEM, 2022-2032 ($MILLION)
    TABLE 13. CANADA BIKE SHARING MARKET, BY BIKE TYPE, 2022-2032 ($MILLION)
    TABLE 14. CANADA BIKE SHARING MARKET, BY SHARING SYSTEM, 2022-2032 ($MILLION)
    TABLE 15. MEXICO BIKE SHARING MARKET, BY BIKE TYPE, 2022-2032 ($MILLION)
    TABLE 16. MEXICO BIKE SHARING MARKET, BY SHARING SYSTEM, 2022-2032 ($MILLION)
    TABLE 17. EUROPE BIKE SHARING MARKET, BY BIKE TYPE, 2022-2032 ($MILLION)
    TABLE 18. EUROPE BIKE SHARING MARKET, BY SHARING SYSTEM, 2022-2032 ($MILLION)
    TABLE 19. EUROPE BIKE SHARING MARKET, BY COUNTRY, 2022-2032 ($MILLION)
    TABLE 20. UK BIKE SHARING MARKET, BY BIKE TYPE, 2022-2032 ($MILLION)
    TABLE 21. UK BIKE SHARING MARKET, BY SHARING SYSTEM, 2022-2032 ($MILLION)
    TABLE 22. GERMANY BIKE SHARING MARKET, BY BIKE TYPE, 2022-2032 ($MILLION)
    TABLE 23. GERMANY BIKE SHARING MARKET, BY SHARING SYSTEM, 2022-2032 ($MILLION)
    TABLE 24. FRANCE BIKE SHARING MARKET, BY BIKE TYPE, 2022-2032 ($MILLION)
    TABLE 25. FRANCE BIKE SHARING MARKET, BY SHARING SYSTEM, 2022-2032 ($MILLION)
    TABLE 26. ITALY BIKE SHARING MARKET, BY BIKE TYPE, 2022-2032 ($MILLION)
    TABLE 27. ITALY BIKE SHARING MARKET, BY SHARING SYSTEM, 2022-2032 ($MILLION)
    TABLE 28. REST OF EUROPE BIKE SHARING MARKET, BY BIKE TYPE, 2022-2032 ($MILLION)
    TABLE 29. REST OF EUROPE BIKE SHARING MARKET, BY SHARING SYSTEM, 2022-2032 ($MILLION)
    TABLE 30. ASIA-PACIFIC BIKE SHARING MARKET, BY BIKE TYPE, 2022-2032 ($MILLION)
    TABLE 31. ASIA-PACIFIC BIKE SHARING MARKET, BY SHARING SYSTEM, 2022-2032 ($MILLION)
    TABLE 32. ASIA-PACIFIC BIKE SHARING MARKET, BY COUNTRY, 2022-2032 ($MILLION)
    TABLE 33. CHINA BIKE SHARING MARKET, BY BIKE TYPE, 2022-2032 ($MILLION)
    TABLE 34. CHINA BIKE SHARING MARKET, BY SHARING SYSTEM, 2022-2032 ($MILLION)
    TABLE 35. JAPAN BIKE SHARING MARKET, BY BIKE TYPE, 2022-2032 ($MILLION)
    TABLE 36. JAPAN BIKE SHARING MARKET, BY SHARING SYSTEM, 2022-2032 ($MILLION)
    TABLE 37. INDIA BIKE SHARING MARKET, BY BIKE TYPE, 2022-2032 ($MILLION)
    TABLE 38. INDIA BIKE SHARING MARKET, BY SHARING SYSTEM, 2022-2032 ($MILLION)
    TABLE 39. SOUTH KOREA BIKE SHARING MARKET, BY BIKE TYPE, 2022-2032 ($MILLION)
    TABLE 40. SOUTH KOREA BIKE SHARING MARKET, BY SHARING SYSTEM, 2022-2032 ($MILLION)
    TABLE 41. REST OF ASIA-PACIFIC BIKE SHARING MARKET, BY BIKE TYPE, 2022-2032 ($MILLION)
    TABLE 42. REST OF ASIA-PACIFIC BIKE SHARING MARKET, BY SHARING SYSTEM, 2022-2032 ($MILLION)
    TABLE 43. LAMEA BIKE SHARING MARKET, BY BIKE TYPE, 2022-2032 ($MILLION)
    TABLE 44. LAMEA BIKE SHARING MARKET, BY SHARING SYSTEM, 2022-2032 ($MILLION)
    TABLE 45. LAMEA BIKE SHARING MARKET, BY COUNTRY, 2022-2032 ($MILLION)
    TABLE 46. LATIN AMERICA BIKE SHARING MARKET, BY BIKE TYPE, 2022-2032 ($MILLION)
    TABLE 47. LATIN AMERICA BIKE SHARING MARKET, BY SHARING SYSTEM, 2022-2032 ($MILLION)
    TABLE 48. MIDDLE EAST BIKE SHARING MARKET, BY BIKE TYPE, 2022-2032 ($MILLION)
    TABLE 49. MIDDLE EAST BIKE SHARING MARKET, BY SHARING SYSTEM, 2022-2032 ($MILLION)
    TABLE 50. AFRICA BIKE SHARING MARKET, BY BIKE TYPE, 2022-2032 ($MILLION)
    TABLE 51. AFRICA BIKE SHARING MARKET, BY SHARING SYSTEM, 2022-2032 ($MILLION)
    TABLE 52. ANYWHEEL PTE. LTD.: KEY EXECUTIVES
    TABLE 53. ANYWHEEL PTE. LTD.: COMPANY SNAPSHOT
    TABLE 54. ANYWHEEL PTE. LTD.: PRODUCT SEGMENTS
    TABLE 55. ANYWHEEL PTE. LTD.: PRODUCT PORTFOLIO
    TABLE 56. ANYWHEEL PTE. LTD.: KEY STRATERGIES
    TABLE 57. BIRD RIDES, INC.: KEY EXECUTIVES
    TABLE 58. BIRD RIDES, INC.: COMPANY SNAPSHOT
    TABLE 59. BIRD RIDES, INC.: PRODUCT SEGMENTS
    TABLE 60. BIRD RIDES, INC.: PRODUCT PORTFOLIO
    TABLE 61. BIRD RIDES, INC.: KEY STRATERGIES
    TABLE 62. BIXI: KEY EXECUTIVES
    TABLE 63. BIXI: COMPANY SNAPSHOT
    TABLE 64. BIXI: PRODUCT SEGMENTS
    TABLE 65. BIXI: PRODUCT PORTFOLIO
    TABLE 66. BIXI: KEY STRATERGIES
    TABLE 67. BOND MOBILITY (EUROPE) AG: KEY EXECUTIVES
    TABLE 68. BOND MOBILITY (EUROPE) AG: COMPANY SNAPSHOT
    TABLE 69. BOND MOBILITY (EUROPE) AG: PRODUCT SEGMENTS
    TABLE 70. BOND MOBILITY (EUROPE) AG: PRODUCT PORTFOLIO
    TABLE 71. BOND MOBILITY (EUROPE) AG: KEY STRATERGIES
    TABLE 72. LIME: KEY EXECUTIVES
    TABLE 73. LIME: COMPANY SNAPSHOT
    TABLE 74. LIME: PRODUCT SEGMENTS
    TABLE 75. LIME: PRODUCT PORTFOLIO
    TABLE 76. LIME: KEY STRATERGIES
    TABLE 77. LYFT, INC.: KEY EXECUTIVES
    TABLE 78. LYFT, INC.: COMPANY SNAPSHOT
    TABLE 79. LYFT, INC.: PRODUCT SEGMENTS
    TABLE 80. LYFT, INC.: SERVICE SEGMENTS
    TABLE 81. LYFT, INC.: PRODUCT PORTFOLIO
    TABLE 82. LYFT, INC.: KEY STRATERGIES
    TABLE 83. MOBIKE: KEY EXECUTIVES
    TABLE 84. MOBIKE: COMPANY SNAPSHOT
    TABLE 85. MOBIKE: PRODUCT SEGMENTS
    TABLE 86. MOBIKE: PRODUCT PORTFOLIO
    TABLE 87. TIER MOBILITY SE: KEY EXECUTIVES
    TABLE 88. TIER MOBILITY SE: COMPANY SNAPSHOT
    TABLE 89. TIER MOBILITY SE: PRODUCT SEGMENTS
    TABLE 90. TIER MOBILITY SE: PRODUCT PORTFOLIO
    TABLE 91. TIER MOBILITY SE: KEY STRATERGIES
    TABLE 92. SPIN: KEY EXECUTIVES
    TABLE 93. SPIN: COMPANY SNAPSHOT
    TABLE 94. SPIN: PRODUCT SEGMENTS
    TABLE 95. SPIN: PRODUCT PORTFOLIO
    TABLE 96. SPIN: KEY STRATERGIES
    TABLE 97. UBER TECHNOLOGIES INC.: KEY EXECUTIVES
    TABLE 98. UBER TECHNOLOGIES INC.: COMPANY SNAPSHOT
    TABLE 99. UBER TECHNOLOGIES INC.: PRODUCT SEGMENTS
    TABLE 100. UBER TECHNOLOGIES INC.: PRODUCT PORTFOLIO
    TABLE 101. UBER TECHNOLOGIES INC.: KEY STRATERGIES
  • LIST OF FIGURES

  • FIGURE 01. BIKE SHARING MARKET, 2022-2032
    FIGURE 02. SEGMENTATION OF BIKE SHARING MARKET, 2022-2032
    FIGURE 03. TOP INVESTMENT POCKETS IN BIKE SHARING MARKET (2023-2032)
    FIGURE 04. MODERATE BARGAINING POWER OF SUPPLIERS
    FIGURE 05. MODERATE-HIGH THREAT OF NEW ENTRANTS
    FIGURE 06. MODERATE THREAT OF SUBSTITUTES
    FIGURE 07. MODERATE-HIGH INTENSITY OF RIVALRY
    FIGURE 08. MODERATE-HIGH BARGAINING POWER OF BUYERS
    FIGURE 09. DRIVERS, RESTRAINTS AND OPPORTUNITIES: GLOBALBIKE SHARING MARKET
    FIGURE 09. BIKE SHARING MARKET, BY BIKE TYPE, 2022(%)
    FIGURE 10. COMPARATIVE SHARE ANALYSIS OF BIKE SHARING MARKET FOR TRADITIONAL/CONVECTIONAL BIKES, BY COUNTRY 2022 AND 2032(%)
    FIGURE 11. COMPARATIVE SHARE ANALYSIS OF BIKE SHARING MARKET FOR E-BIKES, BY COUNTRY 2022 AND 2032(%)
    FIGURE 12. BIKE SHARING MARKET, BY SHARING SYSTEM, 2022(%)
    FIGURE 13. COMPARATIVE SHARE ANALYSIS OF BIKE SHARING MARKET FOR DOCKED, BY COUNTRY 2022 AND 2032(%)
    FIGURE 14. COMPARATIVE SHARE ANALYSIS OF BIKE SHARING MARKET FOR DOCK-LESS, BY COUNTRY 2022 AND 2032(%)
    FIGURE 15. BIKE SHARING MARKET BY REGION, 2022
    FIGURE 16. U.S. BIKE SHARING MARKET, 2022-2032 ($MILLION)
    FIGURE 17. CANADA BIKE SHARING MARKET, 2022-2032 ($MILLION)
    FIGURE 18. MEXICO BIKE SHARING MARKET, 2022-2032 ($MILLION)
    FIGURE 19. UK BIKE SHARING MARKET, 2022-2032 ($MILLION)
    FIGURE 20. GERMANY BIKE SHARING MARKET, 2022-2032 ($MILLION)
    FIGURE 21. FRANCE BIKE SHARING MARKET, 2022-2032 ($MILLION)
    FIGURE 22. ITALY BIKE SHARING MARKET, 2022-2032 ($MILLION)
    FIGURE 23. REST OF EUROPE BIKE SHARING MARKET, 2022-2032 ($MILLION)
    FIGURE 24. CHINA BIKE SHARING MARKET, 2022-2032 ($MILLION)
    FIGURE 25. JAPAN BIKE SHARING MARKET, 2022-2032 ($MILLION)
    FIGURE 26. INDIA BIKE SHARING MARKET, 2022-2032 ($MILLION)
    FIGURE 27. SOUTH KOREA BIKE SHARING MARKET, 2022-2032 ($MILLION)
    FIGURE 28. REST OF ASIA-PACIFIC BIKE SHARING MARKET, 2022-2032 ($MILLION)
    FIGURE 29. LATIN AMERICA BIKE SHARING MARKET, 2022-2032 ($MILLION)
    FIGURE 30. MIDDLE EAST BIKE SHARING MARKET, 2022-2032 ($MILLION)
    FIGURE 31. AFRICA BIKE SHARING MARKET, 2022-2032 ($MILLION)
    FIGURE 32. TOP WINNING STRATEGIES, BY YEAR
    FIGURE 33. TOP WINNING STRATEGIES, BY DEVELOPMENT
    FIGURE 34. TOP WINNING STRATEGIES, BY COMPANY
    FIGURE 35. PRODUCT MAPPING OF TOP 10 PLAYERS
    FIGURE 36. COMPETITIVE DASHBOARD
    FIGURE 37. COMPETITIVE HEATMAP: BIKE SHARING MARKET
    FIGURE 38. TOP PLAYER POSITIONING, 2022
    FIGURE 39. LYFT, INC.: RESEARCH & DEVELOPMENT EXPENDITURE, 2020-2022 ($MILLION)
    FIGURE 40. LYFT, INC.: NET REVENUE, 2020-2022 ($MILLION)
    FIGURE 41. UBER TECHNOLOGIES INC.: NET SALES, 2020-2022 ($MILLION)
    FIGURE 42. UBER TECHNOLOGIES INC.: RESEARCH & DEVELOPMENT EXPENDITURE, 2020-2022 ($MILLION)
    FIGURE 43. UBER TECHNOLOGIES INC.: REVENUE SHARE BY SEGMENT, 2022 (%)
    FIGURE 44. UBER TECHNOLOGIES INC.: REVENUE SHARE BY REGION, 2022 (%)


PURCHASE OPTIONS

Call or Email us

U.S.-Canada Toll-free: +1-800-792-5285
Int'l : +1-503-894-6022
Europe : +44-845-528-1300
Email : help@alliedmarketresearch.com
 
FREQUENTLY ASKED QUESTIONS?

A. Anywheel Pte. Ltd, Bird Rides, Inc, BIXI, Bond Mobility (Europe) AG, Lime, Lyft, Inc., Mobike, Nextbike GmbH, Spin, and Uber Technologies Inc. are the top companies to hold the market share in Bike Sharing

A. $18.4 billion is the estimated industry size of Bike Sharing in 2032.

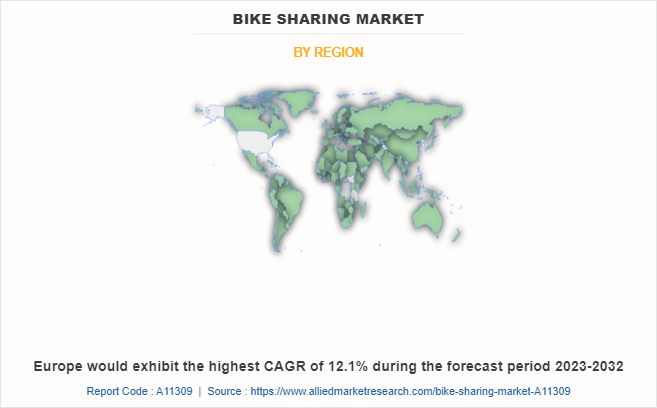
A. Asia-Pacific is the largest regional market for Bike Sharing

A. Reduced traffic congestion, improved air quality, enhanced accessibility, and healthier lifestyles are the leading application of Bike Sharing Market.

A. Integration of GPS technology, consumer-ready mobile payments and reducing the investment cost of locking & tracking systems for bikes are the upcoming trends of Bike Sharing Market in the world.

Looking for Customization?

 Customization Request

Have a Question?

 Speak with Analyst

Any Confusion?

 Inquire Before Buying

Have a glance of the Report

  Request Sample
RELATED TAGS

Purchase Full Report of
Bike Sharing Market

Start reading instantly.
This Report and over 67,068+ more Reports, Available with Avenue Library. T&C*.

  • Online Only
  • $3,570
  • Online cloud access only
  • Restricted print, copy, paste & download
  • Read only
  • Free industry update
    (Within 180 days)
  • Free report update in next update cycle
    (Jun 2024 - Jun 2025)
  • Data Pack
  • $3,840
  • Restricted to one authorized user
  • One print only
  • Available in
    Excel
  • Free industry update
    (Within 180 days)
  •   Free report update in next update cycle
    (Jun 2024 - Jun 2025)
  • Single User
  • $5,730
  • Restricted to one authorized user
  • One print only
  • Available in
    PDF
  • Free industry update
    (Within 180 days)
  •   Free report update in next update cycle
    (Jun 2024 - Jun 2025)
  • Five Users
  • $6,450
  • Limited to five authorized users
  • Print upto five copies
  • Available in
    PDF
  • Free industry update
    (Within 180 days)
  •   Free report update in next update cycle
    (Jun 2024 - Jun 2025)
  • Enterprise
    License/PDF

  • $9,600
  • Unlimited
    within
    company/enterprise
  • Available in Excel & PDF
  • Free industry update
    (Within 180 days)
  •   Free report update in next update cycle
    (Jun 2024 - Jun 2025)
  • Library
    Membership

  • $999 $ 1,175
    Per User/ Per month/ Billed annually
  • Published Content
    E-access
  • Company Profiles
    E-access
  • Newly Added Content Access
  • 10 PDF
    Downloads
  • 5 Excel Data
    Pack Downloads
  • 250 Company Profiles PDF Downloads
  • Buy Now

*Taxes/Fees, if applicable will be added during checkout. All prices in USD

RELATED REPORTS
 

Why Allied Market Research?


Infallible Methodology

To ensure high-level data integrity, accurate analysis, and impeccable forecasts

Analyst Support

For complete satisfaction

Customization

On-demand customization of scope of the report to exactly meet your needs

TARGETED MARKET VIEW

Targeted market view to provide pertinent information and save time of readers

Get fresh content delivered

Get insights on topics that are crucial for your business. Stay abreast of your interest areas.

Get Industry Data Alerts

Why Allied Market Research?

Infallible Methodology

To ensure high-level data integrity, accurate analysis, and impeccable forecasts

Analyst Support

For complete satisfaction

Customization

On-demand customization of scope of the report to exactly meet your needs

TARGETED MARKET VIEW

Targeted market view to provide pertinent information and save time of readers