
Binoculars Market Research, 2035
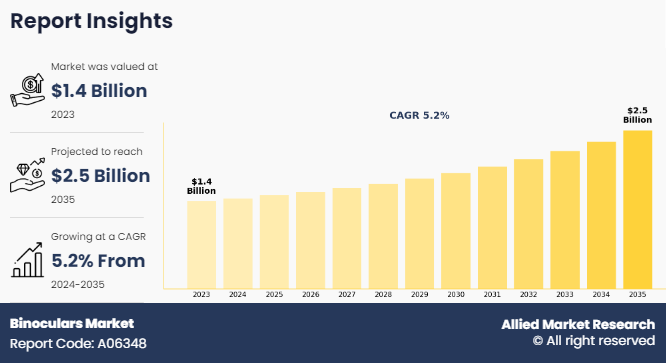
The global binoculars market size was valued at $1.4 billion in 2023, and is projected to reach $2.5 billion by 2035, growing at a CAGR of 5.2% from 2024 to 2035. Optical instruments called binoculars enlarge images through a pair of aligned lenses to provide a clear view of distant objects. Offering distinct viewing experiences, they are available in a variety of designs, including roof prism, porro prism, and night vision. Whether for sports, birding, stargazing, or sea navigation, binoculars are a common tool for outdoor pursuits. Magnification power, lens diameter, and field of view are important characteristics that impact clarity and range. As crucial equipment for both recreational and professional uses, modern binoculars come equipped with upgraded optical coatings, waterproofing, and image stabilization for better performance in a variety of settings.
MARKET DYNAMICS
The market for binoculars has been undergoing dynamic changes due to the rise in outdoor leisure activities, advancements in technology, and rising demand from different industries. These factors have influenced the global binoculars market's landscape, encouraging expansion and changing consumer tastes.
A major factor propelling the market for binoculars is the increase in outdoor recreational activities like hunting, sports events, animal observation, and bird watching. High-performance binoculars are sought after by both experts and enthusiasts to improve their experiences. In regions like North America and Europe, where outdoor activities are growing in popularity, this trend is especially strong. To fulfill the increased demand for portable and user-friendly products, manufacturers are responding by developing binoculars with higher optical performance, enhanced durability, and lightweight designs.
The market for binoculars has been greatly influenced by technological developments as well. The use of binoculars has increased due to the incorporation of advanced lenses, coatings, and digital functions like image stabilization and night vision. With these qualities, binoculars may now be used for a wider range of purposes, which benefits professionals in industries like surveillance, military, and marine navigation in addition to recreational consumers. Binoculars have become even more useful in challenging environments with the advent of waterproof and fog-proof models, attracting a wide variety of consumers.
A major factor in the market's growth has been the increasing usage of binoculars for military and defense purposes. Modern defense technology, such as advanced binoculars for target acquisition, surveillance, and reconnaissance, is being modernized by governments everywhere. These binoculars are of military grade and are essential tools in modern battle because of their night vision, thermal imaging, and range-finding capabilities. The market has been driven, especially in countries with large defense budgets like the US, China, and Russia, by the need for high-precision binoculars for military use.
Specialized binoculars are in high demand due to astronomical and marine applications, in addition to military uses. Astronomers and stargazers look for binoculars with the best magnification and clarity, while boaters and navigators frequently choose marine binoculars since they are made to resist rough sea conditions. Producing goods specifically for these specialized markets has allowed manufacturers to expand their company's prospects.
The increased interest in outdoor activities, rising disposable income, and growing defense budgets in nations like China, India, and Japan are all contributing to the Asia-Pacific region's emergence as a major participant in the binoculars industry. Due to the region's superior manufacturing skills, production has increased, and a wider range of people can now afford and obtain binoculars. It is anticipated that the need for binoculars will increase as more people in these nations participate in outdoor activities and wildlife tourism.
Some obstacles still exist despite the favorable market developments. The market for binoculars is subject to competition from alternative imaging technologies like smartphones and zoom-lens cameras, as well as the existence of counterfeit products. However, concentrating on product differentiation via technological advancements like digital overlays and augmented reality (AR) integration could reduce these challenges.
As a result, an increasing number of outdoor activities, technological developments, and expanding binoculars market demand from a variety of industries, such as astronomy, marine, and defense, are driving the binoculars market. In the coming years, the market is expected to rise steadily due to rising customer interest in high-performance optical devices and manufacturers' ongoing innovation.
SEGMENTAL OVERVIEW
The binoculars market is analyzed on the basis of type, application, demography, and region. By type, the market is divided into roof prism, night vision binoculars, marine binoculars, and others. By application, the market is bifurcated into astronomical equipment, tourism & adventure accessories, wildlife observation, and others. By demography, the market is bifurcated into men, women, and kids. Region-wise, the market is analyzed across North America (the U.S., Canada, and Mexico), Europe (France, Germany, Italy, Spain, UK, Russia, and the rest of Europe), Asia-Pacific (China, Japan, India, South Korea, Australia, Thailand, Malaysia, Indonesia, and the rest of Asia-Pacific), and LAMEA (Brazil, South Africa, Saudi Arabia, UAE, Argentina, and the rest of LAMEA).
BY TYPE
By type, the roof prism segment dominated the global binoculars market in 2023 and is anticipated to maintain its dominance during the forecast period. The binoculars market is dominated by the roof prism type, distinguished by its lightweight construction, small design, and exceptional optical performance. Due to their legendary endurance, roof prism binoculars are perfect for outdoor pursuits including hiking, hunting, and birdwatching. Compared to porro prism types, its straight-line optical path enables a sleeker design, which increases its portability. The need has been fueled by technological developments in coatings and lens quality, which have further improved image brightness and clarity. Due to the prevalence of outdoor leisure activities, North America and Europe are prevalent regions of this type.

BY APPLICATION
By application, the tourism and adventure accessories segment dominated the global binoculars market in 2023. The growing demand for travel and adventure equipment, including binoculars, is fueled by the growing appeal of outdoor pursuits including hiking, birdwatching, wildlife observation, and sightseeing. To improve their experiences, adventurers and travelers look for binoculars that are high-performance, lightweight, and portable. The increasing popularity of outdoor activities has led to a growing desire for waterproof and fog-proof versions, as well as to offer increased clarity and magnification. The market for adventure and tourism accessories is being further stimulated by the growing use of binoculars as necessary travel equipment in regions like Africa and Asia-Pacific, which are known for their rich biodiversity and popularity as tourist destinations.

BY DEMOGRAPHY
By demography, the men segment dominated the global binoculars market in 2023 and is anticipated to maintain its dominance during the forecast period. Men's interests in outdoor activities including hunting, bird watching, sports, and adventure travel are what largely fuel the market for binoculars. In addition, a significant proportion of the market for high-performance binoculars utilized in maritime navigation, law enforcement, and the military is composed of men. Male customers looking for better performance are attracted by these binoculars since they frequently have durable buildings, superior optics, and night vision. Furthermore, the market for specialist binoculars is growing due to the growing popularity of men's hobbies like astronomy and wildlife observation, which makes this market a top priority for producers of expensive products.

BY REGION
Region-wise, North America is predicted to dominate the market with the largest binoculars market share during the forecast period. An increasing number of people in North America are interested in outdoor leisure pursuits like hunting, wildlife observation, birdwatching, and sporting events, which is driving the market for binoculars. The region's high demand for innovative optical tools has also encouraged innovation, with producers concentrating on producing high-performance binoculars with waterproof construction, image stabilization, and night vision. The U.S. military and defense industries also make significant contributions by investing in advanced technology for reconnaissance and surveillance. Technological developments, growing disposable incomes, and the growing appeal of outdoor and marine activities throughout the region all contribute to the growth of the North American market.

COMPETITION ANALYSIS
The major players in the binoculars market include Kenko Tokina Co., Ltd., Olympus Corporation, Carl Zeiss AG, Swarovski Optik GmbH, Nikon Corporation, Canon Inc., Kite Optics, Kowa Co., Ltd., German Precision Optics (GPO), and Leica Camera AG.
SOME KEY DEVELOPMENTS IN THE MARKET
- In June 2022, Nikon Vision Co., Ltd., (Nikon Vision), a subsidiary of Nikon Corporation (Nikon), launched the new PROSTAFF P7 binocular series.
- In January 2023, ZEISS is introduced the ZEISS SFL 30, the newest, lightest, and most compact binoculars to the ZEISS SF family. The ZEISS SFL (SmartFocus and Lightweight) stands out for its exceptional optical performance combined with an extremely compact design and low weight. The new binoculars come in two models, the ZEISS SFL 8x30 and 10x30 configurations.
- In January 2024, SWAROVSKI OPTIK launched the first smart binoculars worldwide – the AX Visio. These AI-enhanced binoculars combine unmatched SWAROVISION brilliance with clever digital features, which ensure bird and wildlife identification in real time.
Key Benefits For Stakeholders
- This report provides a quantitative analysis of the binoculars market size, segments, current trends, estimations, and dynamics of the binoculars market analysis from 2023 to 2035 to identify the prevailing binoculars market opportunities.
- The market research is offered along with information related to key drivers, restraints, and opportunities.
- Porter's five forces analysis highlights the potency of buyers and suppliers to enable stakeholders make profit-oriented business decisions and strengthen their supplier-buyer network.
- In-depth analysis of the binoculars market segmentation assists to determine the prevailing market opportunities.
- Major countries in each region are mapped according to their revenue contribution to the global market.
- Market player positioning facilitates benchmarking and provides a clear understanding of the present position of the market players.
- The report includes the analysis of the regional as well as global binoculars market trends, key players, market segments, application areas, and binoculars market growth strategies.
Binoculars Market Report Highlights
| Aspects | Details |
| Market Size By 2035 | USD 2.5 billion |
| Growth Rate | CAGR of 5.2% |
| Forecast period | 2023 - 2035 |
| Report Pages | 340 |
| By Demography |
|
| By Type |
|
| By Application |
|
| By Region |
|
| Key Market Players | Nikon Corporation., German Precision Optics (GPO), Olympus Corporation, Canon Inc., Kowa Co., Ltd., Swarovski Optik GmbH, Kenko Tokina Co., Ltd., Carl Zeiss AG, Kite Optics, Leica Camera AG |
Analyst Review
The perspectives of the leading CXOs in the binoculars market are presented in this section. The growing need for binoculars in several industries, such as military, marine, and outdoor recreation, is propelling the market. Technological developments further fueled the sector's growth including incorporating digital imagery and night vision features. Roof Prism, Night Vision, and Marine Binoculars are important categories, each serving a particular purpose. Roof prism binoculars are a popular option for outdoor activities such as bird watching due to their robust design and small size. For military and security applications, night vision binoculars are crucial as they provide visibility in low light. Marine binoculars are essential for marine navigation and rescue operations since they are made for tough environments.
The increasing demand for adventure sports and wildlife tourism, particularly in North America and Europe, is another factor driving the market's growth in consumer interest. Growing disposable incomes and a growing interest in outdoor activities are driving Asia-Pacific's market's growth. Industry leaders are emphasizing advancements like lighter constructions and improved magnification to reach a wider audience of buyers. These factors, together with the growing use of binoculars in a variety of professional and recreational applications, are likely to fuel the market's growth trajectory.
The global binoculars market was valued at $1.4 billion in 2023, and is projected to reach $2.5 billion by 2035, growing at a CAGR of 5.2% from 2024 to 2035.
The forecast period in the Binoculars market report is 2024 to 2035.
The base year calculated in the Binoculars market report is 2023.
The top companies analyzed for the Binoculars market report are Kenko Tokina Co., Ltd., Olympus Corporation, Carl Zeiss AG, Swarovski Optik GmbH, Nikon Corporation, Canon Inc., Kite Optics, Kowa Co., Ltd., German Precision Optics (GPO), and Leica Camera AG.
The roof prism segment is the most influential segment in the Binoculars market report.
North America holds the maximum market share of the Binoculars market.
The company profile has been selected on the basis of key developments such as partnership, product launch, merger and acquisition.
The market value of the Binoculars market in 2023 was $1.4 billion.
Loading Table Of Content...
Loading Research Methodology...

