
Bioethanol Market Overview:
The global bioethanol market size was valued at $5,652 million in 2015, and is expected to reach $9,544 million by 2022, growing at a CAGR of 7.6% from 2016 to 2022. Bioethanol, an alternative to petrol, is a biofuel obtained from natural sources such as sugarcane, maize, and corn. Food crops are used to produce bioethanol; however, with the introduction of second- & third-generation biofuel technologies, the dependence on food crops for producing bioethanol has decreased. The manufacturers’ focus is more on using agricultural & forest residues and energy crops such as miscanthus, switchgrass, sugarcane bagasse for producing bioethanol.
The factors driving global bioethanol market are rise in environmental concerns that leads to inclination of manufacturers towards bioethanol production, blending mandates by regulatory bodies such as EPA (Environmental Protection Agency), and abundant raw material availability. However, high investment cost of cellulosic ethanol and issues about use of food crops for fuel production are expected to hamper the bioethanol market growth during forecast period. Moreover, development of second- & third-generation biofuels are expected to create innumerable growth opportunities in the bioethanol market.
Bioethanol Market Segmentation
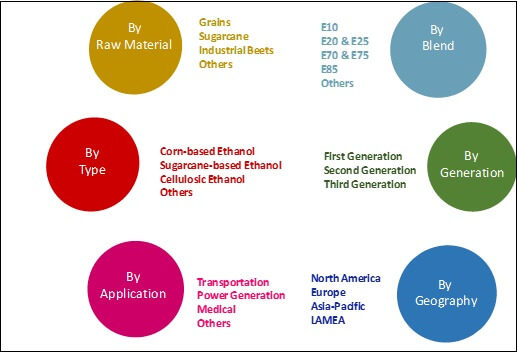
The global bioethanol market is segmented based on raw material, type, blend, generation, and geography. Based on raw material, it is classified into grains, sugarcane, industrial beets, and others that includes cereals, hemp, switchgrass, algae, and several others. Based on type, it is categorized into corn-based ethanol (wet milling & dry milling), sugarcane-based ethanol, cellulosic ethanol, and others. On the basis of blend, it is divided into E10, E20 & E25, E70 & E75, E85, and others. On the basis of generation, it is classified into first generation, second generation, and third generation. Based on application, it is classified into transportation, power generation, medical, and others that includes industrial applications.
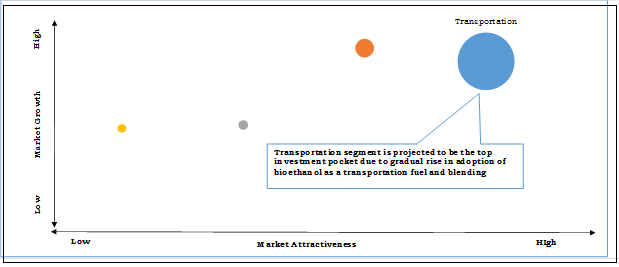
Top Investment Pocket
Transportation segment is anticipated to be the top investment pocket, owing to the rise in adoption of bioethanol as a transportation fuel and blending mandates by several regulatory bodies, such as Renewable Energy Directive (EU RED) and Renewable Fuel Standard (EPA RFS). In addition, with the rise in population and disposable income, the number of transportation vehicles is also increasing. According to the Energy Information Administration (EIA), the number of vehicles is expected to reach 1.7 million by 2035. Moreover, the liquid fuel consumption is expected to be the highest by the transportation sector, accounting nearly 73% of the total. The liquid fuel consumption is expected to reach 21.9 million gallons per day in 2035 from 19.1 million barrels per day in 2009. Thus, such high demand for bioethanol from the transportation industry is creating several growth opportunities.
Top Investment Pockets
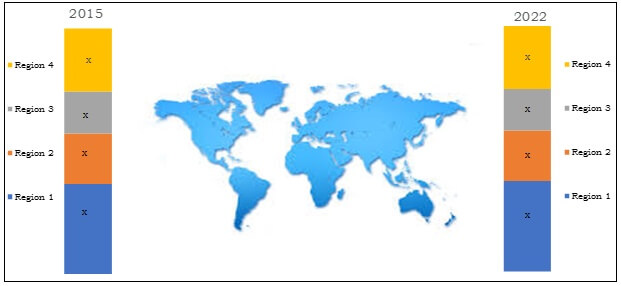
Geography Review
Geographically, the market is analyzed across North America, Europe, Asia-Pacific, and LAMEA. North America dominated the market in 2015, with over two-thirds share of global ethanol market, owing to the regulatory blending mandates and large number of manufacturing companies in the U.S. Asia-Pacific is expected to grow with the highest rate during the forecast period, caused by the increase in production capacities in China, Thailand, and India.
Bioethanol Market, By Geography, 2015 & 2022
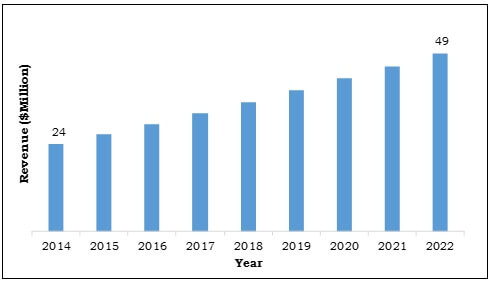
Italy Review
Italy is expected to witness the highest CAGR in the European bioethanol market, owing to the rapid increase in production capacity of first- & second-generation bioethanol. Major companies like Mossi & Ghisolfi and TPG are increasing their production capacity by setting up new plants and are also actively involved in other developmental activities such as, joint ventures and agreements.
Italy Bioethanol Market, 2014-2022 ($Million)
Key players operating in the bioethanol market include E. I. du Pont de Nemours and Company, POET LLC., Valero Renewable Fuels Company LLC., BP plc, CropEnergies AG, Archer Daniels Midland Company, Abengoa Bioenergy, BlueFire Ethanol Fuels Inc., Petrobras, and Royal Dutch Shell PLC.
Other major players in the bioethanol market (not included in the report) are Green Plains Renewable Energy, Inc., Absolute Energy, LLC. Aemetis, Inc., The Andersons, Inc., Flint Hills Resources, Cargill Inc., Myriant Corporation, Fulcrum BioEnergy Inc., Cool Planet Energy Systems Inc., and BioAmber Inc.
Key Benefits
This report provides a detailed study of bioethanol market trends and forecast from 2014 to 2022, which assist to identify the prevailing market opportunities.
In-depth coverage of the global market, that includes drivers, restraints, and opportunities, helps professionals to understand the market behavior in a better way.
- It includes market share analysis in terms of raw material, type, blend, generation, and application globally.
- Detailed study of the strategies of key leaders, partnerships, and acquisitions in the market is provided.
- Porter’s Five Forces analysis examines the competitive structure of the market and assists strategists in better decision-making.
Bioethanol Market Report Highlights
| Aspects | Details |
| By Row Material |
|
| By Type |
|
| By Blend |
|
| By Generation |
|
| By Application |
|
| By Geography |
|
| Key Market Players | PETROBRAS, VALERO RENEWABLE FUELS COMPANY LLC, ROYAL DUTCH SHELL PLC, BLUEFIRE ETHANOL FUELS INC., ABENGOA BIOENERGY, POET LLC, CROPENERGIES AG, E. I. DU PONT DE NEMOURS AND COMPANY, BP PLC, ARCHER DANIELS MIDLAND COMPANY |
Analyst Review
The bioethanol market is driven by blending mandates and several biofuel support policies by government. In addition, funds, tax incentives, and investment from both, private & public sector have augmented the growth of the market. Conventional bioethanol is produced by using food crops and thus, there are several issues regarding its production such as the food vs. fuel debate, global scarcity of food, especially in the Middle East while energy dependence on fossil fuels is also not a sustainable option. Production of transportation fuels using non-food crops and agricultural & forest residues is expected to reduce energy dependency on fossil fuels and food crops.
Increase in population and industrialization have resulted in increased GHG (greenhouse gas) emissions, which contributed to global warming. The urgent need to reduce the GHG emissions has led to the development of conventional biofuels such as bioethanol & biodiesel. However, conventional biofuels also have some disadvantages such as they are produced using food crops and it is not feasible to use food crops in the current scenario of food scarcity. Hence, second-generation biofuel, cellulosic ethanol was introduced, which are produced using non-food crops such as energy crops and agricultural & forest residue. In addition to environment-related issues, the scarcity and prices of petroleum-based fuels have also contributed to the rise in adoption of bioethanol.
Loading Table Of Content...

