
Biological Safety Cabinets Market Research, 2033
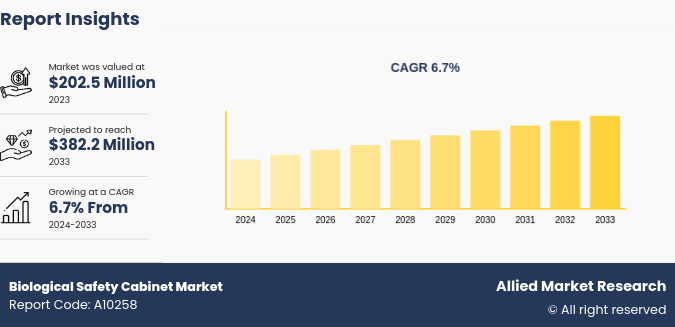
The global biological safety cabinets market size was valued at $202.5 million in 2023 and is projected to reach $382.2 million by 2033, growing at a CAGR of 6.7% from 2024 to 2033.
Market Introduction and Definition
A biological safety cabinet (BSC) , also known as a laminar flow or tissue culture hood, is a critical primary engineering control used to protect personnel from biohazardous or infectious agents while ensuring the quality control of materials. It operates by filtering both inflow and exhaust air, thus providing a barrier against exposure to particulates and aerosols.
BSCs are specifically designed to guard against potentially infectious aerosols and animal dander. They achieve this by recirculating a portion of the air back into the laboratory through an exhaust HEPA filter, which purifies the air effectively. However, it is important to note that while BSCs are effective in reducing exposure to biological contaminants, they do not mitigate exposure to chemical hazards. This makes them necessary in settings where biological safety is important, though additional measures are necessary for chemical safety.
Key Takeaways
- The biological safety cabinets market forecast study covers 20 countries. The research includes a segment analysis of each country in terms of value ($million) for the projected period from 2024 to 2033.
- More than 1, 500 product literatures, industry releases, annual reports, and other such documents of major energy storage system industry participants along with authentic industry journals, trade associations' releases, and government websites have been reviewed for generating high-value industry insights.
- The study integrates high-quality data, professional opinions and analysis, and critical independent perspectives. The research approach intends to provide a balanced view of global markets and assist stakeholders in making informed decisions in order to achieve their most ambitious growth objectives.
Key Market Dynamics
The growth of the biological safety cabinets market size is owing to increasing awareness regarding laboratory safety standards to protect health care professionals during medicinal procedures. In addition, stringent regulations mandating the use of safety cabinets in laboratories further boost biological safety cabinets market growth.
However, effective utilization of biological safety cabinets requires comprehensive training and awareness among laboratory personnel regarding proper usage, maintenance, and safety protocols, presenting challenges in ensuring consistent compliance and minimizing risks of contamination or accidents.
Advancements in technology, such as the integration of intuitive touchscreen displays and energy-efficient LED lighting, enhance user convenience and is projected to bolster biological safety cabinets market opportunity in the upcoming years.
Public Policy Analysis
The biosafety cabinet certification policy at the University of Nevada, Reno mandates that all biosafety cabinets (BSCs) , clean benches, HEPA filter banks, Animal Transfer Stations (ATSs) , and related ventilated equipment used for handling respirable biohazardous materials are certified to ensure safe operation and compliance with safety standards. Following are the reference regulations and/or consensus standards:
- Biosafety in Microbiological and Biomedical Laboratories (BMBL) , most recent edition.
- American National Standards Institute (ANSI) -National Sanitation Foundation (NSF) 49.
- NIH Guidelines
- 29 CFR 1910.1030 OSHA Bloodborne Pathogens Standard.
- Select Agents Regulations (7 CFR Part 331, 9 CFR Part 121, 42 CFR Part 73) .
Guidelines for Biosafety Cabinet Users:
- Receive proper training before using biosafety cabinets.
- Notify their PI and EH&S if problems are encountered while using their biosafety cabinet.
- Abide by EH&S and lab-specific procedures while using this equipment.
- Do not attempt to move, service, or perform other actions which may cause the certification of a cabinet to become voided.
- Work with certifying technicians and EH&S to allow access to biosafety cabinets and other equipment that requires certification, maintenance, or repair.
Market Segmentation
The biological safety cabinets market share is segmented into product, end use, and region. On the basis of product, the market is divided into class I, class II, and class III. By end use, the market is classified into pharmaceutical & biopharmaceutical companies, diagnostics & testing laboratories, and academic & research organizations. Region wise, the biological safety cabinets market share is analyzed across North America, Europe, Asia-Pacific, and LAMEA.
Country Outlook
India is witnessing a growing demand for biosafety cabinets due to increased research in biotechnology, pharmaceuticals, and healthcare sectors. Some of the major factors driving this demand include stringent safety regulations, rising incidences of infectious diseases, and increased awareness about laboratory safety. The government's support for R&D, along with rising investments in healthcare infrastructure are factors projected to drive market growth. For instance, India Investment Grid suggested 1154 investment projects in healthcare sector in India across all states, valued USD 31.14 billion. Moreover, the ongoing advancements in life sciences and the need for contamination-free environments in laboratories and research facilities further highlight the importance of biological safety cabinets industry in ensuring safe and efficient workspaces.
- In April 2024, Esco Lifesciences and Saksham Scientific recently hosted a seminar to promote biosafety awareness and ensure safe practices in laboratory settings, attracting around 38 participants. The event began with Samruddhii Patil, Business Development Executive at Esco Lifesciences, introducing the company's mission, products, and dedication to safety and innovation in the life sciences industry. Attendees engaged in interactive discussions, sharing experiences, and gaining valuable insights from industry experts. This collaboration highlighted Esco Lifesciences and Saksham Scientific's commitment toward advancing biosafety standards and fostering a culture of responsibility and excellence within the life sciences community.
Competitive Landscape
The major players operating in the biological safety cabinets industry include Labconco Corp., Thermo Fisher Scientific, Inc., The Baker Company, Inc., NuAire, Inc., Jinan Biobase Biotech Co. Ltd., AZBIL TELSTAR, S.L.U., Air Science USA LLC, Germfree Laboratories, Inc., Haier Biomedical (Qingdao Biomedical Co., Ltd.) , Cruma S.A., Esco Micro, and others.
Recent Key Strategies and Developments
- In August 2023, Labconco Corporation introduced the Nexus Horizontal Clean Bench, the first laminar flow hood with complete onboard intelligence, revolutionizing clean bench technology. The Nexus offers unmatched contamination protection for non-hazardous samples and processes. Powered by the user-friendly Nexus OS, it features a 5” touchscreen display, data logging, traceability, ethernet connectivity, and user customization, all enhancing the user experience. This innovative workstation ensures an ISO Class 4 clean air environment, maintaining the integrity of sensitive samples and processes. The Nexus sets a new industry standard with its advanced features and intelligent design.
Industry Trends
- In September 2022, Thermo Fisher Scientific launched the Thermo Scientific 1500 Series Biological Safety Cabinet (BSC) , designed to meet laboratory requirements, ensuring protection against biological hazards and contamination. This innovative cabinet integrates safety, energy efficiency, and user convenience, featuring an insightful touchscreen display for easy operation. With a focus on sustainability, it incorporates eco-friendly LED lighting, enhancing the work environment with brighter illumination. The 1500 Series BSC prioritizes both personal and product safety, providing laboratories with a comprehensive solution for their needs, maintaining a high standard of protection and usability.
- In 2022, Brazil reduced imports of medical devices by 7.3%, reaching $6.3 billion. The U.S. represents 19.1% of imported medical devices in Brazil, followed by China with 14% and Germany with 12%. Brazil is the fourteenth largest market for the U.S. medical devices and second in Latin America, after Mexico.
Key Sources Referred
- European Biosafety Association
- American Biological Safety Association
- Asia-Pacific Biosafety Association
- African Biological Safety Association
- Labconco Corp.
- Thermo Fisher Scientific, Inc.
- Haier Biomedical (Qingdao Biomedical Co., Ltd.)
Key Benefits For Stakeholders
- This report provides a quantitative analysis of the market segments, current trends, estimations, and dynamics of the biological safety cabinets market analysis from 2023 to 2033 to identify the prevailing biological safety cabinets market opportunities.
- The market research is offered along with information related to key drivers, restraints, and opportunities.
- Porter's five forces analysis highlights the potency of buyers and suppliers to enable stakeholders make profit-oriented business decisions and strengthen their supplier-buyer network.
- In-depth analysis of the biological safety cabinets market segmentation assists to determine the prevailing market opportunities.
- Major countries in each region are mapped according to their revenue contribution to the global market.
- Market player positioning facilitates benchmarking and provides a clear understanding of the present position of the market players.
Apart from the points mentioned above, the report includes the analysis of the regional as well as global biological safety cabinets market trends, key players, market segments, application areas, and market growth strategies.
Biological Safety Cabinet Market Report Highlights
| Aspects | Details |
| Market Size By 2033 | USD 382.2 Million |
| Growth Rate | CAGR of 6.7% |
| Forecast period | 2024 - 2033 |
| Report Pages | 300 |
| By Product |
|
| By End Use |
|
| By Region |
|
| Key Market Players | Air Science USA LLC, Cruma S.A., NuAire, Thermo Fisher Scientific, Inc., Germfree Laboratories, Inc., The Baker Company, Inc., Haier Biomedical (Qingdao Biomedical Co., Ltd.), Jinan Biobase Biotech Co. Ltd., AZBIL TELSTAR, S.L.U., Labconco Corp. |
Advancements in technology, such as the integration of intuitive touchscreen displays and energy-efficient LED lighting, enhance user convenience and is projected to drive adoption of biological safety cabinet in the upcoming years.
The pharmaceutical & biopharmaceutical companies sub-segment is expected to hold a dominant position during the forecast period.
North America is predicted to be the dominant region in biological safety cabinet market.
The global biological safety cabinet market was valued at $202.5 million in 2023 and is estimated to reach $382.4 million by 2033.
The major players operating in the biological safety cabinet market include Labconco Corp., Thermo Fisher Scientific, Inc., The Baker Company, Inc., NuAire, Inc., Jinan Biobase Biotech Co. Ltd., AZBIL TELSTAR, S.L.U., Air Science USA LLC, Germfree Laboratories, Inc., Haier Biomedical (Qingdao Biomedical Co., Ltd.), Cruma S.A., Esco Micro, and others.
Loading Table Of Content...

