0
2022
Biopesticides Market

Biopesticides Market

by Product Type (Microbial, Predators, Others), by Formulation (Dry Form, Liquid Form), by Crop Type (Orchards, Grazing And Dry Land, Field Crops), : Global Opportunity Analysis and Industry Forecast, 2020-2031

✷  Report Code: A00435
Mar 2022 | Pages: 290
Tables: 97
Charts: 56
  • Formats*:

  • pdf

    Single User License, Five User
    License & Enterprise User License

  • xls

    Data Pack Excel License

  • ppt

    It comes with the additional cost
    of $2500.00 contact sales.


Biopesticides Market Research, 2031

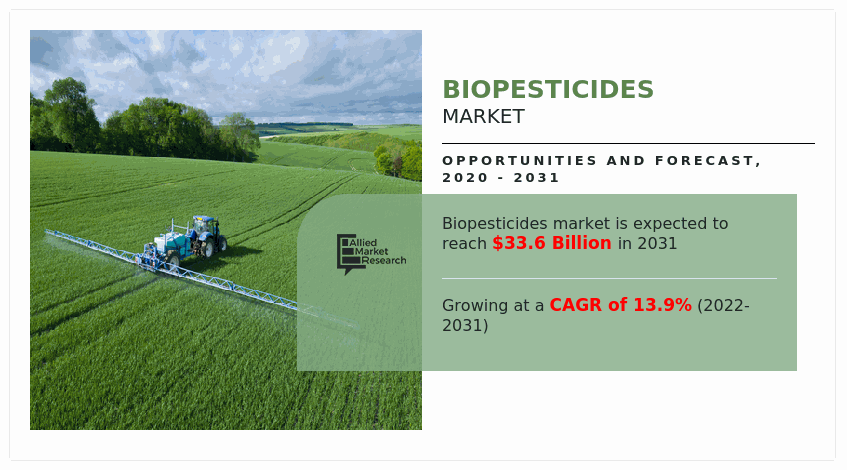
The global biopesticides market was valued at $7,012.70 million in 2020, and is projected to reach $33,638.90 million by 2031, growing at a CAGR of 13.9% from 2022 to 2031.

COVID-19 pandemic disrupted the food & beverage industry all across the globe. COVID-19 resulted in labor mobility restrictions, closure of production facilities, and decline in demand for products, which hindered the market growth. In addition, this sector faced acute labor shortages as a result of recurrent lockdowns that disrupted manufacturing and trade operations. A drop in revenue in the first few months of 2020 along with decrease in farmer demand for biopesticides has put pressure on the profitability of biopesticide producers and suppliers. The vaccination drive and lockdown practices to limit the spread of the virus globally are anticipated to aid in the biopesticides market growth. This is regaining its position in the agriculture and agri products sector.

Biopesticides are essential microbial toxins that can be defined as a biological poison derived from a microorganism, such as a bacterium or a fungus. Pathogenesis by microbial entomopathogens occurs by the invasion of the pathogen through the gut of the insect followed by its multiplication, resulting in the death of the insect.

The biopesticides market is segmented on the basis of product type, formulation, crop type, and region. Depending on product type, it is classified into microbial, predators, and others. According to formulation, it is divided intodry form and liquid form. As per the corn type, the market is classified into orchards, grazing & dry land, and field crops. Region wise, the market is analyzed across North America (the U.S., Canada, and Mexico), Europe (Germany, the UK, France, Italy, Russia Federation, Spain, and rest of Europe), Asia-Pacific (China, Japan, India, Australia, South Korea, and rest of Asia-Pacific), and LAMEA (Brazil, Argentina, South Africa, and rest of LAMEA).
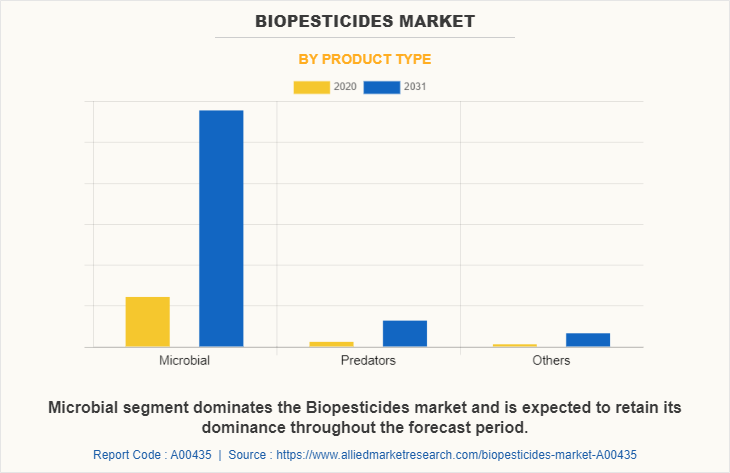
According to biopesticides market analysis, on the basis of product type, the microbial segment dominated the global biopesticides industry in 2021 and is expected to be dominant during the forecast period. The microbial segment is expected to grow with a CAGR of 13.8%. Microbial biopesticides have gained popularity that has increased substantially in recent years, as extensive usage of the types of microbial biopesticides has enhanced the crop quality and helped to save from foreign attack of bacteria, fungus, and other contaminants. The extensive usage is expected to fuel the growth of the global biopesticides market size.
Biopesticides Market

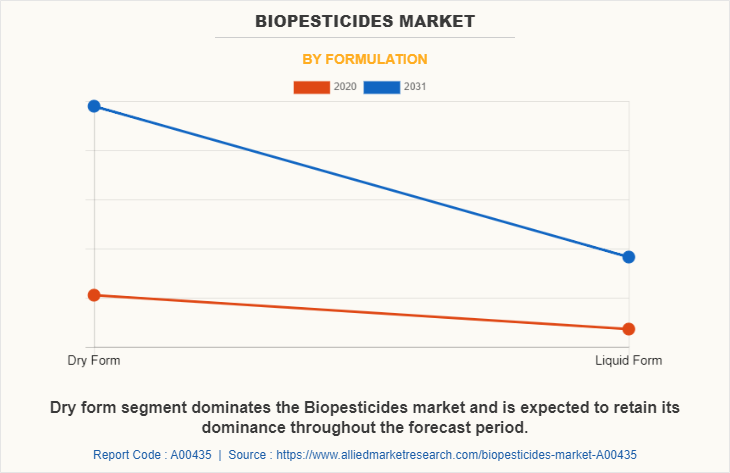
According to formulation, the dry form segment dominates the global market in 2021. Dry form of biopesticides is the most common form available in the market. The dry form is useful to users since it lasts for several uses. Dry biopesticides can be applied directly to crops or blended in a solution and applied using a spray. The dual application of dry biopesticides has grown in favor among users.
Biopesticides Market

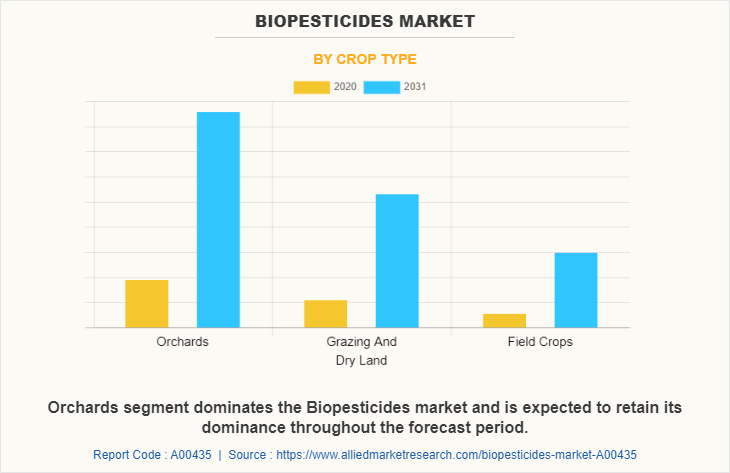
According to biopesticides market trends, as per crop type, the orchard segment was the segment in which the biopesticides are used abundantly for protecting the crops from foreign contaminants. Orchards are the crops that are most vulnerable to spoilage by pest and insects. As a result, the use of biopesticides on orchards is more than the use of biopesticides on other types of crops. The emerging economies such as India and China have witnessed significant adoption of orchard farming, owing to increased use of biopesticides.

Biopesticides Market

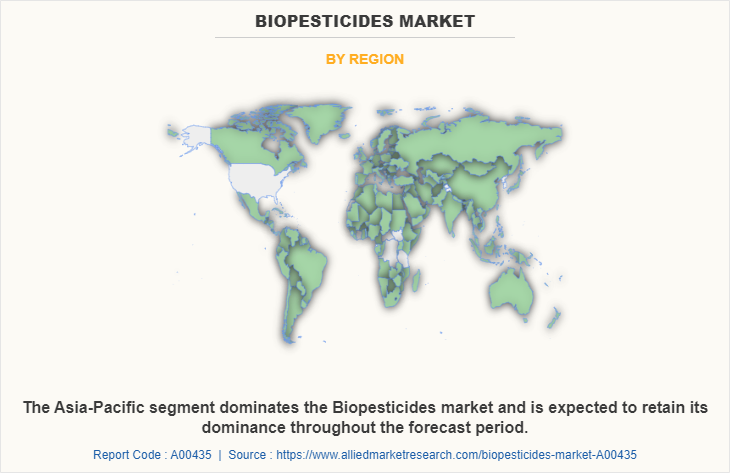
Region wise, Asia-Pacific dominated the global market in 2021, and is expected to be dominant during the biopesticides market forecast period. The dominance in the market is largely due to existence of agricultural operations in Asia-Pacific and the availability of several variants of microbial and predator biopesticides for different pest, insects, and contaminants that are preferred by users for safeguarding their crops. Increase in demand for biopesticides in the agricultural sector of Asia-Pacific drives the demand for biopesticides products.

Biopesticides Market

The players operating in the global biopesticides market have adopted various developmental strategies to expand their biopesticides market share, increase profitability, and remain competitive in the market. The key players profiled in this report include AgBioChem, Inc., AgBiTech Pty Ltd., Ajay Bio-Tech Ltd., Amit Biotech Pvt. Ltd., Andermatt Biocontrol AG, Arizona Biological Control, Inc., BASF SE, Bayer AG, Kemin Industries, and Novozymes A/S.

Key Benefits For Stakeholders

  • This report provides a quantitative analysis of the market segments, current trends, estimations, and dynamics of the biopesticides market analysis from 2020 to 2031 to identify the prevailing biopesticides market opportunities.
  • The market research is offered along with information related to key drivers, restraints, and opportunities.
  • Porter's five forces analysis highlights the potency of buyers and suppliers to enable stakeholders make profit-oriented business decisions and strengthen their supplier-buyer network.
  • In-depth analysis of the biopesticides market segmentation assists to determine the prevailing market opportunities.
  • Major countries in each region are mapped according to their revenue contribution to the global market.
  • Market player positioning facilitates benchmarking and provides a clear understanding of the present position of the market players.
  • The report includes the analysis of the regional as well as global biopesticides market trends, key players, market segments, application areas, and market growth strategies.

Biopesticides Market Report Highlights

Aspects Details
By Product Type
  • Microbial
  • Predators
  • Others
By Formulation
  • Dry Form
  • Liquid Form
By Crop Type
  • Orchards
  • Grazing And Dry Land
  • Field Crops
By Region
  • North America  (U.S., Canada, Mexico)
  • Europe  (Germany, U.K., France, Italy, Russian Federation, Spain, Rest of Europe)
  • Asia-Pacific  (China, India, Japan, Australia, South Korea, Rest of Asia-Pacific)
  • LAMEA  (Brazil, Argentina, South Africa, Rest of LAMEA)
Key Market Players Amit Biotech Pvt. Ltd., Bayer AG, AgBiTech Pty Ltd., AgBioChem, Inc., Novozymes A/S, Andermatt Biocontrol AG, kemin industries, Ajay Bio-Tech Ltd., Arizona Biological Control, Inc., BASF SE
 
  • CHAPTER 1:INTRODUCTION

    • 1.1.Report description

    • 1.2.Key market segments

    • 1.3.Key benefits to the stakeholders

    • 1.4.Research Methodology

      • 1.4.1.Secondary research

      • 1.4.2.Primary research

      • 1.4.3.Analyst tools and models

  • CHAPTER 2:EXECUTIVE SUMMARY

    • 2.1.Key findings of the study

    • 2.2.CXO Perspective

  • CHAPTER 3:MARKET OVERVIEW

    • 3.1.Market definition and scope

    • 3.2.Key findings

      • 3.2.1.Top investment pockets

    • 3.3.Porter’s five forces analysis

    • 3.4.Top player positioning

    • 3.5.Market dynamics

      • 3.5.1.Drivers

      • 3.5.2.Restraints

      • 3.5.3.Opportunities

    • 3.6.COVID-19 Impact Analysis on the market

    • 3.7.Pricing Analysis

    • 3.8.Market volume and forecast

  • CHAPTER 4: BIOPESTICIDES MARKET, BY PRODUCT TYPE

    • 4.1 Overview

      • 4.1.1 Market size and forecast

    • 4.2 Microbial

      • 4.2.1 Key market trends, growth factors and opportunities

      • 4.2.2 Market size and forecast, by region

      • 4.2.3 Market analysis by country

    • 4.3 Predators

      • 4.3.1 Key market trends, growth factors and opportunities

      • 4.3.2 Market size and forecast, by region

      • 4.3.3 Market analysis by country

    • 4.4 Others

      • 4.4.1 Key market trends, growth factors and opportunities

      • 4.4.2 Market size and forecast, by region

      • 4.4.3 Market analysis by country

  • CHAPTER 5: BIOPESTICIDES MARKET, BY FORMULATION

    • 5.1 Overview

      • 5.1.1 Market size and forecast

    • 5.2 Dry Form

      • 5.2.1 Key market trends, growth factors and opportunities

      • 5.2.2 Market size and forecast, by region

      • 5.2.3 Market analysis by country

    • 5.3 Liquid Form

      • 5.3.1 Key market trends, growth factors and opportunities

      • 5.3.2 Market size and forecast, by region

      • 5.3.3 Market analysis by country

  • CHAPTER 6: BIOPESTICIDES MARKET, BY CROP TYPE

    • 6.1 Overview

      • 6.1.1 Market size and forecast

    • 6.2 Orchards

      • 6.2.1 Key market trends, growth factors and opportunities

      • 6.2.2 Market size and forecast, by region

      • 6.2.3 Market analysis by country

    • 6.3 Grazing And Dry Land

      • 6.3.1 Key market trends, growth factors and opportunities

      • 6.3.2 Market size and forecast, by region

      • 6.3.3 Market analysis by country

    • 6.4 Field Crops

      • 6.4.1 Key market trends, growth factors and opportunities

      • 6.4.2 Market size and forecast, by region

      • 6.4.3 Market analysis by country

  • CHAPTER 7: BIOPESTICIDES MARKET, BY REGION

    • 7.1 Overview

      • 7.1.1 Market size and forecast

    • 7.2 North America

      • 7.2.1 Key trends and opportunities

      • 7.2.2 North America Market size & forecast, by Product Type

      • 7.2.3 North America Market size & forecast, by Formulation

      • 7.2.4 North America Market size & forecast, by Crop Type

      • 7.2.5 North America Market size & forecast, by country

        • 7.2.5.1 U.S.
          • 7.2.5.1.1 Market size & forecast, by Product Type
          • 7.2.5.1.2 Market size & forecast, by Formulation
          • 7.2.5.1.3 Market size & forecast, by Crop Type
        • 7.2.5.2 Canada
          • 7.2.5.2.1 Market size & forecast, by Product Type
          • 7.2.5.2.2 Market size & forecast, by Formulation
          • 7.2.5.2.3 Market size & forecast, by Crop Type
        • 7.2.5.3 Mexico
          • 7.2.5.3.1 Market size & forecast, by Product Type
          • 7.2.5.3.2 Market size & forecast, by Formulation
          • 7.2.5.3.3 Market size & forecast, by Crop Type
    • 7.3 Europe

      • 7.3.1 Key trends and opportunities

      • 7.3.2 Europe Market size & forecast, by Product Type

      • 7.3.3 Europe Market size & forecast, by Formulation

      • 7.3.4 Europe Market size & forecast, by Crop Type

      • 7.3.5 Europe Market size & forecast, by country

        • 7.3.5.1 Germany
          • 7.3.5.1.1 Market size & forecast, by Product Type
          • 7.3.5.1.2 Market size & forecast, by Formulation
          • 7.3.5.1.3 Market size & forecast, by Crop Type
        • 7.3.5.2 U.K.
          • 7.3.5.2.1 Market size & forecast, by Product Type
          • 7.3.5.2.2 Market size & forecast, by Formulation
          • 7.3.5.2.3 Market size & forecast, by Crop Type
        • 7.3.5.3 France
          • 7.3.5.3.1 Market size & forecast, by Product Type
          • 7.3.5.3.2 Market size & forecast, by Formulation
          • 7.3.5.3.3 Market size & forecast, by Crop Type
        • 7.3.5.4 Italy
          • 7.3.5.4.1 Market size & forecast, by Product Type
          • 7.3.5.4.2 Market size & forecast, by Formulation
          • 7.3.5.4.3 Market size & forecast, by Crop Type
        • 7.3.5.5 Russian Federation
          • 7.3.5.5.1 Market size & forecast, by Product Type
          • 7.3.5.5.2 Market size & forecast, by Formulation
          • 7.3.5.5.3 Market size & forecast, by Crop Type
        • 7.3.5.6 Spain
          • 7.3.5.6.1 Market size & forecast, by Product Type
          • 7.3.5.6.2 Market size & forecast, by Formulation
          • 7.3.5.6.3 Market size & forecast, by Crop Type
        • 7.3.5.7 Rest of Europe
          • 7.3.5.7.1 Market size & forecast, by Product Type
          • 7.3.5.7.2 Market size & forecast, by Formulation
          • 7.3.5.7.3 Market size & forecast, by Crop Type
    • 7.4 Asia-Pacific

      • 7.4.1 Key trends and opportunities

      • 7.4.2 Asia-Pacific Market size & forecast, by Product Type

      • 7.4.3 Asia-Pacific Market size & forecast, by Formulation

      • 7.4.4 Asia-Pacific Market size & forecast, by Crop Type

      • 7.4.5 Asia-Pacific Market size & forecast, by country

        • 7.4.5.1 China
          • 7.4.5.1.1 Market size & forecast, by Product Type
          • 7.4.5.1.2 Market size & forecast, by Formulation
          • 7.4.5.1.3 Market size & forecast, by Crop Type
        • 7.4.5.2 India
          • 7.4.5.2.1 Market size & forecast, by Product Type
          • 7.4.5.2.2 Market size & forecast, by Formulation
          • 7.4.5.2.3 Market size & forecast, by Crop Type
        • 7.4.5.3 Japan
          • 7.4.5.3.1 Market size & forecast, by Product Type
          • 7.4.5.3.2 Market size & forecast, by Formulation
          • 7.4.5.3.3 Market size & forecast, by Crop Type
        • 7.4.5.4 Australia
          • 7.4.5.4.1 Market size & forecast, by Product Type
          • 7.4.5.4.2 Market size & forecast, by Formulation
          • 7.4.5.4.3 Market size & forecast, by Crop Type
        • 7.4.5.5 South Korea
          • 7.4.5.5.1 Market size & forecast, by Product Type
          • 7.4.5.5.2 Market size & forecast, by Formulation
          • 7.4.5.5.3 Market size & forecast, by Crop Type
        • 7.4.5.6 Rest of Asia-Pacific
          • 7.4.5.6.1 Market size & forecast, by Product Type
          • 7.4.5.6.2 Market size & forecast, by Formulation
          • 7.4.5.6.3 Market size & forecast, by Crop Type
    • 7.5 LAMEA

      • 7.5.1 Key trends and opportunities

      • 7.5.2 LAMEA Market size & forecast, by Product Type

      • 7.5.3 LAMEA Market size & forecast, by Formulation

      • 7.5.4 LAMEA Market size & forecast, by Crop Type

      • 7.5.5 LAMEA Market size & forecast, by country

        • 7.5.5.1 Brazil
          • 7.5.5.1.1 Market size & forecast, by Product Type
          • 7.5.5.1.2 Market size & forecast, by Formulation
          • 7.5.5.1.3 Market size & forecast, by Crop Type
        • 7.5.5.2 Argentina
          • 7.5.5.2.1 Market size & forecast, by Product Type
          • 7.5.5.2.2 Market size & forecast, by Formulation
          • 7.5.5.2.3 Market size & forecast, by Crop Type
        • 7.5.5.3 South Africa
          • 7.5.5.3.1 Market size & forecast, by Product Type
          • 7.5.5.3.2 Market size & forecast, by Formulation
          • 7.5.5.3.3 Market size & forecast, by Crop Type
        • 7.5.5.4 Rest of LAMEA
          • 7.5.5.4.1 Market size & forecast, by Product Type
          • 7.5.5.4.2 Market size & forecast, by Formulation
          • 7.5.5.4.3 Market size & forecast, by Crop Type
  • CHAPTER 8: COMPANY LANDSCAPE

    • 8.1. Top winning strategies

    • 8.2. Product Mapping of Top 10 Player

    • 8.3. Competitive Dashboard

    • 8.4. Competitive Heatmap

    • 8.5 Key developments

      • 8.5.1. Acquisition

      • 8.5.2. Business Expansion

      • 8.5.3. Agreement

      • 8.5.4. Partnership

      • 8.5.5. Product Launch

  • CHAPTER 9: COMPANY PROFILES

    • 9.1 AgBioChem, Inc.

      • 9.1.1 Company overview

      • 9.1.2 Company snapshot

      • 9.1.3 Operating business segments

      • 9.1.4 Product portfolio

      • 9.1.5 Business performance

      • 9.1.6 Key strategic moves and developments

    • 9.2 AgBiTech Pty Ltd.

      • 9.2.1 Company overview

      • 9.2.2 Company snapshot

      • 9.2.3 Operating business segments

      • 9.2.4 Product portfolio

      • 9.2.5 Business performance

      • 9.2.6 Key strategic moves and developments

    • 9.3 Ajay Bio-Tech Ltd.

      • 9.3.1 Company overview

      • 9.3.2 Company snapshot

      • 9.3.3 Operating business segments

      • 9.3.4 Product portfolio

      • 9.3.5 Business performance

      • 9.3.6 Key strategic moves and developments

    • 9.4 Amit Biotech Pvt. Ltd.

      • 9.4.1 Company overview

      • 9.4.2 Company snapshot

      • 9.4.3 Operating business segments

      • 9.4.4 Product portfolio

      • 9.4.5 Business performance

      • 9.4.6 Key strategic moves and developments

    • 9.5 Andermatt Biocontrol AG

      • 9.5.1 Company overview

      • 9.5.2 Company snapshot

      • 9.5.3 Operating business segments

      • 9.5.4 Product portfolio

      • 9.5.5 Business performance

      • 9.5.6 Key strategic moves and developments

    • 9.6 Arizona Biological Control, Inc.

      • 9.6.1 Company overview

      • 9.6.2 Company snapshot

      • 9.6.3 Operating business segments

      • 9.6.4 Product portfolio

      • 9.6.5 Business performance

      • 9.6.6 Key strategic moves and developments

    • 9.7 BASF SE

      • 9.7.1 Company overview

      • 9.7.2 Company snapshot

      • 9.7.3 Operating business segments

      • 9.7.4 Product portfolio

      • 9.7.5 Business performance

      • 9.7.6 Key strategic moves and developments

    • 9.8 Bayer AG

      • 9.8.1 Company overview

      • 9.8.2 Company snapshot

      • 9.8.3 Operating business segments

      • 9.8.4 Product portfolio

      • 9.8.5 Business performance

      • 9.8.6 Key strategic moves and developments

    • 9.9 kemin industries

      • 9.9.1 Company overview

      • 9.9.2 Company snapshot

      • 9.9.3 Operating business segments

      • 9.9.4 Product portfolio

      • 9.9.5 Business performance

      • 9.9.6 Key strategic moves and developments

    • 9.10 Novozymes A/S

      • 9.10.1 Company overview

      • 9.10.2 Company snapshot

      • 9.10.3 Operating business segments

      • 9.10.4 Product portfolio

      • 9.10.5 Business performance

      • 9.10.6 Key strategic moves and developments

  • LIST OF TABLES

    • TABLE 1. GLOBAL BIOPESTICIDES MARKET, BY PRODUCT TYPE, 2020-2031,($MILLION)
    • TABLE 2. BIOPESTICIDES MARKET REVENUE, FOR MICROBIAL, BY REGION , 2020-2031,($MILLION)
    • TABLE 3. BIOPESTICIDES MARKET MICROBIAL BY COUNTRY, 2020-2031,($MILLION)
    • TABLE 4. BIOPESTICIDES MARKET REVENUE, FOR PREDATORS, BY REGION , 2020-2031,($MILLION)
    • TABLE 5. BIOPESTICIDES MARKET PREDATORS BY COUNTRY, 2020-2031,($MILLION)
    • TABLE 6. BIOPESTICIDES MARKET REVENUE, FOR OTHERS, BY REGION , 2020-2031,($MILLION)
    • TABLE 7. BIOPESTICIDES MARKET OTHERS BY COUNTRY, 2020-2031,($MILLION)
    • TABLE 8. GLOBAL BIOPESTICIDES MARKET, BY FORMULATION, 2020-2031,($MILLION)
    • TABLE 9. BIOPESTICIDES MARKET REVENUE, FOR DRY FORM, BY REGION , 2020-2031,($MILLION)
    • TABLE 10. BIOPESTICIDES MARKET DRY FORM BY COUNTRY, 2020-2031,($MILLION)
    • TABLE 11. BIOPESTICIDES MARKET REVENUE, FOR LIQUID FORM, BY REGION , 2020-2031,($MILLION)
    • TABLE 12. BIOPESTICIDES MARKET LIQUID FORM BY COUNTRY, 2020-2031,($MILLION)
    • TABLE 13. GLOBAL BIOPESTICIDES MARKET, BY CROP TYPE, 2020-2031,($MILLION)
    • TABLE 14. BIOPESTICIDES MARKET REVENUE, FOR ORCHARDS, BY REGION , 2020-2031,($MILLION)
    • TABLE 15. BIOPESTICIDES MARKET ORCHARDS BY COUNTRY, 2020-2031,($MILLION)
    • TABLE 16. BIOPESTICIDES MARKET REVENUE, FOR GRAZING AND DRY LAND, BY REGION , 2020-2031,($MILLION)
    • TABLE 17. BIOPESTICIDES MARKET GRAZING AND DRY LAND BY COUNTRY, 2020-2031,($MILLION)
    • TABLE 18. BIOPESTICIDES MARKET REVENUE, FOR FIELD CROPS, BY REGION , 2020-2031,($MILLION)
    • TABLE 19. BIOPESTICIDES MARKET FIELD CROPS BY COUNTRY, 2020-2031,($MILLION)
    • TABLE 20. BIOPESTICIDES MARKET, BY REGION, 2020-2031,($MILLION)
    • TABLE 21. NORTH AMERICA BIOPESTICIDES MARKET, BY PRODUCT TYPE, 2020-2031,($MILLION)
    • TABLE 22. NORTH AMERICA BIOPESTICIDES MARKET, BY FORMULATION, 2020-2031,($MILLION)
    • TABLE 23. NORTH AMERICA BIOPESTICIDES MARKET, BY CROP TYPE, 2020-2031,($MILLION)
    • TABLE 24. NORTH AMERICA BIOPESTICIDES MARKET, BY COUNTRY, 2020-2031,($MILLION)
    • TABLE 25. U.S. BIOPESTICIDES MARKET BY PRODUCT TYPE 2020-2031,($MILLION)
    • TABLE 26. U.S. BIOPESTICIDES MARKET BY FORMULATION 2020-2031,($MILLION)
    • TABLE 27. U.S. BIOPESTICIDES MARKET BY CROP TYPE 2020-2031,($MILLION)
    • TABLE 28. CANADA BIOPESTICIDES MARKET BY PRODUCT TYPE 2020-2031,($MILLION)
    • TABLE 29. CANADA BIOPESTICIDES MARKET BY FORMULATION 2020-2031,($MILLION)
    • TABLE 30. CANADA BIOPESTICIDES MARKET BY CROP TYPE 2020-2031,($MILLION)
    • TABLE 31. MEXICO BIOPESTICIDES MARKET BY PRODUCT TYPE 2020-2031,($MILLION)
    • TABLE 32. MEXICO BIOPESTICIDES MARKET BY FORMULATION 2020-2031,($MILLION)
    • TABLE 33. MEXICO BIOPESTICIDES MARKET BY CROP TYPE 2020-2031,($MILLION)
    • TABLE 34. EUROPE BIOPESTICIDES MARKET, BY PRODUCT TYPE, 2020-2031,($MILLION)
    • TABLE 35. EUROPE BIOPESTICIDES MARKET, BY FORMULATION, 2020-2031,($MILLION)
    • TABLE 36. EUROPE BIOPESTICIDES MARKET, BY CROP TYPE, 2020-2031,($MILLION)
    • TABLE 37. EUROPE BIOPESTICIDES MARKET, BY COUNTRY, 2020-2031,($MILLION)
    • TABLE 38. GERMANY BIOPESTICIDES MARKET BY PRODUCT TYPE 2020-2031,($MILLION)
    • TABLE 39. GERMANY BIOPESTICIDES MARKET BY FORMULATION 2020-2031,($MILLION)
    • TABLE 40. GERMANY BIOPESTICIDES MARKET BY CROP TYPE 2020-2031,($MILLION)
    • TABLE 41. U.K. BIOPESTICIDES MARKET BY PRODUCT TYPE 2020-2031,($MILLION)
    • TABLE 42. U.K. BIOPESTICIDES MARKET BY FORMULATION 2020-2031,($MILLION)
    • TABLE 43. U.K. BIOPESTICIDES MARKET BY CROP TYPE 2020-2031,($MILLION)
    • TABLE 44. FRANCE BIOPESTICIDES MARKET BY PRODUCT TYPE 2020-2031,($MILLION)
    • TABLE 45. FRANCE BIOPESTICIDES MARKET BY FORMULATION 2020-2031,($MILLION)
    • TABLE 46. FRANCE BIOPESTICIDES MARKET BY CROP TYPE 2020-2031,($MILLION)
    • TABLE 47. ITALY BIOPESTICIDES MARKET BY PRODUCT TYPE 2020-2031,($MILLION)
    • TABLE 48. ITALY BIOPESTICIDES MARKET BY FORMULATION 2020-2031,($MILLION)
    • TABLE 49. ITALY BIOPESTICIDES MARKET BY CROP TYPE 2020-2031,($MILLION)
    • TABLE 50. RUSSIAN FEDERATION BIOPESTICIDES MARKET BY PRODUCT TYPE 2020-2031,($MILLION)
    • TABLE 51. RUSSIAN FEDERATION BIOPESTICIDES MARKET BY FORMULATION 2020-2031,($MILLION)
    • TABLE 52. RUSSIAN FEDERATION BIOPESTICIDES MARKET BY CROP TYPE 2020-2031,($MILLION)
    • TABLE 53. SPAIN BIOPESTICIDES MARKET BY PRODUCT TYPE 2020-2031,($MILLION)
    • TABLE 54. SPAIN BIOPESTICIDES MARKET BY FORMULATION 2020-2031,($MILLION)
    • TABLE 55. SPAIN BIOPESTICIDES MARKET BY CROP TYPE 2020-2031,($MILLION)
    • TABLE 56. REST OF EUROPE BIOPESTICIDES MARKET BY PRODUCT TYPE 2020-2031,($MILLION)
    • TABLE 57. REST OF EUROPE BIOPESTICIDES MARKET BY FORMULATION 2020-2031,($MILLION)
    • TABLE 58. REST OF EUROPE BIOPESTICIDES MARKET BY CROP TYPE 2020-2031,($MILLION)
    • TABLE 59. ASIA-PACIFIC BIOPESTICIDES MARKET, BY PRODUCT TYPE, 2020-2031,($MILLION)
    • TABLE 60. ASIA-PACIFIC BIOPESTICIDES MARKET, BY FORMULATION, 2020-2031,($MILLION)
    • TABLE 61. ASIA-PACIFIC BIOPESTICIDES MARKET, BY CROP TYPE, 2020-2031,($MILLION)
    • TABLE 62. ASIA-PACIFIC BIOPESTICIDES MARKET, BY COUNTRY, 2020-2031,($MILLION)
    • TABLE 63. CHINA BIOPESTICIDES MARKET BY PRODUCT TYPE 2020-2031,($MILLION)
    • TABLE 64. CHINA BIOPESTICIDES MARKET BY FORMULATION 2020-2031,($MILLION)
    • TABLE 65. CHINA BIOPESTICIDES MARKET BY CROP TYPE 2020-2031,($MILLION)
    • TABLE 66. INDIA BIOPESTICIDES MARKET BY PRODUCT TYPE 2020-2031,($MILLION)
    • TABLE 67. INDIA BIOPESTICIDES MARKET BY FORMULATION 2020-2031,($MILLION)
    • TABLE 68. INDIA BIOPESTICIDES MARKET BY CROP TYPE 2020-2031,($MILLION)
    • TABLE 69. JAPAN BIOPESTICIDES MARKET BY PRODUCT TYPE 2020-2031,($MILLION)
    • TABLE 70. JAPAN BIOPESTICIDES MARKET BY FORMULATION 2020-2031,($MILLION)
    • TABLE 71. JAPAN BIOPESTICIDES MARKET BY CROP TYPE 2020-2031,($MILLION)
    • TABLE 72. AUSTRALIA BIOPESTICIDES MARKET BY PRODUCT TYPE 2020-2031,($MILLION)
    • TABLE 73. AUSTRALIA BIOPESTICIDES MARKET BY FORMULATION 2020-2031,($MILLION)
    • TABLE 74. AUSTRALIA BIOPESTICIDES MARKET BY CROP TYPE 2020-2031,($MILLION)
    • TABLE 75. SOUTH KOREA BIOPESTICIDES MARKET BY PRODUCT TYPE 2020-2031,($MILLION)
    • TABLE 76. SOUTH KOREA BIOPESTICIDES MARKET BY FORMULATION 2020-2031,($MILLION)
    • TABLE 77. SOUTH KOREA BIOPESTICIDES MARKET BY CROP TYPE 2020-2031,($MILLION)
    • TABLE 78. REST OF ASIA-PACIFIC BIOPESTICIDES MARKET BY PRODUCT TYPE 2020-2031,($MILLION)
    • TABLE 79. REST OF ASIA-PACIFIC BIOPESTICIDES MARKET BY FORMULATION 2020-2031,($MILLION)
    • TABLE 80. REST OF ASIA-PACIFIC BIOPESTICIDES MARKET BY CROP TYPE 2020-2031,($MILLION)
    • TABLE 81. LAMEA BIOPESTICIDES MARKET, BY PRODUCT TYPE, 2020-2031,($MILLION)
    • TABLE 82. LAMEA BIOPESTICIDES MARKET, BY FORMULATION, 2020-2031,($MILLION)
    • TABLE 83. LAMEA BIOPESTICIDES MARKET, BY CROP TYPE, 2020-2031,($MILLION)
    • TABLE 84. LAMEA BIOPESTICIDES MARKET, BY COUNTRY, 2020-2031,($MILLION)
    • TABLE 85. BRAZIL BIOPESTICIDES MARKET BY PRODUCT TYPE 2020-2031,($MILLION)
    • TABLE 86. BRAZIL BIOPESTICIDES MARKET BY FORMULATION 2020-2031,($MILLION)
    • TABLE 87. BRAZIL BIOPESTICIDES MARKET BY CROP TYPE 2020-2031,($MILLION)
    • TABLE 88. ARGENTINA BIOPESTICIDES MARKET BY PRODUCT TYPE 2020-2031,($MILLION)
    • TABLE 89. ARGENTINA BIOPESTICIDES MARKET BY FORMULATION 2020-2031,($MILLION)
    • TABLE 90. ARGENTINA BIOPESTICIDES MARKET BY CROP TYPE 2020-2031,($MILLION)
    • TABLE 91. SOUTH AFRICA BIOPESTICIDES MARKET BY PRODUCT TYPE 2020-2031,($MILLION)
    • TABLE 92. SOUTH AFRICA BIOPESTICIDES MARKET BY FORMULATION 2020-2031,($MILLION)
    • TABLE 93. SOUTH AFRICA BIOPESTICIDES MARKET BY CROP TYPE 2020-2031,($MILLION)
    • TABLE 94. REST OF LAMEA BIOPESTICIDES MARKET BY PRODUCT TYPE 2020-2031,($MILLION)
    • TABLE 95. REST OF LAMEA BIOPESTICIDES MARKET BY FORMULATION 2020-2031,($MILLION)
    • TABLE 96. REST OF LAMEA BIOPESTICIDES MARKET BY CROP TYPE 2020-2031,($MILLION)
  • LIST OF FIGURES

  • FIGURE 1. GLOBAL BIOPESTICIDES MARKET SEGMENTATION
    FIGURE 2. GLOBAL BIOPESTICIDES MARKET
    FIGURE 3. SEGMENTATION BIOPESTICIDES MARKET
    FIGURE 4. TOP INVESTMENT POCKET IN BIOPESTICIDES MARKET
    FIGURE 5. TOP WINNING STRATEGIES, 2019-2021*
    FIGURE 6. TOP WINNING STRATEGIES, BY DEVELOPMENT, 2019-2021(%)
    FIGURE 7. TOP WINNING STRATEGIES, BY COMPANY, 2019-2021*
    FIGURE 8. MODERATE BARGAINING POWER OF BUYERS
    FIGURE 9. MODERATE BARGAINING POWER OF SUPPLIERS
    FIGURE 10. MODERATE THREAT OF NEW ENTRANTS
    FIGURE 11. LOW THREAT OF SUBSTITUTION
    FIGURE 12. HIGH COMPETITIVE RIVALRY
    FIGURE 13. TOP PLAYER POSITIONING, 2020
    FIGURE 14. MARKET SHARE ANALYSIS, 2020
    FIGURE 15. RESTRAINTS AND DRIVERS: BIOPESTICIDES MARKET
    FIGURE 16. BIOPESTICIDES MARKET SEGMENTATION, BY PRODUCT TYPE
    FIGURE 17. BIOPESTICIDES MARKET FOR MICROBIAL, BY COUNTRY, 2020-2031 ($MILLION)
    FIGURE 18. BIOPESTICIDES MARKET FOR PREDATOR, BY COUNTRY, 2020-2031 ($MILLION)
    FIGURE 19. BIOPESTICIDES MARKET FOR OTHERS, BY COUNTRY, 2020-2031 ($MILLION)
    FIGURE 20. BIOPESTICIDES MARKET SEGMENTATION, BY FORMULATION
    FIGURE 21. BIOPESTICIDES MARKET FOR DRY FORM, BY COUNTRY, 2020-2031 ($MILLION)
    FIGURE 22. BIOPESTICIDES MARKET FOR LIQUID FORM, BY COUNTRY, 2020-2031 ($MILLION)
    FIGURE 23. BIOPESTICIDES MARKET SEGMENTATION, BY CROP TYPE
    FIGURE 24. BIOPESTICIDES MARKET FOR ORCHARDS, BY COUNTRY, 2020-2031 ($MILLION)
    FIGURE 25. BIOPESTICIDES MARKET FOR GRAZING AND DRY LAND, BY COUNTRY, 2020-2031 ($MILLION)
    FIGURE 26. BIOPESTICIDES MARKET FOR FIELD CROPS, BY COUNTRY, 2020-2031 ($MILLION)
    FIGURE 27. AGBIOCHEM, INC.: NET SALES, 2018-2020 ($MILLION)
    FIGURE 28. AGBIOCHEM, INC.: REVENUE SHARE, BY SEGMENT, 2020 (%)
    FIGURE 29. AGBIOCHEM, INC.: REVENUE SHARE, BY REGION, 2020 (%)
    FIGURE 30. AGBITECH PTY LTD.: NET SALES, 2018-2020 ($MILLION)
    FIGURE 31. AGBITECH PTY LTD.: REVENUE SHARE, BY SEGMENT, 2020 (%)
    FIGURE 32. AGBITECH PTY LTD.: REVENUE SHARE, BY REGION, 2020 (%)
    FIGURE 33. AJAY BIO-TECH LTD.: NET SALES, 2018-2020 ($MILLION)
    FIGURE 34. AJAY BIO-TECH LTD.: REVENUE SHARE, BY SEGMENT, 2020 (%)
    FIGURE 35. AJAY BIO-TECH LTD.: REVENUE SHARE, BY REGION, 2020 (%)
    FIGURE 36. AMIT BIOTECH PVT. LTD.: NET SALES, 2018-2020 ($MILLION)
    FIGURE 37. AMIT BIOTECH PVT. LTD.: REVENUE SHARE, BY SEGMENT, 2020 (%)
    FIGURE 38. AMIT BIOTECH PVT. LTD.: REVENUE SHARE, BY REGION, 2020 (%)
    FIGURE 39. ANDERMATT BIOCONTROL AG: NET SALES, 2018-2020 ($MILLION)
    FIGURE 40. ANDERMATT BIOCONTROL AG: REVENUE SHARE, BY SEGMENT, 2020 (%)
    FIGURE 41. ANDERMATT BIOCONTROL AG: REVENUE SHARE, BY REGION, 2020 (%)
    FIGURE 42. ARIZONA BIOLOGICAL CONTROL, INC.: NET SALES, 2018-2020 ($MILLION)
    FIGURE 43. ARIZONA BIOLOGICAL CONTROL, INC.: REVENUE SHARE, BY SEGMENT, 2020 (%)
    FIGURE 44. ARIZONA BIOLOGICAL CONTROL, INC.: REVENUE SHARE, BY REGION, 2020 (%)
    FIGURE 45. BASF SE: NET SALES, 2018-2020 ($MILLION)
    FIGURE 46. BASF SE: REVENUE SHARE, BY SEGMENT, 2020 (%)
    FIGURE 47. BASF SE: REVENUE SHARE, BY REGION, 2020 (%)
    FIGURE 48. BAYER AG: NET SALES, 2018-2020 ($MILLION)
    FIGURE 49. BAYER AG: REVENUE SHARE, BY SEGMENT, 2020 (%)
    FIGURE 50. BAYER AG: REVENUE SHARE, BY REGION, 2020 (%)
    FIGURE 51. KEMIN INDUSTRIES: NET SALES, 2018-2020 ($MILLION)
    FIGURE 52. KEMIN INDUSTRIES: REVENUE SHARE, BY SEGMENT, 2020 (%)
    FIGURE 53. KEMIN INDUSTRIES: REVENUE SHARE, BY REGION, 2020 (%)
    FIGURE 54. NOVOZYMES A/S: NET SALES, 2018-2020 ($MILLION)
    FIGURE 55. NOVOZYMES A/S: REVENUE SHARE, BY SEGMENT, 2020 (%)
    FIGURE 56. NOVOZYMES A/S: REVENUE SHARE, BY REGION, 2020 (%)


The biopesticides market is expected to grow at the highest rate, owing to increase in adoption, specifically in emerging countries, such as China, India, Japan, and Korea. Moreover, the production cost of biopesticides is relatively low in Asia-Pacific compared to other regions.

Several advantages that boost the growth of the global biopesticides market during the forecast period are reduced environmental damage, targeted action, the necessity for smaller amounts for effective coverage, and quicker decomposition. Furthermore, the popularity of biopesticides increased substantially in recent years, owing to extensive research. In addition, the techniques for  mass production, storage, transport, and application of biopesticides have improved in recent years and are anticipated to provide lucrative opportunities in the future.

However, factors such as lack of profit from niche market products, for example, bioinsecticides based on baculoviruses, including the Cydia pomonella granulosis virus (CpGV), typically are selective for just one or a few species of insect. These are expected to hamper the market growth.

A recent trend that has gained traction in the global biopesticides market is the growth in public concern over the potential health hazards of synthetic pesticides and the steep increase in the cost of cultivation leading to the exploration of eco-friendly pest management tactics that includes Integrated Pest Management (IPM).

PURCHASE OPTIONS

Call or Email us

U.S.-Canada Toll-free: +1-800-792-5285
Int'l : +1-503-894-6022
Europe : +44-845-528-1300
Email : help@alliedmarketresearch.com
 
FREQUENTLY ASKED QUESTIONS?

A. The global biopesticides market size was valued at $8,737.8 million in 2021, and is estimated to reach $33,638.9 million by 2031, registering a CAGR of 13.9% from 2022 to 2031.

A. The global biopesticides market registered a CAGR of 13.9% from 2022 to 2031.

A. Raise the query and paste the link of the specific report and our sales executive will revert you back with the sample.

A. The forecast period in the biopesticides market report is from 2022 to 2031.

A. The top companies that hold the market share in biopesticides market include Arizona Biological Control, Inc., BASF SE, Bayer AG, Kemin Industries, and Novozymes A/S.

A. The biopesticides market report has 3 segments. The segments are product type, formulation, and crop type.

A. The emerging countries in the biopesticides market is likely to grow at a CAGR of more than 16.5% from 2022 to 2031.

A. Asia-Pacific will dominate the biopesticides market by the end of 2031.

A. Post COVID-19, the ease of lockdown, reopening of state, country, and international borders have solved the problem of labor shortages. On the other hand, consumer demand for crops and grains is growing, which will drive up sales of biopesticides as farming continues to meet demand.

Looking for Customization?

 Customization Request

Have a Question?

 Speak with Analyst

Any Confusion?

 Inquire Before Buying

Have a glance of the Report

  Request Sample
RELATED TAGS

Purchase Full Report of
Biopesticides Market

Start reading instantly.
This Report and over 67,068+ more Reports, Available with Avenue Library. T&C*.

  • Online Only
  • $3,456
  • Online cloud access only
  • Restricted print, copy, paste & download
  • Read only
  • Free industry update
    (Within 180 days)
  • Free report update in next update cycle
    (Mar 2023 - Mar 2024)
  • Data Pack
  • $3,840
  • Restricted to one authorized user
  • One print only
  • Available in
    Excel
  • Free industry update
    (Within 180 days)
  •   Free report update in next update cycle
    (Mar 2023 - Mar 2024)
  • Single User
  • $5,769
  • Restricted to one authorized user
  • One print only
  • Available in
    PDF
  • Free industry update
    (Within 180 days)
  •   Free report update in next update cycle
    (Mar 2023 - Mar 2024)
  • Five Users
  • $6,450
  • Limited to five authorized users
  • Print upto five copies
  • Available in
    PDF
  • Free industry update
    (Within 180 days)
  •   Free report update in next update cycle
    (Mar 2023 - Mar 2024)
  • Enterprise
    License/PDF

  • $10,995
  • Unlimited
    within
    company/enterprise
  • Available in Excel & PDF
  • Free industry update
    (Within 180 days)
  •   Free report update in next update cycle
    (Mar 2023 - Mar 2024)
  • Library
    Membership

  • $999 $ 1,175
    Per User/ Per month/ Billed annually
  • Published Content
    E-access
  • Company Profiles
    E-access
  • Newly Added Content Access
  • 10 PDF
    Downloads
  • 5 Excel Data
    Pack Downloads
  • 250 Company Profiles PDF Downloads
  • Buy Now

*Taxes/Fees, if applicable will be added during checkout. All prices in USD

RELATED REPORTS
 

Why Allied Market Research?


Infallible Methodology

To ensure high-level data integrity, accurate analysis, and impeccable forecasts

Analyst Support

For complete satisfaction

Customization

On-demand customization of scope of the report to exactly meet your needs

TARGETED MARKET VIEW

Targeted market view to provide pertinent information and save time of readers

Get fresh content delivered

Get insights on topics that are crucial for your business. Stay abreast of your interest areas.

Get Industry Data Alerts

Why Allied Market Research?

Infallible Methodology

To ensure high-level data integrity, accurate analysis, and impeccable forecasts

Analyst Support

For complete satisfaction

Customization

On-demand customization of scope of the report to exactly meet your needs

TARGETED MARKET VIEW

Targeted market view to provide pertinent information and save time of readers