
Blast Chillers Market Research, 2033
A blast chiller is a specialized refrigeration unit designed to rapidly reduce the temperature of food products. It is an essential piece of equipment in professional kitchens, catering, and food production industries for quickly cooling or freezing food to ensure safety, maintain quality, and preserve the freshness of the food.
Report Key Highlighters
The blast chiller market has been analyzed across 16 countries. The analysis includes a country-by-country breakdown analysis in terms of value ($million) available from 2024 to 2033.
The research combined high-quality data, professional opinion and research, with significant independent opinion. The research methodology aims to provide a balanced view of the global market, and help stakeholders make educated decisions to achieve ambitious growth objectives.
The research reviewed more than 3,700 product catalogs, annual reports, industry descriptions, and other comparable resources from leading industry players to gain a better understanding of the market.
The blast chiller market share is marginally fragmented, with players such as U-Line Corporation, Alto-Shaam, Inc., ThermoKool, Mercury Systems, Inc., Electrolux Group, Foster Refrigerator, Ali Group, IRINOX S.p.A., GEMM Srl, and Sereva, SA.
Blast chillers play a crucial role in refrigeration as they rapidly cool hot food to temperatures that prevent the growth of bacteria, ensuring food safety and extending its shelf life. The expansion of the foodservice industry and the growing popularity of frozen food products are the main driving forces behind the Blast Chillers Market Growth. The Blast Chillers Market Forecast is provided in this report is from 2023 to 2032. The Blast Chillers Market Overview includes areas such as product type, sales channel, capacity, and application.
The blast chiller market is segmented on the basis of product type, sales channel, capacity, and application, and region. Depending upon the product type, the market is categorized into roll in blast chiller, reach in blast chiller, and undercounter blast chiller. On the basis of sales channel, it is divided into offline, and online. Depending upon the capacity, the market is classified on the basis of below 50kg, 50kg-100kg, 101kg-500kg, and more than 500kg. Furthermore, on the basis of application, it is divided into hotel, restaurant, supermarket, bakery and confectionary, food manufacturers, hospital and clinics, and others. Region wise, it is analyzed across North America (U.S., Canada, and Mexico), Europe (the UK, France, Germany, Italy, Spain, and rest of Europe), Asia-Pacific (China, Japan, India, South Korea, and rest of Asia-Pacific), and LAMEA (Latin America, Middle East, and Africa).
Growth of the cold-storage industry
Blast chillers help reduce food waste by fast cooling newly cooked/baked food, extending its shelf life and keeping it safe for later use. Food waste, particularly perishables such as meat, dairy, fruits, and vegetables, causes significant economic losses for food enterprises. Lack of proper refrigeration and freezing infrastructure has significantly contributed to food waste; thus, retailers are increasingly adopting blast chillers to decrease perishable waste. Supermarkets employ blast chillers to cool meat, prepared meals, and baked products. Reducing waste increases profitability and promotes sustainability, as such encouraging blast chiller use. Blast Chillers Market Size is projected to reach $2,392.8 million from 2023 to 2032.

Growth in food service sector in developed/developing regions creates an opportunity for cold storage chain driving the market growth. The food service sector comprises two major segments, commercial and non-commercial subsectors. The Canada commercial food service sub-sector accounted for $62 billion, representing 82% of total food service sales in 2022, which is likely to have a positive impact on the blast chillers market for commercial usage. Low blast chiller penetration, along with increased consumer awareness of food safety and quality in the North America, Europe, and other regions, creates attractive opportunities to install blast chillers. Companies are creating low-cost blast chillers to target the mass blast chillers Market and local production contributes to reduced prices.

Strict Statutory Requirement
Governments and regulatory bodies globally have introduced strict statutory requirements that are an important driver for the blast chiller market. These regulations mandate particular standards for food safety, storage as well as handling especially in industries such as food processing, catering and hospitality where maintenance of quality and safety of perishable goods is essential. Examples of these regulations include Hazard Analysis and Critical Control Points (HACCP) and the Food Safety Modernization Act (FSMA) in the U.S., as well as similar frameworks in Europe and other regions. These frameworks necessitate that businesses promptly lower the temperature of cooked foods to prevent microbial growth and improve food safety. Blast chillers comply with these demands by their ability to swiftly lower food temperatures, making them vital for compliance as they directly respond to these regulation needs. Thus, Firms must invest in advanced blast chiller technologies to meet these stringent regulations, thus propelling the Blast Chillers Market demand.

In addition, there is a growing focus on food safety and public health globally, thus requiring the need to adhere to such stringent statutory requirements. With rise in awareness on the danger of foodborne illness and contamination, consumers are demanding better standards of safety in food, causing firms to adopt good methods of handling food as well as storing it. This change is more significant in certain areas including healthcare where population are highly vulnerable from such pathogens exist. Blast chillers play a vital role in swiftly cooling food and maintaining precise temperature control, thereby mitigating the risks associated with foodborne pathogens. This aligns with both regulatory mandates and consumer expectations. As a result, the adoption of blast chillers is becoming more widespread, not only as a regulatory compliance measure but also as a proactive approach to enhancing food safety standards. This dual pressure from regulatory bodies and consumer demand reinforces the critical role of blast chillers in modern food safety practices, further driving their market growth. Such factors are expected to drive the growth of blast chillers market and increse significant Blast Chillers Market Share during forecasted period.
Technology advancement in blast chillers
The integration of smart touchscreen controllers in blast chiller machines, enabling users to operate all functions remotely, has significantly advanced the industry and boosted demand within the blast chillers market. The latest models of blast chillers come with smart and automatic defrost functions, which ensure optimal consumption of energy and maximum performance, owing to effective probe settings. The machines are also inbuilt with safety sensors that stop the fan motor in case of any disruption during the chilling or freezing cycles. These latest technologies are attracting an increasing number of prospective customers of blast chillers industry. To upgrade cooling systems of blast chillers there are wide range of installation units available including an Industrial Air Chiller, a Modular Chiller, several Screw Chillers, and Water Chillers, while also considering the benefits of Absorption Chillers and HVAC Chillers for energy efficiency.
For instance, in May 2021, Welbilt, Inc., a major supplier of commercial foodservice equipment, announced its exclusive distribution partnership with Nuovair, an Italian company specializing in high-quality roll-in blast chillers. These chillers incorporate advanced blast freezing technology, extending shelf life by three times, and preserving food quality, ensuring superior taste and texture. Featuring the industry's highest air-flow rate of 9m3/hr, along with an electronic expansion valve, these chillers deliver up to 25% faster cooling, setting a new benchmark in preservation efficiency. The integration of smart technology has enabled remote monitoring and control, allowing chefs and kitchen workers to oversee the chilling process from afar. Energy efficiency has also been a focus, with the development of environmentally friendly refrigerants and insulating materials that assist to achieve sustainability goals for Blast Chillers Market.

Competitive Analysis
Competitive analysis and profiles of the major global blast chiller market players that have been provided in the report include U-Line Corporation, Alto-Shaam, Inc., ThermoKool, Mercury Systems, Inc., Electrolux Group, Foster Refrigerator, Ali Group, IRINOX S.p.A., GEMM Srl, and Sereva, SA.
Key Developments/ Strategies in Blast chiller Market
For instance, in May 2021, Welbilt, Inc., a major supplier of commercial foodservice equipment, announced its exclusive distribution partnership with Nuovair, an Italian company specializing in high-quality roll-in blast chillers.
For instance, in July 2022, Traulsen added additional blast chillers to its Centreline product line, including a new reach-in model. In addition, in September, 2023, Williams Refrigeration unveiled a new version of its reach-in blast chillers and blast chiller/freezers, offering significant improvements over previous models.
For instance, in July 2022, Centerline by Traulsen announced the expansion of its Centerline by Traulsen product offering with new undercounter blast chillers. These chillers are widely used in restaurants, hotels, cafeterias, and catering services. Moreover, the Blue Star undercounter range of chillers and freezers is perfect for storing premixes and preparation materials.
Key Benefits For Stakeholders
- This report provides a quantitative analysis of the market segments, current trends, estimations, and dynamics of the blast chillers market analysis from 2023 to 2033 to identify the prevailing blast chillers market opportunities.
- The market research is offered along with information related to key drivers, restraints, and opportunities.
- Porter's five forces analysis highlights the potency of buyers and suppliers to enable stakeholders make profit-oriented business decisions and strengthen their supplier-buyer network.
- In-depth analysis of the blast chillers market segmentation assists to determine the prevailing market opportunities.
- Major countries in each region are mapped according to their revenue contribution to the global market.
- Market player positioning facilitates benchmarking and provides a clear understanding of the present position of the Blast Chillers Market players.
- The report includes the analysis of the regional as well as global blast chillers market trends, key players, market segments, application areas, and market growth strategies.
Blast Chillers Market Report Highlights
| Aspects | Details |
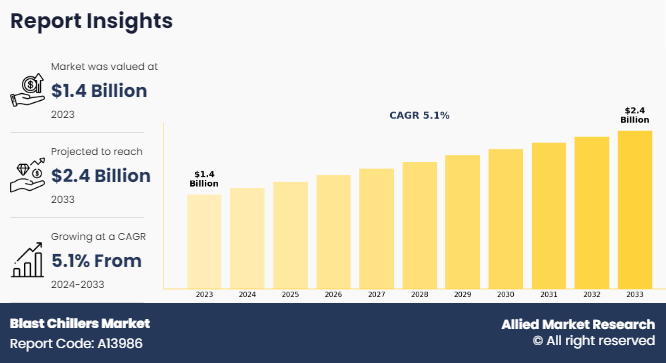
| Market Size By 2033 | USD 2.4 billion |
| Growth Rate | CAGR of 5.1% |
| Forecast period | 2023 - 2033 |
| Report Pages | 290 |
| By Capacity |
|
| By Product Type |
|
| By Application |
|
| By Region |
|
| Key Market Players | Sereva, SA, Electrolux Group, Mercury Systems, Inc., Illinois Tool Works, Inc., GEMM Srl, IRINOX S.p.A., Ali Group, Alto-Shaam, Inc., U-Line Corporation, ThermoKool |
The top companies analyzed for blast chiller market report are U-Line Corporation, Alto-Shaam, Inc., ThermoKool, Mercury Systems, Inc., Electrolux Group, Foster Refrigerator, Ali Group, IRINOX S.p.A., GEMM Srl, and Sereva, SA.
The roll in blast chiller segment is the most influential segment in the Blast Chiller Market.
The Asia-Pacific holds the maximum market share of the Blast Chiller Market.
The forecast period in the Blast Chiller Market report is 2024 to 2033.
The Blast Chiller Market is projected to reach $2,392.8 million by 2033, registering a CAGR of 5.1% from 2024 to 2033.
The base year calculated in the Blast Chiller Market report is 2023.
The company profile has been selected on the basis of revenue, product offerings, and market penetration.?
The market value of the Blast Chiller Market in 2023 was $1428.2 million
Loading Table Of Content...
Loading Research Methodology...

